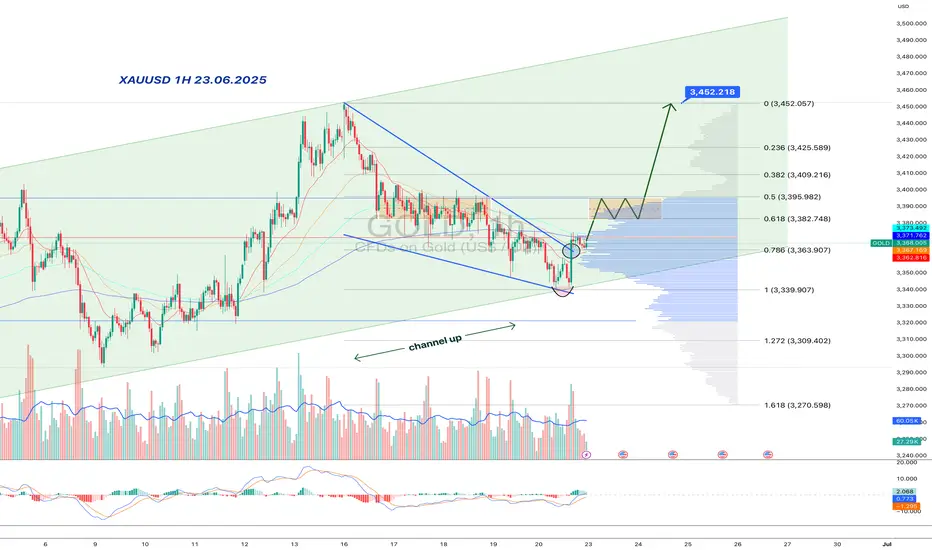
Gold:bullish wedge inside a rising channel-double trap for bearsInside the major upward channel, gold formed a falling wedge — and, of course, faked a breakdown. But the move reversed quickly: price reclaimed the wedge, surged on volume, and held above the key 3363–3368 area. This isn't just a bounce — it's a structural reclaim in line with the broader trend.
Price is now in the upper part of the rising channel and has broken a local downtrend line, reinforcing the bullish signal. Consolidation around 3380–3395 might be the last pause before acceleration. Above that lies a volume gap — no resistance until 3452.
MACD is flipping bullish, RSI turning upward, and volume confirms smart money presence. Classic: trap below, breakout above. As long as 3363 holds — longs remain in control.
Nextweek
Week 23 Bullish speed delivery Bias on Nasdaq.Looking for speed to show up next week and expand higher to reach out 22, 672.00 breaching trough the D SIBI after a potential Mon-Tue LOW.
I don't really wants to see price gyration around the D +OB on Monday and Tuesday even if pre-CPI. Better it would be to see a opening gap higher and a retrace into the gap to form the Low of the week Mon-Tue and then rally.
+ We're 2 weeks a head of contract change. Acceleration towards liquidity before the change in contract is usual behavior

Nasdaq Next Week and June Month ForecastNotice Monthly Candle distribution phase prior to the closure. Today might remain still and whips recent swings highs and lows as a reaction from the D +orderblock
Next week is likely to decline and open the monthly range with an accumulation inside the W BISI and THEN continue higher throughout the rest of the month and reach 22,672.00

Nasdaq and Indexes Week 22 BiasWhile the Indexes maitain a Bullish perspective on Weekly right now, I would not dare to anticipate next week "Flavour" but rather wait for The New Week Opening and if necessary till FOMC Minutes on Wednesday.
I would like to see immediate rejection from where price it's right now (allowing it to reach the IFVG starting at 20,690.00) to maintain a bullish bias rather then a deeper retrace, otherwise Bias may change on a Daily basis and pause that Weekly View for a later time .

SILVER 1DA possible scenario for silver on the daily timeframe involves buying from the levels of 30.90-31.00 with further targets at 33.02, 34.8291 and the expected completion of the rounding pattern with a subsequent movement to the zone 40.0251
Everything is clearly depicted on the graph!
Have a good day!

GOLD (XAU/USD, 4H) updateOn the 4-hour chart, GOLD has broken below the lower boundary of a pennant pattern on increasing volume, signaling potential for continued downside. Despite this, the asset remains within the confines of a bullish megaphone structure, whose boundaries are still intact. The EMA indicators (20/50/100/200) are aligned in a bearish sequence, exerting downward pressure. The price is consolidating below the $3295 level and is approaching key demand zones.
Near-Term Downside Targets:
- $3177 — Intermediate demand zone
- $3063 — Major support level
Technical Highlights:
- Breakdown from bearish pennant confirmed by volume
- Price action continues within the bullish megaphone pattern
- EMA 20/50/100/200 positioned above price, indicating overhead resistance
- Volume increases observed during downward moves
- Key buyer interest zone: $3060–$3080
- Resistance zone: $3295–$3305
Following the breakdown from the consolidation pattern, gold is exhibiting a downward trajectory targeting support zones at $3177 and $3063. The bearish scenario is technically confirmed as long as the price remains below $3295. However, the movement within the bullish megaphone structure warrants close monitoring for potential shifts in momentum.

Gold (XAUUSD) — Technical and Fundamental Analysis 2HTechnical Outlook
On the 4H chart, gold is forming a rising structure and is currently trading near the 3236–3260 resistance zone, aligned with the 1.272 Fibonacci extension. This area is expected to act as a short-term cap, with a potential corrective move ahead.
🔹 Key Levels:
Resistance: 3236, 3260
Support: 3132–3140 (trendline), 3082 (horizontal zone)
🔹 Formations:
Potential retracement setup after an extended impulse
Expected correction toward 3132–3140 (rising trendline)
If support holds, price may resume the uptrend toward 3308 (1.414 Fibonacci extension)
🔹 Indicators:
RSI near overbought zone
MACD shows momentum weakening
EMA 50/200 continue to support the bullish trend
Fundamental Drivers
Inflation concerns and soft landing expectations support safe-haven flows
Market is pricing in potential Fed rate cuts in H2 2025
Central banks continue to accumulate gold reserves
Dollar weakness provides additional support for gold prices
Scenario
Base case:
Rejection at 3236–3260 → pullback to 3132–3140 → continuation toward 3308
Alternative:
Break above 3260 → direct move to 3308.
Break below 3132 → possible slide toward 3082.

Gold (XAUUSD) – Technical Analysis for April 7, 2025 (1H)After a sharp drop, price reached the key demand zone around 3025-3030. This area forms a potential buy zone from which a rebound toward 3080–3100 may occur. The chart suggests a possible W-shaped recovery. A breakout above 3100 could unlock further upside toward 3127 and then resistance at 3167.
However, a breakdown below 3015–3020 could increase bearish pressure and lead to a decline toward 2997 support. Indicators are showing signs of local oversold conditions, hinting at potential technical recovery.
Main scenario – reversal from 3025-3030 with a move toward 3080–3100.
Alternative – breakdown to 2997.

EURGBP-NEXT WEEK 9-SEP-2024 TO 13-SEP-2024Currently, the market is forming a Head and Shoulders pattern, which suggests a potential reversal. On the 1-hour timeframe, a Cup and Handle formation has been identified, but the breakout isn’t strong enough yet, and a retest hasn’t occurred. However, volume confirmation on the 4-hour chart signals that the breakout may be imminent.
On the 15-minute chart, we see a triangle formation, but we are waiting for a retest to confirm our entry. The area of value lies below the resistance zone, which we will use to define our risk levels after the retest.
I am using Fibonacci retracement on the 4-hour chart to define the take-profit target. At the moment, there are no major obstacles like significant support or resistance levels on the way, which aligns well with our target.
The stop-loss is set 10 pips above the resistance on the 4-hour chart, giving us a well-protected position. The risk-reward ratio (RRR), which is calculated at 2.11, making this trade attractive in terms of risk management.

NEXT 400 %+ NEXT possible move up 400 %+
Show firs signal for growth, if we close weekly on this levels, next week i expect huge pump

NZDUSD LONG possbly Next week I'm expecting a bullish reversal on NZDUSD for a reversal back to the TOP.
this might be seen from next week.

$GBP - Think about a birds eye view...$GBP - Think about a birds eye view...
When trading I like to go towards higher TF in order go proceed to lower TF. Looking at weekly we are within a range of lows: 1.18 areas and highs: 1.23 a break to either direction. We had a mixed view on NFP but we extended higher and dollar declined we could see this theme continue another perspective I was looking at was spx/dxy that was interesting chart and can be discussed in further details in other groups I am part of.
Focusing on GBP - It's a break to either direction. We should be getting back to normal this week as holiday is over, regarding data most importance will be US CPI & Unemployment claims for GBP watch out for GDP. Be careful of your trades on data release.
Technical break out and TL are drawn and even if we was to put fib there we are at key area and could make our target 161.8 which matches pattern completing time will tell. Overall, I will looking at FX majors very carefully.
Hope you had a great first week of trading and plenty of more opportunities are yet to come this year.
All the best,
Trade Journal

Next week for spyTop of the week will start on a RSI cool down followed by a trip into bull territory. things cool off after new highs back down to support to prepare for the first day rally in Feb.

#analysis 32 - Liquidity Grab and Going down.Price may go up to 23k to get liquidity on next weekdays, then going down. Look forward to the low level at about 19k & 17.6k below.

Shiba inu next possible target's Shiba inu next possible target's and buying average points 💸🔥let's go shiba next pump coming soon ( I thing little correction happen for short term ✋) , but buying with average 😉.


ADAUSDT RANGE#ADAUSDT Update:
$ADAcurrently trading at $2.68
And $2.706 AND 2.903 are the next resistances.
So what now..?
ADA will be in a range between (2.482_3.126) If ADA could pass$ 3.126 then we can see a pump in the chart again, this pump is not stable
But If ADA breaks the $2.482 support level then ADA is entered in a bearish zone and My Target will be $2.224--$2.115.
Hope this will not happen.
My Levels:
Support: 2.482$/ 2.224 $/ 2.115$ / 1.991$
Resistance: 2.706$ / 2.903$ / 2.706$
longtime target: RANGE
sl: 2.482$
Must follow me for the latest crypto real-time updates.
good luck :)

Two key resistances broken, The daily resistance (blue one) and the weekly resistance (black one) have just broken. The next stop will be $47800 in my estimation but, It’s also possible to have a sideways trend before.
If the price could stay above $40k , the next target will be $47800 .
Trend Key Points Indicator have been used to draw important key levels and key points.

#USDCHF#... Coming Week's Trade... Keep it on the Watch!A trade worth taking on the Base
Watch it Guys


Amazon With Bull Potential For The Next WeekNASDAQ:AMZN with high bul potential.
The analysis from iAmPrediction states that the company is a long turn buy, according to its financials.
Furthermore, part of a blog post of Brian Deagon states that:
"D.A. Davidson analyst Tom Forte believes that Amazon is steadily evolving into being a much larger services company. The idea is, rather than disrupt and destroy businesses as it has frequently done, Amazon will instead try to help them. They'll cooperate with Amazon but still be in competition with it. It's a business strategy referred to as "coopetition." " (source investors.com, Brian Deagon)

gold next weekgold we test the ress above and will drop after to 1807. mabye a spike to 1800. after that it will go up. 1900 long term target

CHFJPY IDEAS El precio tiene dos escenerios posibles, si supera el HH podremos presumir que irá a tomar el punto de interés. Sin embargo si el precio rompe el HL podriamos plantear una venta.
