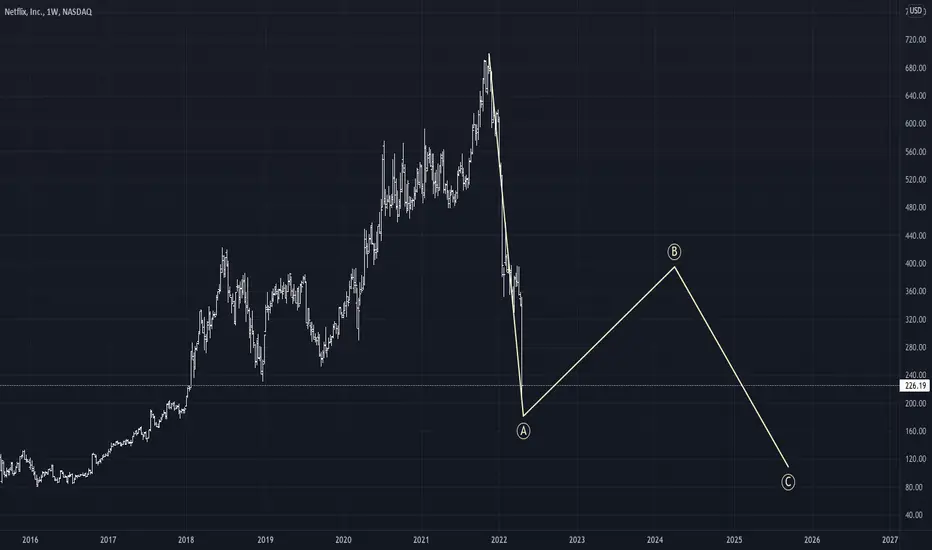
Netflix clear path going forward
In a nutshell for the non- analyst out there : I see a clear move down in Netflix fallowed by a correction and than a final move down.
For the wave analyst:
This is a clear wave A to the downside in 5 waves , now being in the 5th wave.
After the completion of this move down, a correction Wave B will follow and then the final move C down usually equal in length with the first Wave A but much shallower , and not that steep as this wave A.
Disclosure: I am not an investor in Netflix, this is my analysis and does not constitute financial advice.
What's your take on $NFLX ?
NFLX
NetflixWow , Netflix stock is huge sharp decreased and really i just determined one supply zone in weekly time but its not thecnical things its MACRO DATA THING

It look like the bridge in the Squid game..!All the gains in the past 50 months were wiped out..!
No need for more explanation..!
Try to be on the right side of the game is important..!
What if Netflix goes down another 30-50% from here?
Best,
Dr. Moshkelgosha M.D
DISCLAIMER
I’m not a certified financial planner/advisor, a certified financial analyst, an economist, a CPA, an accountant, or a lawyer. I’m not a finance professional through formal education. The contents on this site are for informational purposes only and do not constitute financial, accounting, or legal advice. I can’t promise that the information shared on my posts is appropriate for you or anyone else. By using this site, you agree to hold me harmless from any ramifications, financial or otherwise, that occur to you as a result of acting on information found on this site.

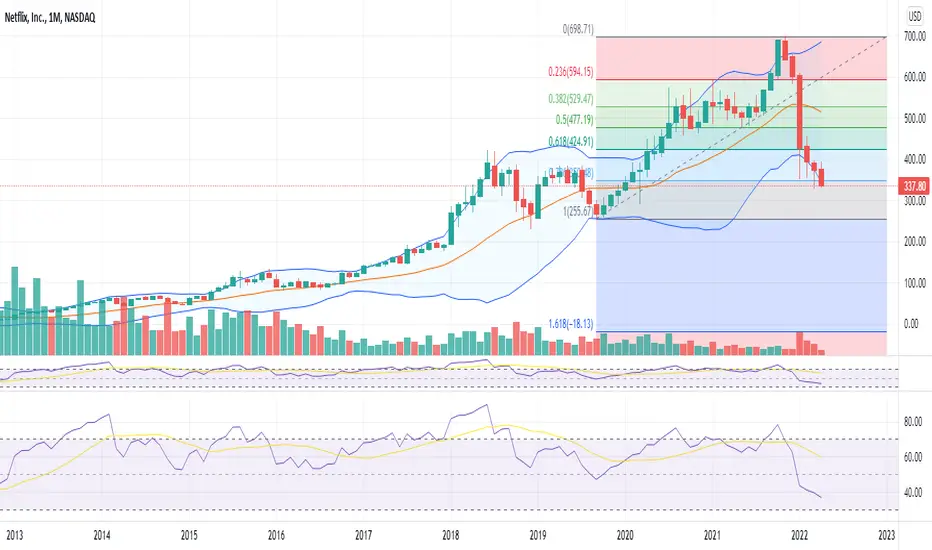
Netflix Investment Outlook Volume 2Top called July 27th, 2021, months prior. No surprises/remorse here! The idea is linked below.
Moving forward, Netflix's price action will be choppy and downward facing. ABC correction in progress; B wave recovery expected soon. Bottom of the historical channel - end game. Fundamentally, increased competition will continue the downtrend in subscriptions. Conclusion: Bear!

Was the NFLX sell-off predictable???Of course it was! You could have sold the head and shoulders bearish chart pattern back in November, before Jim Cramer said NFLX is a buy! :)
My forecast is that NFLX will make a small bounce before going even lower, at a buy area of $175 - 190.
Looking forward to read your opinion about it.

Netflix Potential Double BottomHey there as you know netflix bloody novadays, especially elon musk talk about this company. In technicaly we see double bottom here confirmation is 362 if we retest again 362$ its safe to bought this stocks.

WHAT'S GOING ON WITH THE NETFLIX QUOTATION? +67% FALL!What do you think about this? Are we in a favorable scenario to invest in Netflix shares? Do you think this drop will last longer or with the RSI at such a low level, can we get a breather from the market? Maybe even a trend reversal (which has been happening for a long time now, this price drop)

NFLX how can they guide higher? $267 next support?Last quarters guidance for growth was abysmal. This was BEFORE the Russian invasion of Ukraine, terminating service for 200,000 Russians. How many customers are lost in Ukraine? Before the "official" USA inflation numbers higher than expected. Before oil and gas surged squeezing the middle class in north America. These headwinds will continue to cause the consumer to begin cutting back on non-essentials. I think it's great NFLX will be cutting back on password sharing which might give them a small bump. Where will their growth come from? How can they curb inflation related expenses? The chart looks oversold but it was way oversold prior to the last ER too.
You May Be Having a Bad Day, but Not as Bad as Bill AckmanTrading stocks is tough, don’t let anyone tell you otherwise. Even the best have nightmare days. Today’s example would be billionaire Bill Ackman, CEO, and founder of Pershing Capital, a notorious hedge fund. With an MBA from Harvard Business school and 20 years in the business, he is a real pro. His fund generated approximately 70% returns in 2020 alone. This is remarkable considering this firm currently holds about $20B in assets under management.
At the start of the year, Netflix was down significantly from its highs. Ackman took this opportunity to accumulate shares, approximately 3.1M shares worth over $1B. The stock pulled back for roughly+20% gains. He looked like a genius.
However, yesterday after the bell, Netflix announced its quarter one earnings. It was not pretty. In this report, the company exceeded earnings expectations by 20% BUT it was their first-time instance of subscriber loss which was roughly 200,000. The company expected to add over 2M subscribers in this period. As a result, the company tanked roughly over 30%.
Quick Math
Invested = $1.1B (3.1M @~370)
Current = $685M (3.1M @~222)
Single Day Loss = $387M (3.1M @ 125)
Total Loss = $435M
So if you are having a bad day, you probably are not having as bad of a day as Bill Ackman, who has lost almost half a billion worth of his and his client’s money. This is a friendly reminder that even the pros have massive down days. Additionally, just because a security’s price has decreased significantly it doesn’t mean it can’t keep going down. #TrendIsYourFriend. Learn from other mistakes.
On another note, Howard Hughes Corp. ($HHC) filed a 13D, an SEC form required for ownership beyond 5%, which revealed that Pershing Square Capital owns 25% of the company. Should be interesting how this stock plays out in the near future.

NETF*** - The Beginning Of The End?Netflix is one of the many companies that used the global pandemic to their benefit. With millions being in lockdown, there was only so much board games you could play before you switched on Netflix.. and chilled.
When the pandemic hit in March 2020, Netflix saw a staggering growth of almost 100% in just a few months. In total, it went on to gain 142% from the start of the pandemic. As with all great series, it must come to an end, much like Netflix's uncontrollable growth.
Recently Netflix took a massive hit when their estimated growth in subscribers felt below par. It was projected that they'll get 2.5million new subscribers, which fell below investors expectation of 6.93million subscribers which started the year off pretty badly. Coupled with price hikes and competition from other streaming platforms, Netflix was haemorrhaging subscribers.
Recently, it took even a bigger hit. Investers were expecting Netflix to report another quarter of slowing subscribers growth but the results were even worse. Netflix lost 200k subscribers and it is expected that they'll be losing a lot more - perhaps millions.
Technical Analysis
From a technical standpoint, Netflix has started its downtrend and both fundamentals and technicals don't appear to show any signs of a reversal coming anytime soon.
Would be a good idea to sit on the sidelines for now and see how far Netflix will drop this quarter.
What do you guys think?
Leave your comments below!

Netflix post pandemic risk materialized in Amazon and DisneyThe news from Netflix this morning should not be a surprise to anyone, the company's executives had expressed two years ago during the peak of the pandemic that conditions were as good as they would get. With an increasing number of competitors coming under their skirt, Netflix is now reverting to the mean.
It would appear the third generation rule might be validating itself, as Netflix was the innovator and paved the way for other well-capitalized and more diversified competitors such as #AmazonPrime and #DisneyPlus the latter which has been punished for pushing radical progressive policies.
The key difference between Netflix and Disney is a multi-generational all-American brand, it is well entrenched in the global culture and has a massive war chest from diversified physical operations, cruise ships, music parks, and royalties across other entertainment segments.
Amazon has clearly a massive advantage being the owner of the largest cloud service AWS which in fact is used by Netflix for their operations. In essence, you can argue that Netflix is subsidizing Amazon Prime via operating expenses at USD$6B. Amazon Prime asymmetric advantages combined with the largest capital reserves from the largest online store, placing Netflix at the mercy of AWS.
In fact, we forecast that Netflix revenues and cash flows will continue to deteriorate to the point of no return within the next 24 months, placing itself as a target for Amazon.

NFLXNot financial advice.
The essence of investing & trading is the intelligent and patient preying on the greed, fear, impatience, addiction and ignorance of the majority. It's definitionally Darwinian.

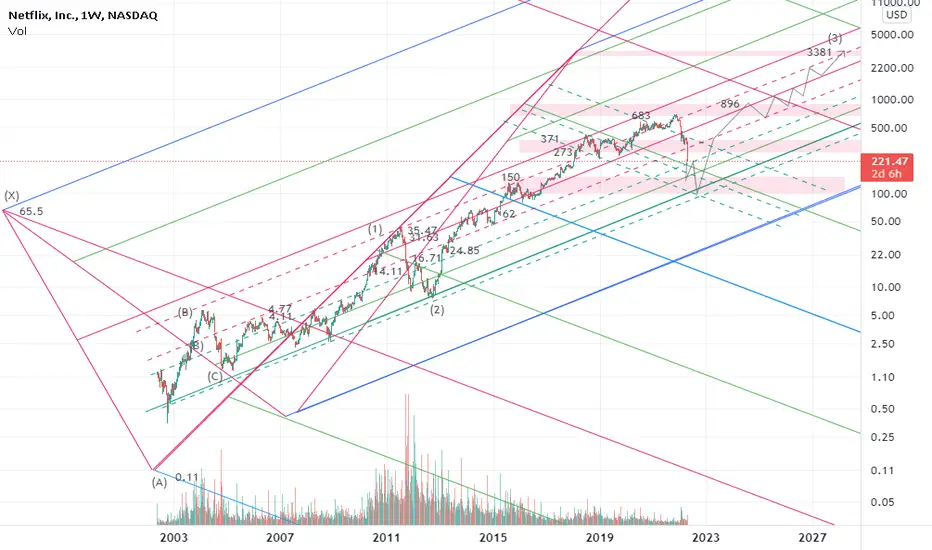
NETFLIX still has space till $100 to slidecrab harmonic pattern:
X=$65.5
A=$0.11
AB=0.61 XA
BC=0.38 AB
1.6 BC=$14.11
0.78 XA=$16.71
2 BC=$24.85
0.88 XA=$31.63
2.24 BC=$35.47
2.6 BC=$62.1
1.13 XA=$150
3.6 BC=$273
1.27 XA=$371
4.23 BC=$683
1.41 XA=$896
1.6 XA=$3381
NETFLIX, scenarios and targets Fundamentally :
After the quarantine ended, people went out of their homes and Netflix became less in demand in the entertainment industry.
But what if people get used to life without Netflix?
Netflix needs serious solutions like new, good and exclusive business to get its users back
Technically :
price can pump from this level (255; 210) to 350 and maybe till 445
the down scenario the next support will be at 130 per share

Netflix (NASDAQ: $NFLX) Nearing 2018 Correction Low! 🤑Netflix, Inc. provides entertainment services. It offers TV series, documentaries, and feature films across various genres and languages. The company provides members the ability to receive streaming content through a host of Internet-connected devices, including TVs, digital video players, television set-top boxes, and mobile devices. It also provides DVDs-by-mail membership services. The company has approximately 204 million paid members in 190 countries. Netflix, Inc. was founded in 1997 and is headquartered in Los Gatos, California.

Ignore the Noise... Recognize a Buying OpportunityAt the end of the day as long as this stays above 233.68 its a Buy.
- Bigger picture is NFLX can complete a Running Flat C wave if it stays above 233.68 (i.e. does not retrace more than 100% of wave B
- The 5 count of wave C has formed a wolfe wave with the equilibrium point slightly above where it looks like it will open today (i.e. supply = demand near 272)
- look for a bounce at open to test the equilibrium level:
If it breaks above it expect a run further to try and re-enter the wolfe channel [ Initial target 307 by May 2nd ]
If initial target is reached expect that momentum to carry it higher to test upper channel [ Intermediate Target 335 by May 24 ]
A breakout from wolfe channel will give it the setup to run Target = 475 by July 22nd . If this materializes I do not expect it to complete gap fill to 500s without undergoing a minor correction or a least consolidation first.
*** If NFLX has a sustained break below 233.68 it opens up a short opportunity - will re-eval. based on how it behaves in the 234-272 range. But subscribers, I assure you, have nothing to do with this. NOT FINANCIAL ADVICE.
Have a blessed day,
The Alpinist

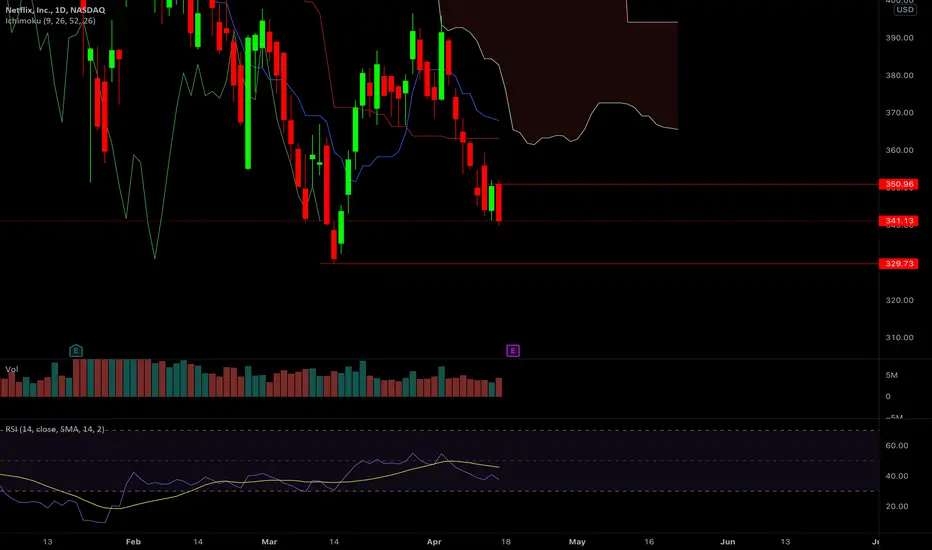
NFLX Potential for Bearish Reversal | 20th April 2022Price is moving nearer to the pivot level. We can expect a potential for bearish reversal from sell entry level of 351.85 which is in line with 78.6% Fibonacci projection towards the take profit level of 342.44 which is in line with 50% Fibonacci retracement and 61.8% Fibonacci projection. Our bearish bias is further supported by price trading below the Ichimoku cloud indicator
Any opinions, news, research, analyses, prices, other information, or links to third-party sites contained on this website are provided on an "as-is" basis, as general market commentary, and do not constitute investment advice. The market commentary has not been prepared in accordance with legal requirements designed to promote the independence of investment research, and it is therefore not subject to any prohibition on dealing ahead of dissemination. Although this commentary is not produced by an independent source, FXCM takes all sufficient steps to eliminate or prevent any conflicts of interest arising out of the production and dissemination of this communication. The employees of FXCM commit to acting in the clients' best interests and represent their views without misleading, deceiving, or otherwise impairing the clients' ability to make informed investment decisions. For more information about the FXCM's internal organizational and administrative arrangements for the prevention of conflicts, please refer to the Firms' Managing Conflicts Policy. Please ensure that you read and understand our Full Disclaimer and Liability provision concerning the foregoing Information, which can be accessed on the website.

Netflix - a Value Trap or Value Buy - You Decide!Oh. My. Goodness. Today's post is about Netflix. It's down 25% as I type. Yeeeeeesh!
So what happened? Well, bad earnings. Again. But here's the thing - this story gets more interesting. I don't own any Netflix, but I am watching it since the well known investor Bill Ackman plowed $1 billion into it last quarter. Oh, and by the way, OUCHY... He's now lost $250 million on that investment.
Kids, don't forget, it's not a loss until you sell 😜
60%... That's how much Netflix is down since its all-time highs a few months ago. Anyone who bought at those highs has been cut in half and then some. Investing and trading is not easy, and over the years, this always happens. Drawdowns, crashes, and bull markets and bear markets all come and go. The Netflix story fits all of that. Maybe that's why I felt like writing about it. I should also be totally clear: it's on my watchlist for a trade.
Let's dive in a little more, though, before deciding if we even should trade it.
I was pretty surprised to learn that Netflix's PE ratio is the lowest it's been in over 10 years. Netflix has a PE ratio in the 20s. If you look forward a year or so, its PE ratio is more like 18. At this point, you have to wonder, is Netflix a value investment? Wait, it's no longer a growth stock? Talk about the end of an era. I never thought I would see Netflix trading at a PE ratio like IBM.
The thing is, if Netflix can actually start churning out free cash flow at these levels, it really might be an epic value investment. It would also mean buyback time for them. Netflix has about $7 billion in cash. Surely they want to use some of this for their reinvestments, but also, at multi-year lows, a $2 billion buyback here is almost 2% of the company. Reed Hastings is a smart dude. He knows.
Let's keep going.
Netflix's market cap is approaching $100B again. This is its lowest valuation since 2019 and 2018. In Both instances, Netflix bounced and bounced rather quickly.
Hold up, Stef. Hold up. Are your really writing about potentially buying the dip in Netflix? No. Not at all. I am only thinking out loud. There is a bearish cash.
As most of us know, Netflix now has more competition than ever. There are more and more streaming platforms. In addition, is their content even that great? How does it compare to other companies? This is a determining factor as well. And, if it is the case, Netlfix is value trap. It will compete and compete, but no longer be a shiny growth stock.
Anyways, those are my thoughts. Streamlined and free to all of you. No subscription required.
I'll share an update if I actually trade this. In the meantime, my feet are up and I am watching in awe. The best entertainment is markets.

Strong Bullish Divergence forming on NFLX My trade idea which is awaiting confirmation
Confirmation would be a breakout and retest of the falling wedge in play in regards to the RSI failing to put in new lows.

Major BULLISH signal (NFLX)The price after accumulation forms an upward impulse.
I think that if the price reaches the level today, then a rollback is possible from it.
My goal is to support 350.
Disclaimer: All content has only educational and informational purposes, and never should be used or take it as financial advice.

Major BEARISH signalDisclaimer: All content has only educational and informational purposes, and never should be used or take it as financial advice.

$NFLX SHORT Will continue to monitor this long and watch for short opportunities we are a bit oversold but there are no major support lines to stop NFLX from going down to 329.73
$NFLX channel breakout after earnings?Netflix is the first to kick off the April earnings season for big tech. The stock's price has been stuck in a 3 month channel between $330 and $410. Depending on the quarterly results, we expect a big move in the price. A break in either direction would be around $70. See how the street treats this first earnings report in order to get an idea of the overall climate ahead of the big guns:)
