Breaking: Netflix ($NFLX) Surges 3% Amidst Topping Q1 Earnings The shares of Netflix (NASDAQ: NASDAQ:NFLX ) is surging 3.5% in Friday's premarket session amidst Q1 earnings beat.
Netflix (NASDAQ: NASDAQ:NFLX ) reported first-quarter earnings that topped analysts’ expectations, sending shares higher in extended trading Thursday, extending the gains to Friday's premarket session.
The streaming giant's revenue grew over 12% YoY to $10.54 billion, above the analyst consensus from Visible Alpha. Net income of $2.89 billion, or $6.61 per share, rose from $2.33 billion, or $5.28 per share, a year earlier, beating Wall Street’s expectations. The period marked the first quarter Netflix did not report subscriber numbers.
Netflix's Gains Come as Subscription Prices Rise
The better-than-expected results came in part due to higher subscription and ad revenues, the company said, along with the timing of expenses.
Netflix had raised prices for its plans in January, hiking its ad-supported plan to $7.99 from $6.99 per month, the standard ad-free plan to $17.99 from $15.49 a month, and its premium plan to $24.99 from $22.99 a month.
Netflix maintained its fiscal 2025 revenue projection of $43.5 billion to $44.5 billion. Analysts on average had expected $44.27 billion. The company's second-quarter revenue forecast of $11.04 billion exceeded Wall Street's estimate of $10.91 billion.
Co-CEO Greg Peters said Netflix expects to double its advertising revenue this year, as the company rolls out its ad tech suite. The suite is live in the U.S. and Canada, with 10 other markets expected in the months to come.
Technical Outlook
As of the time of writing, NASDAQ:NFLX shares are up 3.29% in Friday's premarket session. NASDAQ:NFLX chart pattern has formed a perfect resistant and support point carved out since the 11th of November, 2024. Should NASDAQ:NFLX break the $1064 resistant point, a break out might be imminent for the entertainment giant.
Conversely, failure to break above that point could resort to a cool off to the $800 support point. NASDAQ:NFLX RSI is primed for a breakout as it is not oversold nor overbought but well positioned for a bullish move.
NFLX

Netflix Pops as Earnings Top Estimates. Are Tariffs a Threat?Netflix NASDAQ:NFLX dropped its first-quarter earnings Thursday after market close and the headlines practically wrote themselves: a record net income, an earnings beat, and a 3% implied jump for the stock at the opening bell. All in a market where the Nasdaq is crying in the corner.
But as always in markets, the big question isn’t “What happened?”—it’s “What could mess this up?”
Ready, set, action: steep tariffs, Donald Trump, and the looming threat of a recession-fueled advertising freeze.
Let’s break down the earnings binge before we channel surf over to the risk segment. Spoiler: Netflix is on a roll—but geopolitical static might still mess with the signal.
🎬 Netflix Hits Record Numbers
The earnings season is picking up the pace. Netflix’s Q1 revenue hit $10.5 billion, up 13% from last year, with net income jumping to a record $2.9 billion. That’s a cool $600 million more than the same quarter last year—and a massive flex with earnings per share at $6.61. Wall Street was only expecting $5.71 a pop.
More importantly, the company raised its full-year revenue forecast to the range of $43.5 billion and $44.5 billion.
💿 How Many New Subs?
In case you're hunting for sub numbers moving forward—don’t bother. Netflix said last quarter they’re done reporting them quarterly. They’d rather focus on what “really matters”: revenue, operating margin, and ad growth.
In Q4 2024, the final quarter with a subscriber growth update, the company pulled off its biggest user-count gain ever: 19 million new accounts , bringing the global total to over 300 million. Not a bad way to drop the mic and ghost the group chat.
🍿 The Ads Are Working. So Are the Price Hikes.
In a move that would usually send churn metrics on a downhill slope, Netflix in January bumped its top-tier plan to $24.99/month in the US. Either that speaks volumes about content quality, or we’ve all collectively accepted that we’ll pay any price to avoid commercials.
That said, ads are quietly becoming Netflix’s next big profit lever. After a rocky launch in late 2022, the ad-supported tier is now gaining serious traction. According to estimates, 43% of new US sign-ups in February 2025 opted for the ad-tier plan, up from 40% in January. Netflix expects to nearly double ad revenue this year.
📺 Is Netflix Recession-Proof?
With interest rates high relative to four years ago, consumer wallets stretched, and geopolitical tension ratcheting up, Netflix Co-CEO Greg Peters had to address the elephant in the earnings room: what happens if people stop spending?
Streaming should survive the storm. As he put it, “Entertainment has historically been pretty resilient in tougher economic times.”
Executives also noted that during downturns, people tend to seek value. Netflix, with its endless scroll, becomes the budget-friendly indulgence of choice. It’s hard to argue with that when you’re five episodes deep into a true-crime docuseries at 3 a.m.
👀 But Then There’s That Nagging Tariff Thing...
While Netflix has so far been insulated from the direct hit of Trump’s revived trade war—most of its costs are content, not commodities—it’s not immune to broader market impact. Tariffs could rattle advertisers, especially if they trigger inflation spikes, slowdowns, or investor anxiety.
Ad budgets are notoriously skittish in volatile times, and if there’s one thing advertisers hate more than bad CPMs, it’s uncertainty. Already, there's chatter that major brands are planning to trim digital spending heading into the second half of the year.
Translation: if tariffs lead to an economic wobble, Netflix’s ad revenue (and by extension, its bullish earnings story) could face a tougher climb.
📢 Leadership Shuffle: No Drama, Just Strategy
In other corporate news, Reed Hastings, the co-founder who brought us DVD mailers, quietly transitioned from executive chair to non-executive chair. It’s more ceremonial than sensational, but it marks a passing of the torch to the current co-CEOs, who clearly have things under control—if this earnings report is any indication.
❤️ Wall Street Loves It—for Now
Netflix NASDAQ:NFLX shares are up 10% year to date, which looks especially shiny next to the Nasdaq’s NASDAQ:IXIC 16% drop. While tech has wobbled under tariff pressure and chip-stock drama ,
Netflix is moving in the opposite direction—proof that profitability, pricing power, and content diversity are still pulling in fresh capital inflows.
But don’t get too comfortable. If tariff fears escalate or ad momentum stalls, Netflix may need to prove all over again that it’s more than just a pandemic darling turned pricing juggernaut.
🎥 Final Frame: Chill Now, but Keep One Eye on Macro
Netflix’s Q1 numbers were promising — but that was just before Trump’s sweeping tariffs rattled global markets.
Added levies, recession risk, and shifting ad budgets could all become plot twists in Netflix’s otherwise upbeat storyline. For now, though, it’s lights, camera, rally.
Your turn: Are you still bullish on Netflix, or are Trump’s tariffs and economic drama changing your channel? Let us know what’s on your watchlist.

NFLX Weekly Options Trade Plan 2025-04-17NFLX Weekly Analysis Summary (2025-04-17)
Below is our integrated analysis for NFLX weekly options (expiry 2025‑04‑17):
──────────────────────────────
Summary of Each Model’s Key Points
• Grok/xAI Report – Technical indicators on the 5‑minute chart show oversold RSI and near‐lower Bollinger Bands, but the daily chart remains bullish (MACD crossover, above short–term EMA). – With earnings on the horizon, Grok/xAI sees potential for an upward move and recommends a call option trade at the $990 strike even though its premium (~$20.65) is high relative to our ideal range.
• Gemini/Google Report – Emphasizes that the recent earnings announcement is the dominant unknown. – The technical analysis is mixed (daily bullish but 5‑minute oversold), so they conclude that trading at the open is too speculative. – Their recommendation is to stand aside for now (no directional trade) until post–earnings clarity.
• Llama/Meta Report – Notes both bullish (daily trend) and bearish (short–term 5‑minute data) indicators and stresses that the upcoming earnings introduces significant uncertainty. – They conclude that the directional bias is “Neutral/Unclear” and advise against initiating a trade before the market digests the news.
• Claude/Anthropic Report – Reviews similar conflicting signals: short–term weakness on the M5 chart against daily bullish pointers. – With earnings risk and max pain at $940, they lean moderately bearish and propose a put option trade at the $960 strike (with premium around $22.85–$24.00) for a fast–expiry play. • DeepSeek Report – Points out that extreme uncertainty due to the earnings event (with a ±5.4% implied move) and conflicting technical signals (bullish vs. bearish) make a trade unappealing. – Their conclusion is also “NO TRADE” today.
────────────────────────────── 2. Areas of Agreement and Disagreement
• Agreement: – All models acknowledge that earnings are the key unpredictable factor today. – Everyone notes that technical signals are mixed: while longer–term (daily) indicators lean bullish, shorter–term (5‑minute) charts and key levels (support/resistance and max pain at $940) inject caution. – The volatility (high VIX and wide implied move) is recognized across reports.
• Disagreement: – Grok/xAI is the only model actively recommending a bullish play via a call option despite an expensive premium, banking on a post–earnings bounce. – Claude/Anthropic leans to a moderately bearish outlook and recommends a put, relying on the short–term weakness and the max pain influence. – Gemini/Google, Llama/Meta, and DeepSeek all call for no trade given the overwhelming uncertainty from the news.
────────────────────────────── 3. Conclusion
Overall Market Direction Consensus: • The market sentiment is highly uncertain. The earnings event injects significant risk such that pre–earnings technical signals (both bullish and bearish) lose much of their predictive power. The majority of the models (Gemini/Google, Llama/Meta, DeepSeek) advise caution and suggest that no directional bet should be taken at the open.
Recommended Trade (if any): • Based on the confluence of views – with most models recommending to wait and observe post–earnings price discovery – the overall recommendation is: NO TRADE RECOMMENDATION TODAY.
Details: • Strategy: Buy single–leg, naked calls or puts only • Expiration: Weekly options (0DTE, expiry: 2025‑04‑17) • Premium: While our target is $0.30–$0.60 per contract, the available near–the–money options have much higher premiums and reflect elevated risk levels. • Entry Timing: Not applicable • Confidence: Very low confidence in a directional bet given the earnings risk • Key Risks: Earnings uncertainty remains the dominant risk. Pre–earnings technical signals conflict, and ordering a trade without seeing post–earnings market reaction could result in a rapid adverse move.
────────────────────────────── TRADE_DETAILS (JSON Format) { "instrument": null, "direction": null, "strike": null, "expiry": null, "confidence": null, "profit_target": null, "stop_loss": null, "size": null, "entry_price": null, "entry_timing": null }
Disclaimer: This newsletter is not trading or investment advice but for general informational purposes only. This newsletter represents my personal opinions based on proprietary research which I am sharing publicly as my personal blog. Futures, stocks, and options trading of any kind involves a lot of risk. No guarantee of any profit whatsoever is made. In fact, you may lose everything you have. So be very careful. I guarantee no profit whatsoever, You assume the entire cost and risk of any trading or investing activities you choose to undertake. You are solely responsible for making your own investment decisions. Owners/authors of this newsletter, its representatives, its principals, its moderators, and its members, are NOT registered as securities broker-dealers or investment advisors either with the U.S. Securities and Exchange Commission, CFTC, or with any other securities/regulatory authority. Consult with a registered investment advisor, broker-dealer, and/or financial advisor. By reading and using this newsletter or any of my publications, you are agreeing to these terms. Any screenshots used here are courtesy of TradingView. I am just an end user with no affiliations with them. Information and quotes shared in this blog can be 100% wrong. Markets are risky and can go to 0 at any time. Furthermore, you will not share or copy any content in this blog as it is the authors' IP. By reading this blog, you accept these terms of conditions and acknowledge I am sharing this blog as my personal trading journal, nothing more.

$NFLX - EARNINGS - Expected MoveNASDAQ:NFLX - EARNINGS - Expected Move
50DMA & 30min 200MA Pointing down, huh? 😏

Netflix (NFLX) – A Safe Haven Amid Tariff UncertaintyKey Supporting Arguments
Amidst the unpredictability of Donald Trump's tariff policies, Netflix might serve as a defensive play.
Positive consumer sentiment, a surge in subscriber growth, and strategic hikes in subscription prices are poised to power robust results for the first quarter of fiscal year 2025.
Investment Thesis
Netflix (NFLX) is a global leader in video streaming, offering a vast library of original and licensed content to subscribers worldwide. With over 95% of its revenue stream coming from subscriptions, the company secures a solid foundation against the whims of market volatility. NFLX’s nascent foray into advertising contributes a mere 3% to its revenue, ensuring that any tremors in the macroeconomic climate have a minimal ripple effect.
Netflix's business model, anchored in subscription revenue and expansive geographic diversification, shields the company from the whims of unpredictable tariff policies. Amidst the relentless cycle of tariffs being slapped on and lifted from a variety of products and the growing tide of protectionism, streaming platforms such as Netflix, which thrive on subscription-based models, emerge as devensive assets. This is largely because they steer clear of the tumultuous world of physical goods production, importation, and exportation. The sustainability of the company’s streaming empire is anchored in its formidable user engagement—clocking in at around 2 hours per household daily—paired with historically low subscriber churn and entertainment value that punches well above its price tag. These elements collectively mitigate NFLX’s risk profile in the face of a potential recession. While advertising revenue may take a hit if trade tensions intensify and trigger an economic downturn, it is worth noting that ads only contribute to about 3% of Netflix's total revenue. Despite its worldwide footprint, the company still rakes in a hefty slice of its revenue—around 40-45%—from the U.S. market, offering a protective buffer against possible international sanctions or restrictions. Meanwhile, its strategic geographic diversification across Europe, Latin America, Asia, and the Middle East not only mitigates risks but also fortifies the sustainability of its business model.
Netflix is poised to potentially exceed expectations in its Q1 2025 earnings report. In Q4 2024, the company shattered expectations by pulling in a recordbreaking 19 million new users, a surge we anticipate will roll into 2025, powered by its rich and diverse content lineup. By the year's end, Netflix strategically hiked prices in the U.S. and UK, a move poised to bolster its Q1 2025 revenue. With a bold target of 29% growth for 2025, the company is banking on buoyant consumer spending and these subscription price upticks to hit the mark. Netflix projects a free cash flow of no less than $8 billion, creating a strategic opportunity for potential share buybacks.
Our target price for NFLX over the next two months is pegged at $1,080, paired with a "Buy" recommendation. We suggest setting a stop-loss at $880.

Netflix (NFLX) Share Price Jumps Nearly 5%Netflix (NFLX) Share Price Jumps Nearly 5%
According to the charts, Netflix (NFLX) shares rose to their highest level since early April, while the S&P 500 index (US SPX 500 mini on FXOpen) declined by approximately 0.2% yesterday.
Since the beginning of 2025, NFLX’s share price has increased by more than 8%, showing resilience in a volatile stock market that remains sensitive to the escalation of the global trade war.
Why Is Netflix (NFLX) Gaining in Value?
The strong performance may be attributed to three key factors:
Jason Helfstein, an analyst at financial holding company Oppenheimer, believes the company likely faces “limited” risks. Netflix does not sell tradeable goods subject to tariffs and could even benefit from a potential economic downturn if consumers opt to stay home more often.
According to The Wall Street Journal, Netflix has set a target of reaching a market capitalisation of $1 trillion and doubling its revenue to $39 billion by 2030.
Positive sentiment ahead of the earnings report – yes, Netflix is one of the first to release its quarterly results.
Technical Analysis of NFLX Share Chart
The share price is moving within an upward channel (shown in blue), with strong support in 2025 provided by both the lower boundary of the channel and the $840 level – a level originating from the powerful rally at the end of 2024.
On the other hand, the price has now approached the psychological $1000 level. It is possible that, in light of the upcoming earnings release (scheduled for tomorrow, 17 April), the bulls may attempt a breakout and aim to secure a foothold in the upper half of the channel.
This article represents the opinion of the Companies operating under the FXOpen brand only. It is not to be construed as an offer, solicitation, or recommendation with respect to products and services provided by the Companies operating under the FXOpen brand, nor is it to be considered financial advice.

NFLX - Long Term ChannelA large channel for NFLX that I think price will remain in
I do think a bear move is coming soon before the run up plays out
This is similar to an earlier situation on the NFLX chart that I have labelled with circles in red
Weekly chart

NFLX & chilling w/ putsUpdate to my chilling status on NFLX. 4/7/25 gap down, retest of a critical breakdown point for me 910.
Target 825-775 (this week or next week).
Overall mkt bearish due to Tariffs.
@ContraryTrader even left us a clue in my previous update (May/June).Thank you!
*The magic wand feature seems to be extra... & I love that. I'll get a handle on it. Until next time, shorting pops through earnings.

Netflix Short Idea: 30% Downside!Netflix - NASDAQ:NFLX Weekly Chart Analysis
Short Idea:
- Expanding Triangle Pattern Breakdown
- H&S Breakdown
- AVP GAP to fill
- Declining Wr%
- Red H5 with bearish Cross
Targets:
$750/ 695/ 595/ 543/ Maybe $400's
Not Financial Advice

Bearish Setup on NFLX: Correction Wave (C) UnfoldingTF: 4h
NFLX appears bearish at the moment. The corrective structure on the 4-hour timeframe suggests a potential decline. The current formation indicates that wave B likely completed at 998.61 , and the stock has now begun its descent into wave (C) of the correction.
The correction may extend to the 100% projection of wave A at 788.67 , or potentially deepen to 659.06 , aligning with the 1.618 Fibonacci extension of wave A. After the completion of wave (C), traders can buy for the target up to wave B at 998.61 .
I will continue to update the situation as it evolves.

$NFLX interesting setup; conflicted.Head and shoulders but some kind of support there in $870-$880? Looks good to retest $1000 as well. Hmm.
WSL

bear call spread on NFLXWE LOOK like a head and shoulders here. The LAST time we broke below the 100 sma, we went 50% towards the 200 sma. That can / could happen again, especially with AAPL And QQQ being weak...

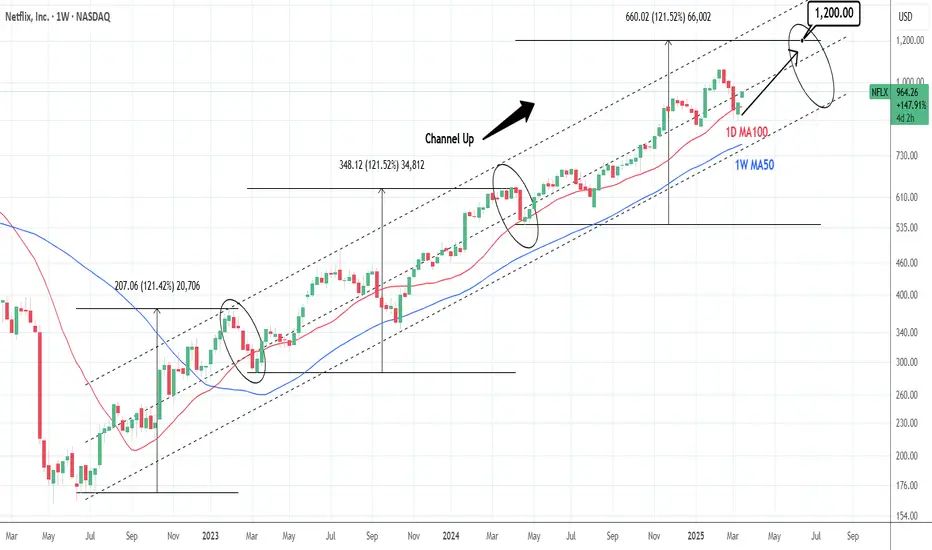
NETFLIX: Strong buy opportunity with this 1D MA100 bounce.Netflix is neutral on its 1D technical outlook (RSI = 52.399, MACD = -10.400, ADX = 30.636) and is rebounding on the 1D MA100. This is another HL on the 20 month Channel Up, which should be enough to give the stock a push to a new HH. The Channel Up is on its 3rd main bullish wave and both prior saw a +121.52% price increase. We expect the 3rd one to be completed by July. The trade is long, TP = 1,200.
## If you like our free content follow our profile to get more daily ideas. ##
## Comments and likes are greatly appreciated. ##
Netflix: New All-time High!As expected, Netflix reached a new all-time high at $1,067, completing the magenta wave . Since then, the stock has already pulled back by nearly 20%. The ongoing magenta wave should extend further into our new magenta Target Zone, which spans $789.04 to $704.43. Since we anticipate a sustainable rebound from this range, it presents an opportunity to initiate or expand long positions. Such long entries could be hedged with a stop 1% below the Zone’s lower boundary, as there is a 30% chance that Netflix will drop below the Zone to complete the green wave alt. .

OMNICHART presents => NFLX - long term trendNetflix is still in an upward channel - in a long term bullish trend. In the coming months if it meets the support line and bounces off then that would be the time to buy leaps or scale into additional long term positions. Or start scaling in along with a put spread/s until the support line for a year. A tweak in the trade do make additional income would be to sell put at the support line for every week or month and most likely it will expire worth less and then sell a subsequent put (for week or month) at a point higher on the support line , basically keep selling your puts on the support line as time moves along and the price is above the support line. This was you might just cover the price of the long put you bought today and even make additional income. And if the stock goes up you are still making money. This buys you additional protection for free based on how disciplined you are with managing the put spread (especially the short end of it).

Netflix (NFLX) Shares Among the Biggest Losers in the US MarketNetflix (NFLX) Shares Among the Biggest Losers in the US Stock Market
According to market charts:
→ Netflix (NFLX) shares fell by approximately 8.5% during yesterday’s trading session, indicating that bulls failed to sustain the price above the psychological $1,000 per share level.
→ The S&P 500 index (US SPX 500 mini on FXOpen) hit a new low for 2025, closing down around 1.3%.
These declines reflect bearish sentiment in the US stock market, which may be driven by:
→ Uncertainty over Trump’s trade tariff policies. Yesterday, the White House postponed the introduction of tariffs on trade with Canada and Mexico for a second time, now pushing the deadline to early April.
→ Anxiety ahead of the Non-Farm Employment Change report release (scheduled for today at 16:30 GMT+3), as recession fears continue to mount.
Selling pressure was particularly strong in Netflix (NFLX) shares, as analysts (according to media reports) issued a cautious outlook on subscriber growth for the streaming giant. This may stem from concerns that the company's low-cost, ad-supported subscription model is losing its initial positive impact.
Technical Analysis of Netflix (NFLX) Stock Chart
Price movements in 2025 have formed an upward channel (marked in blue), which remains intact for now.
The $955 level, which previously acted as support, may now serve as resistance. If bearish sentiment persists, the price could continue its downward trajectory. However, bulls may find hope in key support areas, including:
→ The lower boundary of the current price channel.
→ The $870 level, which marks the lower limit of a broad bullish gap formed after a strong quarterly earnings report (as we noted on 23 January). This level has also acted as a key reversal point multiple times.
Analysts’ Forecasts for Netflix (NFLX) Stock
Overall, analysts remain optimistic. According to TipRanks:
→ The average 12-month price target for NFLX is $1,100.
→ 29 out of 37 analysts recommend buying NFLX shares.
Trade on TradingView with FXOpen. Consider opening an account and access over 700 markets with tight spreads from 0.0 pips and low commissions from $1.50 per lot.
This article represents the opinion of the Companies operating under the FXOpen brand only. It is not to be construed as an offer, solicitation, or recommendation with respect to products and services provided by the Companies operating under the FXOpen brand, nor is it to be considered financial advice.

NFLX - NetFlix is overhyped an TA says tooBesides what I think about NFLX (bad for you, poor quality & service, lairs etc.), there is something that can be used to rate and judge a Stocks pricing - The Technical Analysis.
The white Fork projects the most probable path of price. The U-MLH is the upper stretch, the L-MLH the lower and the CL is the Center, where price is in equilibrium.
Where is price now?
It mooned to the upper Warning-Line!
Such moves are insane, crazy, not healthy and produce by manipulation and/or greed that eats Brains.
However - As I follow the rules of the Medianlines (Forks), I know that price is hyper extended up there. So, it can't go further? Of course it could. But Chances are poor that it will.
Instead, Chances are high that price falls down to the U-MLH. At least.
Why?
Besides price is stretched, it failed to move up to the next Warning Line (WL2).
So, there you have it.
I'm shorting NFLX and my target is at least the U-MLH, with further downside potential with PTG2 at the Centerline.

Bonus Analysis: 80 Stocks Reviewed, 15 Stand Out!Hello readers!
First things first – if you find value in these analyses, don’t hesitate to hit the Boost/Like button! 🚀 Your support helps keep these ideas coming and is greatly appreciated. Thanks a lot!
As an extra bonus for everyone who participated in the survey, I decided to go through all the mentioned stocks—a total of 80 different names—and pick out the ones that stood out to me from a technical perspective. Made just a brief overview.
Previously, I covered the top 15 most mentioned stocks, but now it's time to highlight 15 additional setups that caught my eye with very short descriptions. These are purely technical insights—no fundamental analysis here.
To be said, many of the stocks mentioned were at all-time lows, which means technical analysis isn’t much help. If a stock is sitting at the bottom with no structure, you’re relying purely on fundamentals to make a decision.
With that said, let’s take a look at the charts that stood out.
1. Oklo (OKLO) – Nuclear Energy
Strong momentum, but for me, the most important area is $20 to $30.
2. Tecnoglass (TGLS) – Glass and Window Manufacturing
Steady higher highs - The strongest zone sits between $50 to $60.
3. MicroStrategy (MSTR) – Software and Bitcoin Holdings
Extremely volatile but key interest zones for me are $170 to $240, with $200 as a strong mid-point.
4. Everest Group (EG) – Reinsurance and Risk Management
$250 to $280 was a strong resistance, now acting as support. Trendline retest and third-touch scenario align well with the $230 to $280 range.
5. H. Lundbeck (HLUN_B) – Pharmaceuticals
Resistance turned support has already played out but still, there might be some volatility, and $35 to $40 DKK remains the strongest zone.
6. Alpha Group International (ALPH) – Financial Services
Breakout and retest already worked well, so waiting for slightly better prices might be the best move but it is valid.
-------
I’ve picked out the first six stocks from the survey and shared my technical insights here on TradingView but this is just the beginning.
9 stocks in Substack with some bigger names like Alibaba (BABA), Starbucks (SBUX), Snowflake (SNOW), Uber (UNER), and Netflix (NFLX) have also caught my eye, and I’ll be covering them on my Substack along with more technical breakdowns.
Substack-ENG link is in my BIO (clicking the website icon), or you can find it by scrolling up - just below the main image.
See you there,
Vaido

Netflix - We Know What Will Happen Next!Netflix ( NASDAQ:NFLX ) will retest the trendline next:
Click chart above to see the detailed analysis👆🏻
About six years ago, Netflix started the creating of a reverse triangle pattern, perfectly trading between the two trendlines. We already witnessed such a behaviour back in 2012 and following this previous bullish cycle, it is super likely that Netflix will head even higher.
Levels to watch: $1.200
Keep your long term vision,
Philip (BasicTrading)

NFLX - Fundamentals and simply a great company to invest in!Hi guys, next we would be looking into NFLX , which has had a tremendeous year already! It is up 480.28$ YTD as of today 26th December , which accumulates to 103.99% upside of their stock value. Currently they have shown fantastic financial data throughought Q1,Q2,Q3 not only that they showed a good growth towards their subscribers, and last but not least they just started their NFL Program which launched recently which definitely would boost their revenue.
Additionally they signed a very important contract that goes as follows :
Contract:
Deal with Fifa, soccer’s global governing body, covers the 2027 and 2031 editions of the Women’s World Cup
Agreement covers Puerto Rico and includes both English and Spanish-language broadcasts
Netflix will produce an exclusive documentary series in the lead-up to both tournaments
Streaming platform’s coverage will also feature studio shows
So the stars are alligning for this company and I am deffinetely looking for the break through to the levels above 1,000$ per share.
Entry: on market open - 935$
Target: 1,150$
As always my friends happy trading!
P.S. If you have questions or inquiries about one of my existing set-ups or personal questions / 1 on 1 sessions consider joining my channel so you can follow up with me in private!

NFLX Netflix Options Ahead of EarningsIf you haven’t entered NFLX in the buy zone:
Now analyzing the options chain and the chart patterns of NFLX Netflix prior to the earnings report this week,
I would consider purchasing the 850usd strike price Calls with
an expiration date of 2025-1-24,
for a premium of approximately $41.75.
If these options prove to be profitable prior to the earnings release, I would sell at least half of them.

Sell, Hold, or Hope? Netflix Approaches $1000Hi,
Looking at Netflix's historical price behavior around psychological round numbers ($100, $500), we see a pattern that indicates it might be a good idea to lock in some profits at these levels.
Why?
- Round numbers often act as psychological barriers where prices tend to consolidate or range for a while, limiting further growth.
- There's a significant chance of a correction, especially after a strong rally like the one we've seen recently.
Both of these scenarios suggest it's worth considering taking some money off the table. One thing is for sure: please avoid letting FOMO influence your decisions at these prices - don't buy it at the moment. There will be better changes, just be patient enough!
Historical Examples of Psychological Round Numbers
$100 Level (2015-2016)
In July 2015, Netflix approached the $100 level. While it did show some upward movement, the price largely ranged around this area until late 2016. It was stuck for months, offering limited returns for those who didn't react.
$500 Level (2021-2022)
Around $500, Netflix once again demonstrated the same behavior. For about a year, the stock did little more than range around this level. This shows how powerful round numbers can be as areas of stagnation.
Current Major Level: $1000
While Netflix has surpassed previous round numbers, $1000 is shaping up to be the most significant psychological level yet. The rise to this point has been enormous, and history suggests that sooner or later, a correction is likely.
If you're not prepared to hold through a potential correction or consolidation, the current price levels might be an ideal time to lock in profits. Long-term holders who stick to their thesis might choose to ride this out, the choice is yours. However, for mid-term investors, locking in some gains here could be a wise move!
"Sell, Hold, or Hope?"
Let's say in that way - I hope that some holders will sell around current prices! ;)
All the best,
Vaido

NFLX - It's not too late!It's not too late...
You have a 60-70% chance of grabbing NASDAQ:NFLX at $920 on the retest!
Stay patient, stay ready
Not financial advice
