NFLX at supportNice pullback into the bottom of the channel/trendline and support.
There is a lot of confluence in this trade, however it is safer to wait for any sort of rejection of last week's low.
Target to be a new ATH
NFLX

Massive 1 year inverted diagonal Head & Shoulders on RokuRoku is a buy in the blue zone (112 - 118). Ideal price is 116.
- That represents the 618 retracement from its most recent trough and peak.
- It's also where the 50 day moving average falls (118)
- And where the most significant short term structure is.
And here is Roku inverted on a longer term basis... Sometimes seeing charts upside down show things more clearly.

NETFLIX"Netflix Inc. overtook Walt Disney Co. in market value for the first time since last year after the amusement park owner's earnings stoked concerns about slowing subscriber growth in its streaming business." (1)
Right now, Netflix is in the Top 5 list of producers of original television and movies. After titles such as Squid Game, Stranger Things, and more, we saw a great pump in Netflix's value.
As NASDAQ announced, the ATH for Netflix is at $690.31, our most substantial resistance level.
NASDAQ is also showing Strong Buy Volumes for Netflix, which shows solid support for its value.
My research showed that Netflix has the potential to reach the $1000 levels (or close to that area), so it's safe to say that we have the chance to break this resistance after a few retests.
Use this chart as your trade setup for now; I'll keep it updated.
Current Market Price: $682.61
Let me know your ideas.
Good luck.
Citation:
(1) "Netflix Is Closing In on Disney Again In Terms of Market Value."
finance.yahoo.com

NFLX- POST TRADE ANALYSIS- JournalEveryone has different time horizons, goals, and trading strategies. It's essential to know the strategy of the person you are following. If they are a day-trader and you are a position trader, then their entries and exits won't make sense to you. I prefer to be a position-trader, but this current market has temporarily turned me into a swing-trader
One of the best ways to become a better trader is post-trade analysis. When I am on top of my game in a perfect world, I take a snap-shot of the chart when I put the trade on. And a snap-shot when I sell. If I don't have time to do this, I might want to choose a different hobby. :-)
Even though I was in profit on this one, I felt the chance of going higher did not outweigh the risk of a pull-back since it seemed extended to me.
I am happy with my decision.
10/21/2021 NFLX 652.1299
11/1/2021 NFLX 680.02
EDUCATIONAL PURPOSES; NOT INTENDED AS TRADING ADVICE.

$NFLX - Can these levels get any better?Beautiful Fib Levels on 4H chart for Netflix! After nice dip, NFLX looks to resume the upward movement...
or is it going to fail??


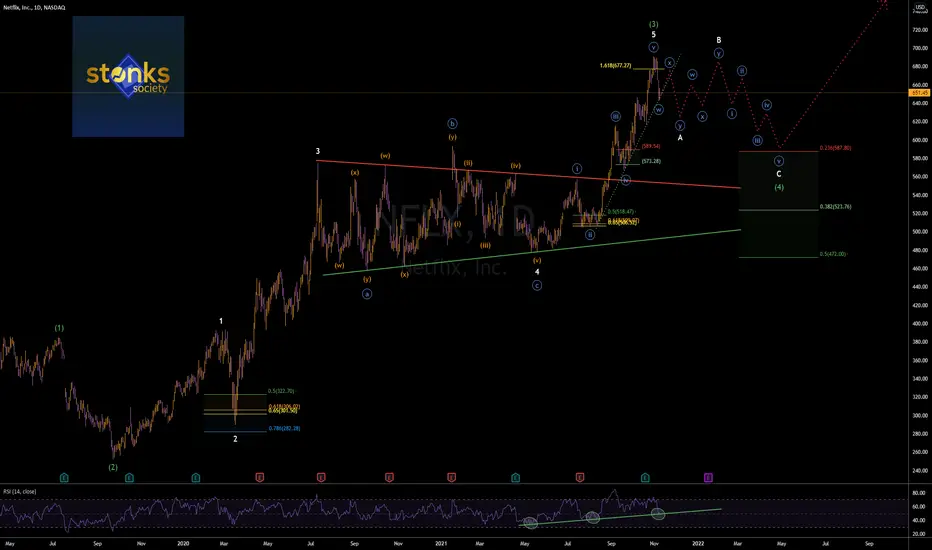
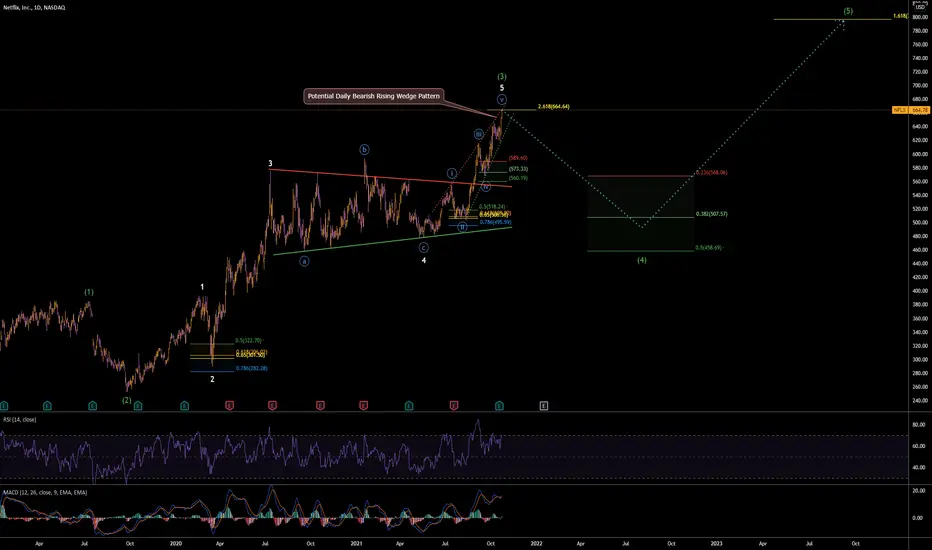
$NFLX | WEEKLY WATCHLIST 11/8Netflix is one of the few counts I have that look to have a potential significant local top put in. Looking for a corrective wave 4 to take place here and would be very healthy for the stock. Wait for confirmation first.
High confluence of intraday supportsThe stock after reaching it's new highs made a correction. Now It shows a bearish rejection in a zone with confluence of supports (61.8 Fibo, Trend line, Support traced by the previous test high), If the price increases it's bullish momentum, it may resumes its bullish bias

Netflix Analysis 30.10.2021Hello Traders,
welcome to this free and educational analysis.
I am going to explain where I think this asset is going to go over the next few days and weeks and where I would look for trading opportunities.
If you have any questions or suggestions which asset I should analyse tomorrow, please leave a comment below.
If you enjoyed this analysis, I would definitely appreciate it, if you smash that like button.
Thank you for watching and I will see you tomorrow!

S/t NFLX route@wardaK This one is for you. You asked what's my current though on NFLX S/T.
I believe we see NFLX show some sign of consolidation possibly after it goes towards 700 pysc lvl.
Expect Support to be held from 662-672 to be held and bot up for the next rips.
Market leader iMO -- alongside FB , TSLA , COST

NFLX s/tShort term trade , possibly can happen today. NFLX over highs will be targeting 690 $ .
Been on fire . Currently in ROKU , don't personally like Nflx options , only commons for this one.

If you think technical analysis does not work, look at this!I published this analysis on October 18, 2021.
Today, you can see it hit the target zone!
If you have no time to learn different tools in technical analysis, at least do yourself a favor and learn how to use regression channels!
However, Regression channels are not pure technical analysis!
It is actually a statistical tool..!
Most quant funds use statistical models to open and close their position..!
The most famous model is mean reversion!
What Is Regression?
Regression is a statistical method used in finance, investing, and other disciplines that attempt to determine the strength and character of the relationship between one dependent variable (usually denoted by Y) and a series of other variables (known as independent variables).
Now, let's consider Y=Price and X=Time!
Now, you should do the math..! But do not forget we have different types of regression models: Quadratic, Qubic, Sinusoidal, and logistic...etc.
Look at these examples:
Bitcoin:
Solana:
NFLX:
USOIL:

Less room for movement, Ascending Wedge NFLXHello everyone! A rising wedge is commonly know as a reversal pattern, I'm looking to short NFLX once we reach the resistance zone in this rising wedge. Even with all the hype from Squid Game numbers and positive earnings, price is not moving much as weeks before. Today Oct 19 NFLX rise in post-market trading to the 663 (wedge resistance zone) and pullback immediately, coincidence? Just an easy setup, remember to have a stop loss!
Not a financial advisor, just my personal idea. Enjoy your week.

FXCM FAANG Basket Moves Into Bullish Stack On the DailyThe above chart show's the daily time frame of FXCM's FAANG Basket. We are using a triple EMA system to assess trend. The short-term green EMA > intermediate orange EMA and the intermediate orange EMA> the slow red EMA (blue rectangle). We note that NFLX reported last week and that the rest of the FAANGs (FB, AAPL, AMZN, GOOG) will report this week. Following their respective releases we will assess the basket's EMAs and their angle and separation. If these develop, it will be regarded as bullish, suggesting that a possible bullish momentum push may be underway.

$NFLX | WEEKLY WATCHLIST 10/25If markets show signs of weakness at any point in the near future, I believe Netflix will be one of the most prime short setup out there. Many signs pointing to downside here for the stock.
- Recent run-up due to overall hype and the massive success of Squid Games (believe we need to cool off a bit)
- Concluded all Minute, Minor and Intermediate EWT counts (assuming my count is correct)
- $VIX sitting on major support and is at it's second lowest weekly close since 2/10/20 (market is susceptible to a pullback)
With that being said, I will wait for downside confirmation as well as volume before entering a short position on Netflix. I would also want the indices to be confirming on a downtrend as well as $VIX to be in an uptrend. These factors combined would get me short. All in all, I'm still bullish in the long-term as shown.
$CRWD $SQ $TEAM $NFLX I OptionsSwing WatchlistCRWD 4H I CRWD is still testing ATH levels near $290. Our scanners picked up more activity betting on a break to $310 before 11/19. CRWD average price target is $315.
SQ 4H I SQ filled the gap last week and the OS ALGO SQ $250 calls we highlighted on our watchlist went from $3.85 to $15.50! Or a 300%+ play! Seeing support near $250.
TEAM 2H I The OS ALGO TEAM $410c 10/22 contracts we highlighted last week ended up going deep ITM. TEAM is reporting earnings on 10/28 after hours.
NFLX 4H I NFLX outperformed the market after beating earnings. Its average price target is $677, and we are starting to see a bearish divergence on the RSI.

Q3 Earnings Report Recap; TSLA, NFLX, JNJ, PGQ3 earning season is currently underway, and most high-profile companies are delivering revenue beats. Yet, Q3 revenue is not the only thing investors are watching. Investors are interested in revenue growth, customer acquisition, and pace of growth alongside the balance sheet. Inflationary and supply chain pressures that may affect the outlook of reporting companies are an additional concern for investors.
TESLA (NASDAQ: TSLA)
Reported: Wednesday, after trading
Revenue: $13.8 billion
Earnings per share: $1.86 profit per share (Non-GAAP)
Tesla’s Q3, 2021 earnings were, once again, record-setting for the Company. The Company is increasing sales and has stated it is on track to “achieve 50% average annual growth in vehicle deliveries” at a time when chip shortages are hampering other automakers ability to do so. Improving gross margins (up to 30.5%) was also a significant factor in Tesla performance in Q3.
Netflix (NASDAQ: NFLX)
Reported: Tuesday, after trading
Revenue: $7.5 billion
Earnings per share: $3.19
The popularity of Netflix’s series Squid Game hadn’t completely filtered into the Company’s finances at the time of its Q3, 2021 earnings report. Yet, Netflix delivered a favourable report, with revenue coming in on par and subscriber growth beating expectations. Squid Game IP is estimated to be worth $900 million to Netflix and should help boost its Q4 earnings, which typically get a seasonal bump anyway.
Johnson & Johnson (NYSE: JNJ)
Reported: Tuesday, before trading
Revenue: $23.3 billion
Earnings per share: $2.60
Johnson & Johnson’s Q3 earnings-per-share beat expectations, with revenue climbing 10.7% from the previous corresponding period. J&J increased its (bottom-end) revenue guidance for the full year from $93.8 billion – $94.6 billion to $94.1 billion to $94.6 billion. J&J noted that its Covid vaccine would be responsible for $2.5 billion at years end and $502 million of its Q3 revenue.
Proctor and Gamble (NYSE: PG)
Reported: Tuesday, before trading
Revenue: $20.3 billion
Earnings per share: $1.61
PG beat revenue estimates, increasing sales revenue by 5% over the last quarter, but expects to fall short of 2020 revenue. The consumer goods Company also noted that rising producer costs, particularly as it relates to shipping and raw commodity prices, has already had and is going to continue to have a larger-than-anticipated effect on its earnings. In response, PG has begun raising the prices of some of its premium products as a quick remedy to help offset its rising costs.
Earning Seasons continues next week:
There are plenty more juicy earning reports due next week.
Facebook, after the bell Monday
Microsoft, Alphabet, Visa, Texas Instruments, and AMD, after the bell Tuesday
Thermo Fisher Scientific, Coca-Cola, McDonald’s, and Boeing, before the bell Wednesday
Ford, after the bell Wednesday
Shopify, before the bell Thursday
Apple, Amazon, and Starbucks after the bell Thursday

These 10 stocks just cleared the cloud out of 100+ stockswww.tradingview.com
This is the Watch List for all 10.
They all have cleared the cloud and closed Green. Some have the potential to dip to find support. However , some like this one MP looks ready from right here. All have Green Clouds that are moving up. Some however have some deep slopes of previous Red Clouds that they just worked there way through. I marked every stock on where I found it crossing out of the cloud. This way we can track its movements from the point of interest to better tailor what to expect once it pops the cloud.
AMZN
GOOG
NFLX
COST
BBY
SPOT
MP
OCGN
XPOA
TWTR


Netflix Post Q3 Earnings Analysis$NFLX - Netflix neared a record all-time high after market close - as the largest streaming service brought in more subscribers than analysts projected in Q3. Profit also beat forecasts, while Revenue was in line with estimates.
EPS of $3.19
Sales +16.3% to $7.48 billion - anticipates another +16% gain in revenue Q4
Profit of $1.4B
Revenue of $7.5B
Netflix added +4.4M subscribers globally to total 213M - expects to increase its subscriber base by +8.5M in Q4

Amazon could experience a new all time high in the coming monthsTwo of the most profitable investment of the past 2 decades are Amazon and Netflix, with mind blowing 229K % and 59K % gain..!
These two companies have a significant positive correlation :(last 2 trading year 500 candles):
Why this correlation could be important?
NFLX breaking above its consolidation area 2 weeks ago:
It would be highly likely AMZN follow the same price pattern because of the mentioned positive correlation!
My last AMZN analysis:
Best,
Moshkelgosha
DISCLAIMER
I’m not a certified financial planner/advisor nor a certified financial analyst nor an economist nor a CPA nor an accountant nor a lawyer. I’m not a finance professional through formal education. The contents on this site are for informational purposes only and do not constitute financial, accounting, or legal advice. I can’t promise that the information shared on my posts is appropriate for you or anyone else. By using this site, you agree to hold me harmless from any ramifications, financial or otherwise, that occur to you as a result of acting on information found on this site.

NFLX Momentums is Positive Ahead Of Earnings ReleaseNFLX results are expected today after market close with an EPS forecast at 2.56. Technically, the fast green moving average is above the orange intermediate moving average, and the intermediate orange moving average is above the slow red moving average. Moreover, there is angle and separation to indicate the presence of underlying momentum. During 2020 the lockdown accelerated subscribers, however, the pace has slowed in 2021 as economies opened. As a result, NFLX has looked elsewhere for growth and has expanded into video gaming, purchasing Night School Studio in September. Investors will be looking for signs of progress. Revenue and earnings likely grew albeit at a declining rate. Market participants will also take note of the trend regarding paid streaming subscribers. We will keep an eye on the moving average stack following the earnings release to assess if the market is still willing to keep up its NFLX momentum push.
