Netflix on the Rise Bullish Breakout in Motion!Trendline Support
The price is respecting an ascending trendline, indicating a strong bullish sentiment.
Recent candles have bounced off this support line, confirming its reliability.
Breakout Confirmation
The price has broken above a key horizontal resistance level around $870.
This breakout suggests bullish continuation, especially with volume support.
Risk-to-Reward Setup
A well-defined risk-to-reward ratio is visible.
Stop-loss appears to be placed below $853, protecting against a false breakout.
Target set around $939 aligns with a significant resistance zone, offering a potential reward.
Indicators
Positive price momentum is evident, with higher highs and higher lows forming.
Likely supported by broader market strength in tech stocks.
Next Steps
Monitor the price action for sustained movement above $870.
A retracement to retest the breakout level could provide a secondary entry.
Key resistance to watch: $900 and $939.
NFLX is poised for a bullish continuation, with the current setup offering a high-probability trade opportunity.
NFLX

Netflix - Crushed earnings, but now what?!NASDAQ:NFLX
When do we sell? Where are we going?
Netflix crushed recent earnings and have a ton of momentum behind them. I believe this is where we are going...
🎯$1033🎯1107
Not financial advice

Netflix (NFLX): Explosive growth, but caution aheadNetflix ( NASDAQ:NFLX ) is set to open 14% higher after adding a record-breaking 18.9 million subscribers in Q4—nearly double Wall Street’s expectations and well above the early 2020 peak of 15.8 million. These incredible numbers have sparked a strong market reaction, and the enthusiasm is well-justified.
Following this update, we’ve re-evaluated the chart. While we anticipate the potential for more upside, it’s unlikely that NASDAQ:NFLX will continue climbing without a significant correction at some point. The trendline since May 2022 has proven its importance, serving as resistance nine times before being flipped into support and holding firm on a key retest.
Currently, Netflix is approaching the significant psychological level of $1,000. If this level is reclaimed, a further push toward $1,070 and even $1,300 could materialize. However, we’re exercising caution as major levels and target zones have already been achieved. There is a chance—albeit slim—that today’s earnings gap could mark the top of wave ((v)) and wave 3.
For now, we’re waiting for further developments and will decide our next steps as the stock’s trajectory becomes clearer. Stay tuned for updates.

NETFLIX New Bullish Leg to $1140 has started.Netflix (NFLX) has been trading within a long-term Channel Up since the October 18 2023 Low. Every time that the price broke below and later recovered the 1D MA50 (blue trend-line), it was the most efficient buy signal of the pattern.
This is what took place yesterday, we had the first recovery above the 1D MA50 since the break below it on Jan 10. Along with the inevitable Bullish Cross below the 0.0 level on the 1D MACD (which again has been the best buy signal all these years), we expect the new technical Bullish Leg of the Channel Up to start.
So far we've had 5 core Bullish Legs and as you can see the tend to rise by roughly the same amount two at a time. The first two have been roughly +40%, then the next two +25% and the one before +38.71%. It is fair to assume that the one that has just started will be of around +38.71% too. As a result, we can place our Target a little lower for less risk and aim at $1100.
-------------------------------------------------------------------------------
** Please LIKE 👍, FOLLOW ✅, SHARE 🙌 and COMMENT ✍ if you enjoy this idea! Also share your ideas and charts in the comments section below! This is best way to keep it relevant, support us, keep the content here free and allow the idea to reach as many people as possible. **
-------------------------------------------------------------------------------
💸💸💸💸💸💸
👇 👇 👇 👇 👇 👇

Netflix Stock Up 14% Premarket Following Record-Breaking QuarterNetflix Inc. ( NASDAQ:NFLX ) is making headlines with a significant 14% surge in premarket trading, fueled by the company’s record-breaking fourth-quarter performance. This milestone, driven by live sports programming and the return of its flagship series, *Squid Game*, marks a pivotal moment for the streaming giant. Here’s an in-depth look at the technical and fundamental aspects behind this remarkable rally.
Record Subscriber Growth
Netflix added an unprecedented 18.9 million subscribers in Q4 2024, bringing its global subscriber base to over 300 million. This growth, more than double Wall Street’s expectations, surpasses the company’s previous record of 15 million new subscribers in Q1 2020. Notably, this quarter marked the final time Netflix will report subscriber numbers, signaling a shift toward emphasizing financial metrics such as revenue and profit.
Revenue and Profit Surge
Netflix reported a 16% year-over-year increase in revenue, reaching $10.2 billion for the quarter—its most substantial growth since 2021. For 2025, the company projects revenue of up to $44.5 billion, a 14% increase, with an operating margin of 29%. These robust financials underscore the company’s ability to sustain growth amidst a competitive streaming landscape.
Key Drivers of Growth
1. Live Programming: Netflix’s venture into live sports, including its first major National Football League games and the Jake Paul vs. Mike Tyson boxing match, has proven to be a game-changer. These events attracted record sign-ups, highlighting the potential of live programming to drive subscriber growth.
2. Content Strategy: The return of Squid Game and the success of the hit movie Carry-On further bolstered subscriber numbers. Netflix’s diverse programming mix ensures broad audience appeal, while no single title dominated subscriber additions.
3. Password Sharing Crackdown: The company’s crackdown on password sharing contributed to its best-ever year for subscriber growth, with 41 million new customers added in 2024.
4. Advertising Revenue: While still in its early stages, Netflix’s advertising business is gaining traction. A majority of new subscribers in markets with ad-supported tiers opted for this model, signaling growing acceptance of ad-supported streaming.
Price Increases
Netflix is boosting prices across several markets, including the U.S., Canada, Portugal, and Argentina. The most popular U.S. plan now costs $17.99 per month, a $2.50 increase. These price hikes are expected to contribute significantly to revenue growth in 2025.
Market Reaction
Netflix shares closed at $869.68 in New York on Tuesday and are set to open with a 14% gain in premarket trading. If sustained, this would mark the stock’s most significant gain since October 2023.
Technical Analysis
As of premarket trading, NASDAQ:NFLX is up 14.70%, reflecting bullish sentiment driven by the record-breaking quarterly performance. The Relative Strength Index (RSI) was at 48.99 before this surge, indicating the stock was neither overbought nor oversold.
Bullish Gap-Up Pattern
The premarket rally sets the stage for a potential gap-up pattern at market open. This technical phenomenon occurs when a stock’s opening price is significantly higher than its previous closing price. Historically, gap-ups are strong bullish indicators, often followed by brief pullbacks as traders digest the news.
Resistance and Support Levels
- Resistance: The stock is eyeing its one-month high as the next resistance level. A breakout above this point could trigger further bullish momentum.
- Support: Immediate support lies at the $776 level. A breakdown below this level could lead to a retest of lower support zones, but this scenario appears less likely given the current bullish momentum.
Market Outlook
With the broader stock market expected to rally following Donald Trump’s inauguration earlier this week, NASDAQ:NFLX is poised to capitalize on favorable market conditions. The combination of strong fundamentals and bullish technical indicators suggests a continued upward trajectory in the near term.
Conclusion
Netflix’s record-breaking quarter underscores its resilience and adaptability in an evolving streaming landscape. The company’s strategic focus on live programming, diverse content offerings, and advertising is paying off, driving subscriber growth and revenue to new heights. From a technical perspective, the stock’s premarket surge and bullish patterns point to a strong start for 2025.
As Netflix pivots toward prioritizing financial metrics over subscriber numbers, investors have much to look forward to in terms of sustained growth and profitability. With NASDAQ:NFLX setting the stage for a historic year, the streaming giant remains a compelling investment opportunity for traders and long-term investors alike.

NFLX reference areaHello dear investors
First we are yet into our uptrend corridor but you should keep eyes on my reference area :
As you see on my modest chart the yellow area is the the battle zone between buyers and sellers:
- if price is above it, you are safe as a buyer
- if price becomes under the zone we can say that sellers had won the battle and they will push the market down and down
good luck

NETFLIX: testing the 1D MA50. Buy?Netflix is marginally bearish on its 1D technical outlook (RSI = 43.757, MACD = 4.950, ADX = 42.375) as the December correction is testing now the 1D MA50. Technically this has been the trend's support since mid August 2024. The 2 year Channel Up offers useful conclusions here. Each of its past January months (2023 and 2024) saw a surge of +38% from their closest low. If this is repeated again, then the price will test the Channel's top. Aim for that +38% rise (TP = 1,200).
## If you like our free content follow our profile to get more daily ideas. ##
## Comments and likes are greatly appreciated. ##

NFLX Elliot Wave, Wyckoff Method with Head & Shoulders PatternIt is not always easy to time a short, but looking at this chart I will share a couple of confluences that are interesting from a technical analysis point of view.
First, there is a 5 wave completion of the Elliot Wave pattern.
Then, based on the Wyckoff method of accumulation to distribution, we can gauge areas of UTAD and LPSY takes place.
Lastly, we can form a Head & Shoulders pattern (a small one) and a neckline.
One can carefully enter the short after the break and retest of the trendline, which is the safest way.

NFLX heading down in the New YearShort term bearish on NFLX. Target for Fri 1/3/2025 875.
Entry at or below 895. Stop Loss 896
*will keep my eye on it for Jan as I think an ultimate target may be close to 800. Methodical move down in descending channel.

Netflix Analysis: Key Levels and Trading Outlook 2024.12.29Hello, this is Greedy All-Day.
Today’s analysis focuses on Netflix (NFLX).
Weekly Chart Analysis
Looking at the weekly chart, Netflix is currently consolidating within the 884–944 range, which represents about a 5% range of sideways movement. This consolidation has lasted for approximately one month.
Since the sharp decline in 2022, Netflix has been following a newly established ascending trendline, which remains intact and shows no signs of breaking.
Key observations:
Netflix has climbed approximately 35% beyond its all-time high in 2021, reaching new highs.
However, the price is now in a consolidation phase, which raises the question: is Netflix preparing for further upside, or is this a period of rest before a potential pullback?
If this sideways movement continues for an extended period, a trendline breakdown may occur. Based on current prices, this breakdown is projected around July 2025.
Weekly Chart with Indicators
When we include indicators such as the 60 EMA, we notice that it aligns closely with the ascending trendline. This alignment increases the reliability of the trendline as a key support level.
However, at this point, entering a new long position appears less attractive due to the following reasons:
Netflix has already risen 35% beyond its previous high of $700, making it difficult to justify additional upside based solely on past data.
Without historical data to support further gains, investors would likely rely on fundamental analysis and the belief that Netflix is undervalued as a company.
Ideal Buy Zones
Where are the best entry points for a buy position?
While Netflix’s current uptrend may suggest continuous growth, corrections are inevitable, even for large companies. Based on this, I’ve identified two potential buy zones marked as blue boxes on the chart:
First Buy Zone: $700
This level was the all-time high in 2021, which now acts as support after being broken to the upside.
Even if the price drops, it’s unlikely to fall below $700 easily, as this level is supported by the ascending trendline from 2022.
Second Buy Zone: $350
The first green box shows a sharp drop followed by a temporary rebound.
The second green box highlights a key support level that held during a previous consolidation phase. Both zones indicate strong support and potential for a bounce.
Reversal and Sell Perspective
The red box zone highlights an area for potential reversal or sell positions.
If Netflix breaks the $700 level and the ascending trendline, it would signal a significant shift toward a bearish trend.
A breakdown below $700 could lead to a sharp decline, with the first buy zone ($700) and second buy zone ($350) representing a potential 50% difference.
This suggests that a trendline breakdown could trigger a substantial bearish reversal, making short positions or hedge strategies worth considering.
Conclusion
While Netflix has demonstrated strong upward momentum, history shows that even the largest companies can experience corrections of 70% or more.
Instead of chasing continuous rallies, it’s crucial to consider both bullish and bearish scenarios and plan trades accordingly.
Let’s make 2025 a successful trading year together. 🚀

AMD Best Level to BUY/HOLD 300% gains SWING TRADE🔸Hello traders, today let's review recent price chart for AMD.
Well defined swings in progress, expecting further downside before
the tide finally turns for AMD bulls. Currently it's recommended to stay out.
🔸AMD is trailing behind NVDA massively, so eventually AMD will to the
mean reversion trade and start to catch up with NVDA, however currently
pullback/correction mode in progress.
🔸Well defined swings - 160 to 58 65% correction, then 58 to 210 280% gains,
210 to 75 represents 65% correction, 75 to 290 is a 280% pump.
🔸Recommended strategy bulls: Bulls wait for correction to complete at/near 75 usd in January 2025 and get ready to BUY/HOLD low, this is a swing trade setup, so will take longer to hit target, patience required. final TP is 290 USD, 280% upside off the expected lows. good luck traders!
🎁Please hit the like button and
🎁Leave a comment to support our team!
RISK DISCLAIMER:
Trading Futures , Forex, CFDs and Stocks involves a risk of loss.
Please consider carefully if such trading is appropriate for you.
Past performance is not indicative of future results.
Always limit your leverage and use tight stop loss.

BUY NETFLIXJust an idea and trade at your own risk.
Netflix looking bullish on its weekly timeframe and still in uptrend channel.
After testing the lower of the uptrend channel at area 150, uptrend is resuming and possibly to the upper channel of the uptrend.

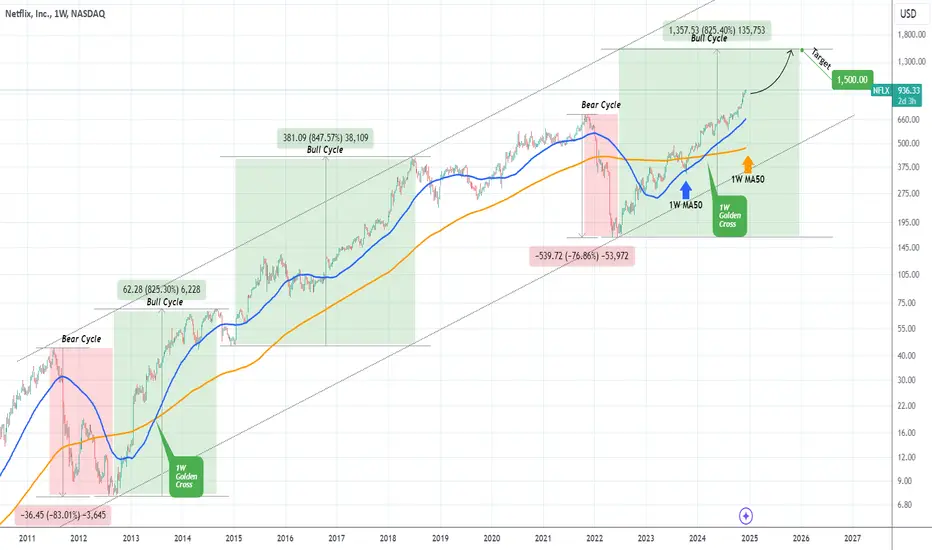
NETFLIX historic pattern targets $1500 in 2025.Last time we looked at Netflix (NFLX) was on its earnings release (October 21, see chart below), when we gave a strong bullish signal that easily hit our $840.00 Target:
Since 3 week ago, the price even broke above the dominant 1-year Channel Up and is now in search of a new pattern. This pattern can be found if we zoom out considerably on the 1W time-frame, where the underlying pattern since the U.S. Housing Crisis is a 25-year Channel Up.
The symmetry within this pattern is high and in fact since the June 2022 market bottom (which was a Higher Low on the Channel Up), the stock has been on a Bull Cycle. The Bear Cycle that preceded it had a massive decline of -77%. The last correction of this magnitude was the July 2011 - August 2012 Bear Cycle, which declined by -83%.
The two Bull Cycles that followed Netflix's golden years were identical (+825% and +847%). As a result, we assume that the current Bull Cycle will also rise by at least +825% from its bottom, which gives us a $1500 Target towards the end of 2025.
Notice also how both the 2012 - 2014 and 2022 - 2024 Bull Cycles had a 1W Golden Cross.
-------------------------------------------------------------------------------
** Please LIKE 👍, FOLLOW ✅, SHARE 🙌 and COMMENT ✍ if you enjoy this idea! Also share your ideas and charts in the comments section below! This is best way to keep it relevant, support us, keep the content here free and allow the idea to reach as many people as possible. **
-------------------------------------------------------------------------------
💸💸💸💸💸💸
👇 👇 👇 👇 👇 👇
Netflix - Please Buy This All Time High!Netflix ( NASDAQ:NFLX ) will retest the resistance trendline:
Click chart above to see the detailed analysis👆🏻
Netflix is currently perfectly breaking above the previous all time high and with a +16% candle of November, bulls are totally in control of this stock. If we look at previous cycles, there is a 100% chance that Netflix will now retest the upper resistance trendline of the reverse triangle.
Levels to watch: $1.200
Keep your long term vision,
Philip (BasicTrading)

$NFLX Farewell , I bid the adeiu It was a nice ride I'm sure. But it's time to go back down now. RSI hitting resistance on the monthly. Daily exhausted with 7 green days in a row , with a doji to top it off. I would love a gap up and touch of the highs, then flush!! 3 days of red incoming. Monthlies can pay well 💬

AAPL: 2025 Strategic Outlook: 75%+ BUY/HOLD🔸Time to update the AAPL outlook, this is 2D price chart, we are
currently entering overpriced zone and limited upside in AAPL
going forward.
🔸AAPL price action is contained within rising bullish price channel
established since 2021. Havin said that we've entered premium / overprice
zone and I'm expecting limited upside going forward over the next few
month. Risk/reward is favoring a pullback/correction before a healthy
uptrend can resume in 2025.
🔸Recommended strategy bulls: expecting pullback/correction to start
in Q1 2025, 20/25% pullback is normal and therefore we may hit
170/180 USD in the correction stage of the bull market in AAPL. Bulls
should wait for better prices / reload zone near 170/180. TP BULLS
is 260/280 USD. this is obviously a setup for patient traders, do not
expect overnight gains in this market. good luck!
🎁Please hit the like button and
🎁Leave a comment to support our team!
RISK DISCLAIMER:
Trading Futures , Forex, CFDs and Stocks involves a risk of loss.
Please consider carefully if such trading is appropriate for you.
Past performance is not indicative of future results.
Always limit your leverage and use tight stop loss.

Netflix (NFLX) Stock Hits Another All-Time HighNetflix (NFLX) Stock Hits Another All-Time High
The daily chart for Netflix (NFLX) shows that its price has risen by more than 10% since the start of November, setting a series of new all-time highs. Today, Netflix's stock price is trading above $830.
The bullish momentum is attributed to several factors, including stronger-than-expected Q3 earnings:
→ Earnings per share (EPS): Actual = $5.40, Expectations = $5.11;
→ Revenue: Actual = $9.82 billion, Expectations = $9.11 billion;
→ Monthly active users: Reached 70 million.
Additionally, as reported by Benzinga, investor optimism has been bolstered by expectations that Donald Trump’s pro-business tax-cut policies could increase consumer spending, particularly in discretionary sectors like streaming video.
Technical Analysis of NFLX Stock
The daily chart indicates that Netflix's price has been trading within an upward channel (blue) throughout 2024. However, strong bullish sentiment has pushed the price beyond the channel's upper boundary. This allows analysts to:
→ Construct a parallel channel of the same width above the initial one;
→ Build a steeper channel (black lines).
The price is now in a resistance zone (marked with a red circle), formed by:
→ The upper boundary of the new channel;
→ The upper black trendline.
These observations suggest the possibility of a correction after the explosive rally. The RSI indicator, which has reached its highest levels since January, supports this view. If a correction occurs, the price could test the psychological level of $800.
Analyst Predictions
Analysts continue to raise their price targets for NFLX. According to TipRanks:
→ Out of 36 ratings, 24 analysts recommend buying NFLX shares, while 2 suggest selling;
→ The average 12-month price target for NFLX is now $925, compared to $720 during the previous analysis on 10 October.
This article represents the opinion of the Companies operating under the FXOpen brand only. It is not to be construed as an offer, solicitation, or recommendation with respect to products and services provided by the Companies operating under the FXOpen brand, nor is it to be considered financial advice.

Netflix - This Is A 100% Probability Setup!Netflix ( NASDAQ:NFLX ) will continue its parabolic rally:
Click chart above to see the detailed analysis👆🏻
With this monthly candle, Netflix finally broke above the previous all time high and it about to continue the reversal triangle pattern cycle. We saw the same breakout back in 2013, when Netflix broke above the all time high and then started an even stronger rally of about +50%.
Levels to watch: $750, $1.000
Keep your long term vision,
Philip (BasicTrading)

#NFLX Targets for the Meltup in equitiesI have called a couple real big pattern moves on #Netflix
so on todays mega rally
I take a quick look at the potential price projections that may or may not end up occurring
I am not a guru or price forcaster
i just draw lines on charts like always
Your Risk
Your Reward
But i am someone who does highlight Risk i.e. downward prices when I feel/see that might be a possibility
Yes I know
this game is not easy.

Project Monday Strategy v2.0 gives a long signal on NetflixThis trading idea crated with Project Monday Strategy v2.0 (coming soon).
Entry Price: 757.58 USD
Preliminary Stop-Loss: 713.34 USDT
Preliminary Take-Profit: 870.79 USDT
The potential profit is 15%.
This strategy preset generates orders with following results during 6 years:
Net Profit in %: 5190%;
Percent Profitable: 49%;
Profit Factor: 3,16;
Max Drawdown: 18%.

NETFLIX’s Next Big Move: Massive Breakout Imminent?Technical Analysis:
NFLX (Netflix), on the 15-minute time frame, has set up a long trade with a strong entry at $744.60, supported by good volume. The breakout occurred above a consolidation phase, indicating market interest in a bullish move.
The price action is holding above the entry level, and the Risological Dotted Trendline is trending upward, providing a strong support foundation for the trade. This long setup points to a potential bullish continuation as Netflix approaches the following targets.
Key Levels:
Entry: $744.60
Stop Loss (SL): $715.10
Target 1 (TP1): $781.07
Target 2 (TP2): $840.08
Target 3 (TP3): $899.09
Target 4 (TP4): $935.56
Observations:
The breakout was backed by strong volume, reflecting confidence from the bulls.
Price is consolidating near TP1, suggesting momentum is building for further upside.
The Risological Dotted Trendline is trending upwards, giving strong support around $744, ensuring the trend stays intact.
Outlook:
Netflix's long trade setup shows strong potential for upward movement. With the support of the Risological Dotted Trendline and high volume backing, this trade is well-positioned to meet its targets. Watch for any pullback near $740, which could present another opportunity to re-enter or add to positions.

NFLX Netflix Options Ahead of EarningsIf you haven`t sold NFLX before that massive selloff:
Now analyzing the options chain and the chart patterns of NFLX Netflix prior to the earnings report this week,
I would consider purchasing the 730usd strike price Calls with
an expiration date of 2025-1-17,
for a premium of approximately $45.25.
If these options prove to be profitable prior to the earnings release, I would sell at least half of them.

Netflix (NFLX) Shares Hit Record High in Aggressive MoveNetflix (NFLX) Shares Hit Record High in Aggressive Move
Netflix (NFLX) shares reached a record high in a dynamic move. As shown in Netflix's stock chart, the price hit an all-time peak, with Friday’s candle closing above $760. This follows an aggressive rebound, given that on Thursday, the price had fallen below the psychological level of $700.
This sharp move created a significant bullish gap, with the difference between Thursday’s and Friday’s closing prices exceeding 11%. The catalyst for this surge in volatility was the release of Netflix's strong third-quarter results:
→ Earnings per share: Actual = $5.40, Expected = $5.11;
→ Gross revenue: Actual = $9.82 billion, Expected = $9.77 billion. Netflix also forecast a 15% growth in Q4 2024;
→ Free cash flow increased from $1.213 billion in Q2 to $2.194 billion in Q3.
A technical analysis of Netflix's stock shows a steady upward channel throughout 2024 (depicted in blue). Thursday's drop (marked with an arrow) appears to have been a bear trap, as the chart demonstrates the potential risk of short positions, which were anticipating a drop below the $700 mark into the lower half of the upward channel.
It is notable that NFLX has now reached the upper boundary of this channel. This may prompt investors to lock in profits, potentially slowing the bullish momentum seen late last week.
If a correction occurs, potential support could be found at:
→ Psychological levels of $725 and $750;
→ The mid-line dividing the upper half of the channel into two quarters (indicated by dotted lines).
This article represents the opinion of the Companies operating under the FXOpen brand only. It is not to be construed as an offer, solicitation, or recommendation with respect to products and services provided by the Companies operating under the FXOpen brand, nor is it to be considered financial advice.
