Netflix Compression. (NFLX)🤔 Two patterns taking place as we hit major level of Resistance.
Bull Pennant or Inverse Head And Shoulders.
Price is being compresses in the green pennant formation.
Safest bet is to play the pennant breakouts to the up or the down / avoid the noise for now.
Once the break happens, next you will look to play those positions towards the green horizontal support and Resistance levels to test for trend continuation.
Cheers! 🍺
🥇MLT | MAJOR LEAGUE TRADER
Nflxlong


NFLX long for the weekBlack lines - represent last week high and low
Blue lines - respresent previous day high and low
purple line- represents supports and resistance
yellow lines- represents last month high and low
Red indicator represents anchor vwap from previous lows and high. this also works as potential support to watch


NFLX: Potential New All Time Highs 1D (May 06)X Force Global Analysis:
In this analysis, we explore the technicals of Netflix (NFLX), the world's leading internet entertainment service, and arguably one of the biggest beneficiaries of the Corona Virus (Covid-19).
Analysis
- First of all, unlike most other blue chip stocks, we see a steady uptrend
- Counting Elliott Waves, we can count an Impulse Wave (12345) up, before a strong Corrective Wave count (ABC)
- This correction was not only a technical correction, but also one caused by the massive fear in the market due to the Corona Virus (Covid-19)
- After this correction, we can count Elliott Double Combo Waves (WXY)
- Wave W consists of a smaller double combo wave, and we are currently seeing wave X play out
- Within wave X, we can expect a corrective ABC wave, leading down to the trend line support marked by the dotted red line
- To support this, we see a death cross that has formed on the Moving Average Convergence Divergence (MACD), forming bearish histograms
- The Relative Strength Index (RSI) continues to create lower highs as well
- However, as the trend strength and momentum remain solid, we can expect a further impulsive move after a potential correction, leading us to new all time high levels
What We Believe
Netflix has been strong despite the fear in the market. The bullish momentum and trend strength remains, as Netflix strives to create record highs.
Trade Safe.

#NFLX ANALYSIS.. BULLISH SIGNS.. I think there are positive signals in #NFLX.. In the medium term, we can see an upward trend in the stock..
#NFLX is priced above ma 50 on the 4-hour chart, which is pretty positive.. Also, the reference value of rsi 45 seems very important for price movements.. I think after a short retreat, the price will go up in the medium term and will test the critical pivot point in 520 usd level.. We will wait and see..
Disclaimer: Please do your own due diligence when it comes to trading.. Never put in money that you cannot afford to lose.. Invest at your own risk..
I wish you all the best..

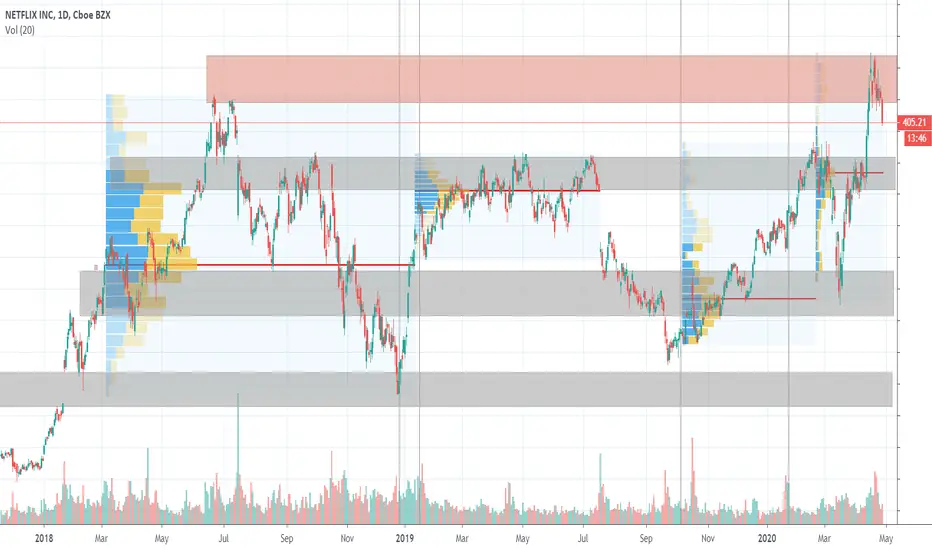
NFLX - Netflix S/R zonesHello traders,
Description of the analysis:
Gray support levels suitable for investment.
About me:
Hi, my name is Jacob Kovarik and I´m trading on stock exchange since 2008. I started with a capital of 3000 USD. My first strategy was based on OTM options. (American stock index and their ETF ). I´ve learnt on my path that professional trading is based on two main fundaments which have to complement each other, to make a bussiness attitude profitable. I´ve tried a lot of techniques and many manners how to analyze the market. From basic technical analysis to fundamental analysis of single title. My analytics gradually changed into professional attitude. I work with logical advantages of stock exchange (return of value back to average, volume , expected volatility , advantage of high stop-loss, the breakdown of time in options, statistics and cosistent thorough control of risk). At the moment, my main target is ITM on SPM index. Biggest part of my current bussiness activity comes from e mini futures (NQ, ES). I´m trader of positions. I´m from Czech republic and I take care of a private fund (4 000 000 USD). During my career I´ve earned a lot of valuable experience, such as functionality of strategies and what is more important, control of emotions. Professional trading is, in my opinion, certain kind of mental training and if we are able to control our emotions, accomplishment will show up. I will share with you my analysis and trades on my profile. I wish to all of you successul trades.
Jacob

#NFLX My Expectation This will be great opportunity for #NFLX going up if the price break the 433.5 Level

NFLX long trend analysisStarted by identifying a month long channel that started forming mid March.
Support seems consistent with 2 contact points.
Identified levels:
L365, L412, L444.44 :)
Expecting rejection from L412 and trend support on 27 April, followed by a rise to L444.44 by 1st of May.
Planning to enter after confirmaion of bounce (28 May)
SL of 1700p (2% risk @ 8000 balance = 0.09 LOT size)
TP of 5106p
Risk/Reward ratio of 3
PROs:
L412 and trendline
No MACD Divergence
CONs:
Possible triple top with neckline @ L412. Will watch for breach.
Fundamentals:
Lockdown measures still in place


4.16.2020 Netflix showing significant Bearish divergence + ATHIncreasing competition
Overbought
Bulls running out of steam
April 21st Q1 earnings possibly already priced in
60mm USA subscribers / 130mm USA families = 46% of USA Families which means increasing difficulty in obtaining new subscribers.
Little new content due to COVID19 shutdown.
Short
-NFA

NFLXIf if holds 370 area, my key price interest is clearing 383. If above, will take a small bullish trade up to 390 area for 7-10 points.
If it rejects 383, I think it is possible we head back down to 363 area demand to pick up some more buyers.
So above 383 = bullish
Below 383 will look for retrace down to 363

NFLX Asceding Triangle + Cypher Pattern (Possible Breakout?)MONTHLY CHART
As we can see in the monthly chart the price of Netflix forming an ascending triangle and before the ascending triangle there was a strong uptrend so i estimate that in some point in the future will be a breakout to the upside.
The ascending triangle is formed with the trend line that formed from 2018 and act as a support and the resistance line around 390$.
WEEKLY CHART
As we can see in the weekly chart we can see that there is a possibility of the creation of a cypher pattern that is an indication of a bullish movement in the future. To be valid the price has to reach around the resistance line and then fall at around 290$ and bounce back at the support trend line in the ascending triangle. Then i can think that the price it will bounce some fib levels of the CD retracements move sideways and lead to the breakout of the triangle.
DAILY CHART / BUTTERFLY PATTERNS
We can see the form of a bullish butterfly with the green that is completed and then the form of a bearish butterfly pattern that is yet to complete. Ultimately as the price fall and then retrace around in the D point close to support line. That is also a sign that validates the bullish cypher pattern because, the D point of the bearish butterfly is the C point of the cypher pattern. So as the price move to D point of the bearish butterfly it has to fall and it will fall and hopefully reach the trend line that acts as support line in the triangle.
DAILY CHART / HARMONIC PATTERNS
We see how this three patterns connection and how the three of them validate the prediction of the price move
With the orange line is a prediction of where the price will go in the future, just my opinion.

NFLX & Chill Entries!! In the money!Before entering a trade three types of analysis should be performed.
Fundamental Analysis = The study of financial statements and economic news. (Overall Trend)
Technical Analysis = The study of chart history. (Entry & Exit Strategies)
Sentimental Analysis = The study of the markets current psychology and traders psychology.(Instinct)
After performing the three analysis below are my results:
NASDAQ:NFLX
Fundamental Analysis = LONG-TERM (BUYING)
Technical Analysis = SHORT-TERM (SELLING)
Sentimental Analysis = Market fears currently higher than confidence.
To better explain:
This means that right now momentum is headed downwards technically but the overall trend is up fundamentally.
So since we know the overall trend is upwards but we are currently headed downwards it creates the perfect timing to use our Fibonacci Retracement tool. A tool that is used to find important entry and exit levels in a trending market. Which is traditionally applied to the low & high of a trend. Here were my results:
Classic Head & Shoulders pattern shown with the three pink circles on chart.
Head & Shoulders on a uptrend = Bearish Reversal at Neckline of $256.65.
As you can see in the chart above we have already retraced with a spike below the 23.6% level at $340.31. Markets are still showing downwards momentum that is headed towards the 38.2% level - 50% level.
MY SUGGESTION:
Place LONG orders totaling anywhere from 1-5% of your total trading capital on each retracement level below:
23.6% = $361.01 (BUY)
38.2% = $340.31 (BUY)
50.0% = $323.58 (Great trade opportunity) (BUY)
61.8% = $306.85 (What i consider the PERFECT IDEAL TRADE) (BUY)
78.6% = $283.02 (ABSOLUTE BARGAIN!!) (BUY)
Take profit: $393.52 at the previous ATH . (All Time High) Be patient and trust the process. This monster of a tech stock will most definitely return to break more records in the upcoming months when the continuation wave arrives and aligns with the fundamentals.
If you enjoy these quick signals/tips make sure to FOLLOW ME & show support by leaving a LIKE!!

NFLX Why am I in no rush to buy Netflix.Many analysts say that now is the best time to invest in some stocks. For example, Netflix. But according to Elliott’s theory, I will invest in stocks when the price is around $ 250 per share. I believe that the price will reach this level by the end of summer


Famous Alex Vieira Netflix on Tesla is Game Changer!!Famous Alex Vieira Netflix on My Tesla is Game Changer! Jim Cramer to Cover and Go Long at Irrational Prices!

NFLX - I've officially lost it - Why I'm short $NFLXA word of advice because I think this idea is straight up crazy. I'm not sure I'd trade this myself, but if I was bullish on netflix - like 90% of the market appears to be, I'd maybe reduce the size of my position.
So...$NFLX has practically every reason under the sun to go up today:
NASDAQ premarket is way up as is the rest of the market futures.
Netflix crushed their subscriber targets increasing global streaming subscribers by 20% YoY
Earnings per share crushed analyst estimates of $.53 taking in $1.30/share
Quarter sales topped estimates of $5.45B taking in $5.47B
Heck, even average revenue per subscriber was up an extra 9%
With all those glittery stats hitting the news wire yesterday, who in their right mind would consider shorting Netflix?!
The daddie of hacks...that's who...and even I think I might be crazy. Post market, the stock is sitting at $344 and we're working our way through the morning premarket session. Whether that price level holds is doubtful. (Edit: it's already pulled back to $341-2)
So you might ask me, 'Hacky, what's got your knickers in a bunch? NFLX is printing money!' To which I would respond, 'That's what they want you to think.'
Here's what has me thinking something about NFLX doesn't smell right:
NFLX has been dropping at the open of almost every trading session for the last week during the heaviest volume periods. Why? My guess is institutional investors are liquidating some of their positions. Let's face it, earnings surprises really aren't all that surprising with the price action leading up to them. What is surprising is the higher than usual volume that has been acting like an anchor on NFLX's stock price. With so much bullish sentiment and high expectations from earnings - why has the stock gone sideways or even down the last few days???? With this stellar outlook confirmed, John Q. Public isn't going to sell netflix, if anything, you'd expect a stampede of buyers to flood the market - and that's just the stampede the institutions are waiting for to make some big shifts in their positions.
February is looking rather dismal for the market at large, and let's face it - we're overdue for at least a small correction. At the top of that list is the NASDAQ - gaining 38% last year and NFLX practically in sync. The institutions have been selling off Netflix at the start of each session, and it's weighed on the price - which slowly recovered through the late morning and afternoon session each day. Every 'major' time period (9:30-10, 3:30-4) for the last few days has seen big selling pressure or traded sideways. Why during those time periods? Because that's when the institutions can mask their activities.
What I think will happen:
1) NFLX will gap up - how big of a gap is uncertain. Likely between $342-347 would be my best guess.
2) Here comes the head fake and get ready for the whip saw. I think it's highly likely we hit $355-360 at the outset (in the first 5 minutes of trading possibly)...BUT, it'll be short lived. The institutions will then step in and wreck house. We'll see a retracement back down and fill the gap before the stock makes a slight rally in the afternoon session after bouncing off support in the $338 area. Expect the stock to settle back close to where it opens today.
How I'll play it:
1) I'll watch the first minute of the trading day from the sidelines and watch relative volume. If the volume is lower than usual but price is rising, the market is being driven by the fish. I'll likely get a couple calls if the stock shows good momentum and sell them in the $358 range, just prior to completing the gap fill at $360.
2) The volume will be a key indicator - if it's down, and it's obvious the institutions are on the sidelines - what are they waiting for? They're waiting on the price to rise so they can get a premium when the sell off their positions. The second the price gaps get thick to the downside and sell volume ramps up, any long positions are immediately reversed to shorts....expect to ride the stock back down to the $338 level. If that level falls, the uptrend channel going back to september is the next big support in the $320 range. From there what happens likely depends on the market at large. If we see the pullback in february that I think we will, it'd be time to cash in the NASDAQ positions.

NFLX reversed from resistance, potential drop!
NFLX reversed off its resistance at 343.29 where it could potentially drop further to 285.58.
Trading CFDs on margin carries high risk.
Losses can exceed the initial investment so please ensure you fully
understand the risks.

NFLX reversed from resistance, potential drop!
NFLX reversed off its resistance at 339.58 where it could potentially drop further to 285.58.
Trading CFDs on margin carries high risk.
Losses can exceed the initial investment so please ensure you fully
understand the risks.

NFLX reversed from resistance, potential drop!
NFLX reversed off its resistance at 343.29 where it could potentially drop further to 285.58.
Trading CFDs on margin carries high risk.
Losses can exceed the initial investment so please ensure you fully
understand the risks.
