Nflxlong

NFLX: Squeeze time imminentJuicy bull pennant about to get ripped.
Possible 1-2 days remaining inside trendlines.
As long as QQQ doesn't shit the bed:
BUY FEB22 360c if/when price arrives 361.50.
or
BUY FEB22 355c if/when price arrives 353.50 first.


Netflix Stock Analysis:Bulls Cannot be Stopped...Netflix’s stock analysis for today is examined using a 6 hour timeframe. Attention is paid in particular ~6 months of market action from a high of $419.75 July 18, 2018 to current date.
Retracement in the bullish trend from $419.75 up to ~$232.19 saw the price of Netflix break below not only its long term bullish trendline, but also below the bearish channel as indicated on the chart...both of which indicate further downside potential.
Price between $249.18 and $227.87 where a rising window does exist however did provide a floor for the price of Netflix which was followed by the current bullish swing.
Termination of bearish momentum and also recovery of price above its major trendline and also breaking above the upper boundary of the bearish channel currently both imply higher prices with the minimum price expectation for Netflix being the high made on July 18, 2018 of ~$419.75.
A pull back in price to either the upper boundary of the Bearish channel or a retest of the bullish trendline is plausible after which prices should continue higher.

OMFG - Shorting NFLX Ruins Weekends for BearsOk, so GS ramps its NFLX price target and I think shorting NFLX pre-market (while on the toilet) because its up 3% is a good idea. Add to the short at $291, even better. This SOB is moving up and if it blows the next Fib resistance at $302.50, probably not a ton of resistance until the next 10% at $335-$340ish. Frankly, I wouldn't be surprised if we got there in the run up to earnings.
So I'm bagholding NFLX on the short side so that every single waking minute of my weekend can be spent contemplating what a moron I am. Should be fun. Longer term, I believe in the trade. This is a heavily indebted media company with an eye popping multiple that AAPL isn't buying because AAPL is a prude when it comes to content. Nevertheless, I have to see this ill-timed trade every time I log into my account eating up my YTD gains for the foreseeable.
Thankfully, for those who saw my morning chart, I pointed out the danger here and hopefully prevented a few bears from getting trapped in this pain trade from hell.
Lesson: Even big cap stocks that pop 5% premarket on BS research can close 10% higher.

Follow Up - WTF is up with NFLX - GS Upgrade RampSo NFLX was ripping yesterday, somehow immune to price drops despite my shorting of a massive 1k shares:). Why? Goldman upgrades them this morning with a $400 price target because why the hell not upgrade a company when the PE falls below 100!
Today's morning gap lines up with recent resistance around $281 and while sitting on the toilet I took a semi-fun size 500 share short to play at least a partial gap fill but mainly because I hate myself and want to put on a bad trade with this POS to ruin my weekend.
As I said before, NFLX warrants caution here because people think its immune to the trade war so it could run up into earnings. Nevertheless, this is a dog and it will eventually go full bitcoin because its just a media company trading with a multiple 5X Disney which is a real diversified entertainment company with better assets.
Careful trading today. Powell up at 10:15.

WTF is up with NFLX todayAnyone trying to short NFLX today is bitter as hell based on the fact this ticking time bomb of a bubble refused to give up gains today. Someone is clearly buying shares and there are a ton of shorts that can be squeezed. Nevertheless, the 61% Fib from 2018 kept it from breaking out. I'd be cautious here on the short side because if the market face rips higher, this overpriced dog will easily rip 1.5 or 2X the Nasdaq. My advice, let this bad boy run up and short it to death ahead of earnings.

NFLX Approaching Support, Potential Bounce! NFLX is approaching our first support at 205.72 (horizontal pullback support, 50% fibonacci retracement, 100% fibonacci extension) where a strong bounce might occur above this level pushing price up to our major resistance at 255.34 (horizontal pullback resistance, 23.6% fibonacci retracement, 100% fibonacci extension).
Stochastic (34,5,3) is also approaching support and we might see a corresponding bounce in price.

NFLX - Netflix stretchedBesides many indications I have not drawn in, I see that price is stretched like CL (see link).
Here at the WL (Warning Line) the air is very thin to dive deeper. I think the crew first needs a breather and grab some air.
Therefore I see a high potential for a turn. Even a spurt up to the L-MLH would not surprise me.
P!


Beat NFLX easily.it's mainly for swing trading, i use the 3 day / 15 day / monthly charts with it and it works perfectly,
it works good for stocks and cryptocurrency.
you will use heiken ashi chart style and turn on the EMA DOTS indicator.
once the indicator is on you will hide the heiken ashi so you only see the dots.
when a green dot appears you buy, if a green dot appears after that green dot you hold your investment.
if a red dot appears you sell your position. easy as that.
shorter time frames will be choppy.
larger time frames will be smooth.

$NFLX INC DOUBLE TOP, BEARISH TRENDI think that we need to look after what will happen in general towards the world economy at the moment before to look specifically towards certain company or you know, the whole sub industry.
I got some issues that it might be happening for crisis in 2019. It's quite terrifying but I can't wait to see what happen towards cryptosphere!
At the moment the chart of Netflix is kinda bearish, which is already seen it touched $276. Dead cat bounce and right now at the moment sitting above $300, $309 to be exact.
This one is not gonna hold as I see it'll play around $200ish. My scary scenario it will go to $190 as the nearest strong support and start longing from there.
*************************************************************************
If all of these ideas I posted helps you, give them thumbs up, shares, comments and follow me. If you have a suggestion, just fill in the comment sections or message me. Looking forward to hear from you all. Thanks a lot!
-------------------------------------------------------------------------
www.tradingview.com Rules:
#1 Always obey tradingview.com house rules
#2 Always read the description
#3 Don't spam on the comment section
#4 If you wanted to request my opinions about a coin/token just give 10 likes on my published charts and I will do it the day or two after
#5 My opinions are not financial advice, follow it at your own will and your own risk
#6 Together, let's build a better community on this platform
-------------------------------------------------------------------------

NASDAQ - Ripe for RetracementNasdaq is ripe for retracement. Should be one wave left in the retracement pattern, especially with most people moving towards heavy retail for the holiday shopping season. Don't expect the sell off to end before mid Nov.

Bullish reversal expected for Netflix stocksThere appears to be a rising support line which the price action does cross occasionally. I'm expecting the price to dip below it slightly as the RSI drops, then look out for a bullish reversal.
Hit like if you agree.


NFLX - DAILY TREND - 21. SEPTEMBER 2018WELCOME TO DACAPITAL TRADING!!
DAILY STOCK MASTER SIGNAL
1 HOUR
Strong bullish open with instant jump above previous Highs
4 HOUR
Bullish market after a pullback, following normal trend now
OVERALL
Very strong and bullish stock, following this trend.
LEVELS
BUY NFLX @ 370.70
SL @ 362.70 (820 Pips)
TP OPEN, WE RIDE THE WAVE!
„We will move our SL every day! Be patient!
Enjoy our limited Content and Setups,
leave us a like and Comment!!

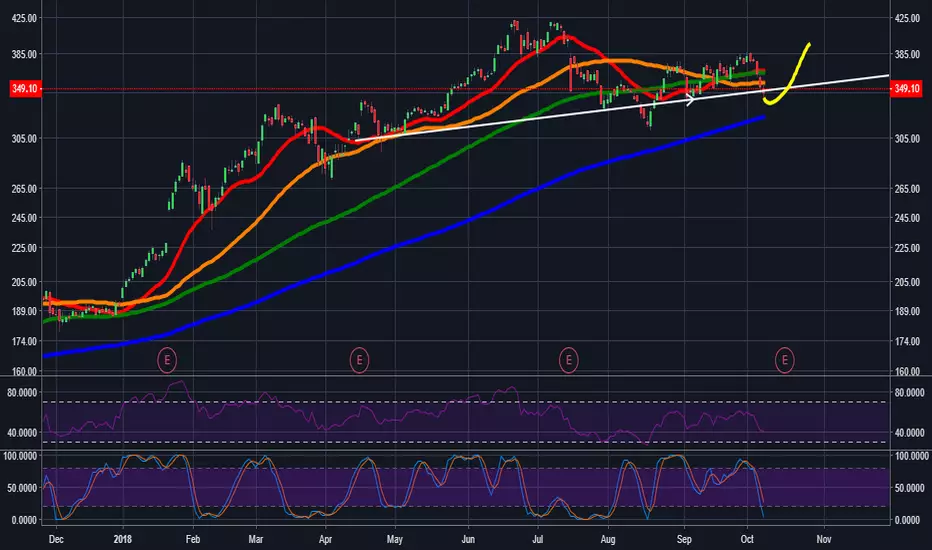
NFLX: We are headed to the mid-400sDear all, with regards to context if you don't understand the concept of Elliot Wave theory please take a few minutes to study it or my analysis will not be clear. I believe we are in the final wave of a bullish 5 wave structure in NFLX which started back in Dec. 17. I have not displayed the beginning of the wave count because there is more important recent information I've highlighted within the chart. So long as the recent low of 310.93 holds trend based Fibonacci levels on the chart and a verbal message pegged in b/w them show a conclusion of the rally in the mid 400s. As of writing MACD is fine and On Balance Volume shows there is steadily increasing buying interest.
Thanks for reading, questions and criticisms welcome

Went Long in NFLX on discounted pricesWe went long on NFLX on this demand level. Its always a better idea to go long on a discounted price.
Cheers :)

NFLX Long Off the 50 EMA: Good VolumeBeautiful example of old resistance new support. NFLX bouncing off the 50 EMA | an old support at the $280 price range | and a fib, all good.

Continuation pattern: Long NFLX. RSI ConfluenceWe will be going long NFLX if the bull pennant pattern comes to fruition. Along with the reaching of new highs of the Nasdaq this should be good for a decent sized move. Update on targets later on in the day.

NFLX - Time to go longAfter it held trend line support and with the break out from the triangle, it's time to go long NFLX. The spike volume also is positive and supports our hypothesis.

5.30.2017 Trade Idea: NFLXIf you are interested in more of our trades, check out our profile and Tradingview Indicator @ChaoticTrader
