NetflixWow , Netflix stock is huge sharp decreased and really i just determined one supply zone in weekly time but its not thecnical things its MACRO DATA THING
Nflxshort

Was the NFLX sell-off predictable???Of course it was! You could have sold the head and shoulders bearish chart pattern back in November, before Jim Cramer said NFLX is a buy! :)
My forecast is that NFLX will make a small bounce before going even lower, at a buy area of $175 - 190.
Looking forward to read your opinion about it.

Netflix Potential Double BottomHey there as you know netflix bloody novadays, especially elon musk talk about this company. In technicaly we see double bottom here confirmation is 362 if we retest again 362$ its safe to bought this stocks.

NFLXNot financial advice.
The essence of investing & trading is the intelligent and patient preying on the greed, fear, impatience, addiction and ignorance of the majority. It's definitionally Darwinian.

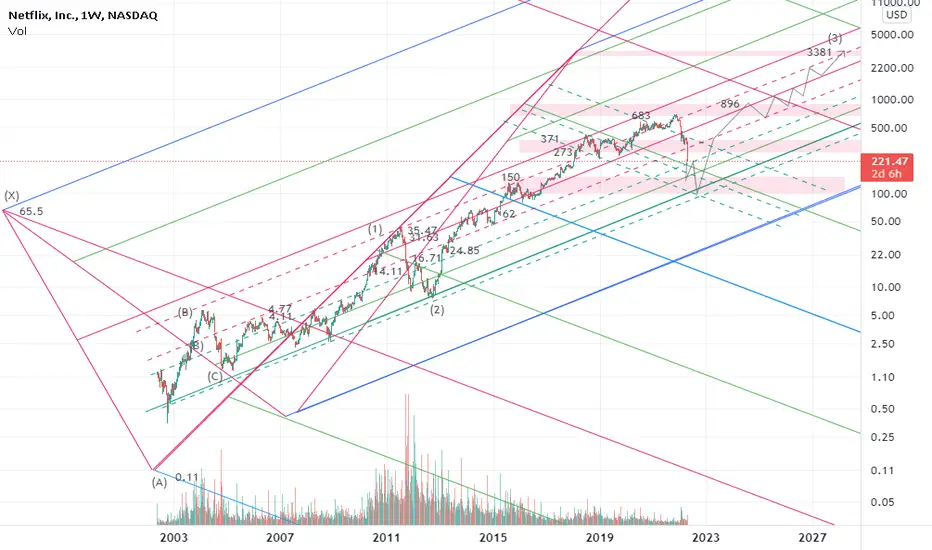
NETFLIX still has space till $100 to slidecrab harmonic pattern:
X=$65.5
A=$0.11
AB=0.61 XA
BC=0.38 AB
1.6 BC=$14.11
0.78 XA=$16.71
2 BC=$24.85
0.88 XA=$31.63
2.24 BC=$35.47
2.6 BC=$62.1
1.13 XA=$150
3.6 BC=$273
1.27 XA=$371
4.23 BC=$683
1.41 XA=$896
1.6 XA=$3381
NETFLIX, scenarios and targets Fundamentally :
After the quarantine ended, people went out of their homes and Netflix became less in demand in the entertainment industry.
But what if people get used to life without Netflix?
Netflix needs serious solutions like new, good and exclusive business to get its users back
Technically :
price can pump from this level (255; 210) to 350 and maybe till 445
the down scenario the next support will be at 130 per share

Netflix in More Trouble? Netflix - Short Term - We look to Sell at 358.64 (stop at 378.80)
Preferred trade is to sell into rallies. Previous support, now becomes resistance at 360.00. The primary trend remains bearish. The bias is still for lower levels and we look for any gains to be limited.
Our profit targets will be 291.27 and 281.07
Resistance: 360.00 / 400.00 / 450.00
Support: 300.00 / 290.00 / 250.00
Disclaimer – Saxo Bank Group. Please be reminded – you alone are responsible for your trading – both gains and losses. There is a very high degree of risk involved in trading. The technical analysis, like any and all indicators, strategies, columns, articles and other features accessible on/though this site (including those from Signal Centre) are for informational purposes only and should not be construed as investment advice by you. Such technical analysis are believed to be obtained from sources believed to be reliable, but not warrant their respective completeness or accuracy, or warrant any results from the use of the information. Your use of the technical analysis, as would also your use of any and all mentioned indicators, strategies, columns, articles and all other features, is entirely at your own risk and it is your sole responsibility to evaluate the accuracy, completeness and usefulness (including suitability) of the information. You should assess the risk of any trade with your financial adviser and make your own independent decision(s) regarding any tradable products which may be the subject matter of the technical analysis or any of the said indicators, strategies, columns, articles and all other features.
Please also be reminded that if despite the above, any of the said technical analysis (or any of the said indicators, strategies, columns, articles and other features accessible on/through this site) is found to be advisory or a recommendation; and not merely informational in nature, the same is in any event provided with the intention of being for general circulation and availability only. As such it is not intended to and does not form part of any offer or recommendation directed at you specifically, or have any regard to the investment objectives, financial situation or needs of yourself or any other specific person. Before committing to a trade or investment therefore, please seek advice from a financial or other professional adviser regarding the suitability of the product for you and (where available) read the relevant product offer/description documents, including the risk disclosures. If you do not wish to seek such financial advice, please still exercise your mind and consider carefully whether the product is suitable for you because you alone remain responsible for your trading – both gains and losses.

NFLX - Don't be involuntary investorMonthly chart is showing clear breakdown..short term rally is likely to be short lived with more bad news to follow.
Below 420, next level is 250.
Everything that goes up comes down.

Netflix Wycoff Distribution I believe many of the large cap stocks in the market are going through large distributions. This is my take on Netflix ($NFLX) using Wycoff Method and his Distribution Schematics. There could be signs of recovery, but unless they have intense volume they will likely be Bull Traps. If the upward movement is on relatively low volume that is a sign of continuation to the downside finishing with Phase E .

NFLX Netflix SelloffIf you haven`t shorted the top at my last call:
then you can see NFLX reached a strong support area and it`s now consolidating.
In 2021 insiders sold around $500Mil worth of shares.
The buy opportunity area is $350 - $385 in my opinion if you want to long it once again.
Looking forward to read your opinion about it.

NFLX: Setting the Stage for Big Tech and Growth Earnings on Thursday and the first big tech name to report (as always).
Over 527 can give you a trade, but I think they want to take this thing down to the 500 mark in to earnings. I will spec buy at 3:58pm on Thursday (eastern time) the $510c if she is red and trading around $500.

NFLX Netflix Head and Shoulders Chart PatternIs NFLX Netflix heading for a Head and Shoulders Bearish formation Chart Pattern?
My price target is the 628usd resistance.
I look forward to read your opinion about the price movement.

AAPL, MSFT, & NFLX ShortNow I just got Pro+ on Black Friday sale so I'm having some fun with the chart layout.
Here's the reasoning for my shorts:
AAPL:
- Bearish Rising Wedge
- Decreasing volume to pair
MSFT:
- Bear Flag in massive pivot zone
NFLX:
- Quite large double top after significant uptrend
- Neckline recognized as pivot point
- Decreasing volume to pair
Note: I would only short these two on the breakout below and possibly a retest.
Happy Shorting,
Stefan

NETFLIX(NFLX) FUTURE PREDICTIONTechnical Analysis Summary (POLKADOT)
NTFX/USDT
TREND ANALYSIS
We have 3 upwardtrend which is currently active in green.
The wider the trend the longer it is respected.
FUTURE PREDICTIONS
We have to keep respecting and holding new weekly levels and maintaning the trend to keep moving upward.
ALL THE GREEN SUPPORT LEVELS SHOW HOW NETFLEX KEPT LADDERING AND RESPECTING NEW AND HIGHER WEEKLY LEVELS AND CREATING TIGHTER TRENDS.
Good luck everyone, stay safe!
If you need help don't hesitate to send me a message or comment
Trading Involves High Risk
Not Financial Advice
Exercise Proper Risk Management

Short NFLX - Retracement Strategy All details written on chart. Target #2 and Target #3 will be based on the entry.

UPDATE on NFLX! I think the head and shoulders don't have power!Hello everyone!
Looks like the H&S that I post it before don't have that much power so I'm looking for some short position.
Just in case: If the price go up and breakout the resistance, the H&S is confirmed!
Enjoy it!

NFLX ShortEntry price: 610-615$
Target price: 575-580$
Stop loss: 620-625$
Bollinger Bands: The price is approaching the upper band.
RSI: Indicator is approaching 70 level, therefore the market is near to be overbought.
Fibonacci Retracement: The price is approaching the resistance level (Fib 1.618 level).
Conclusions: Bollinger Bands and RSI suggest the trend reversal in the near future. Moreover, the price is approaching Fib resistance level, thus the short position is recommended with the stop loss above Fib 1.618 level.
No financial advice.

NFLX short?Now what? Squid game? but i think it is enough for NFLX, now lets short it
If it breaks that orange line it maybe become next bull run

NFLX Potential Bullish BreakoutPrice saw a decisive breakout on September 1st, breaking the major resistance level at 575. We even saw a re-test back down at this level last week. Now, it looks like the price is resuming off to the upside again.

NFLX ShortEntry price: 559-569$
Target price: 502-510$
Keltner Channel: the price crossed the upper boundary.
RSI: indicator crossed 70 level, the market is overbought. Therefore, the bearish movement might occur.
Conclusions: RSI and Keltner Channels suggest the trend retracement. The short position is recommended after the price rejects from the resistance level.
no financial advice


NFLX Stock To Keep In Portfolio!Hello ladies and gentlemen, according to my graphical analysis of NFLX , I recommend for the moment to keep NFLX Stock in your portfolio because there is a great probability of reaching 560$ in the next few weeks .

