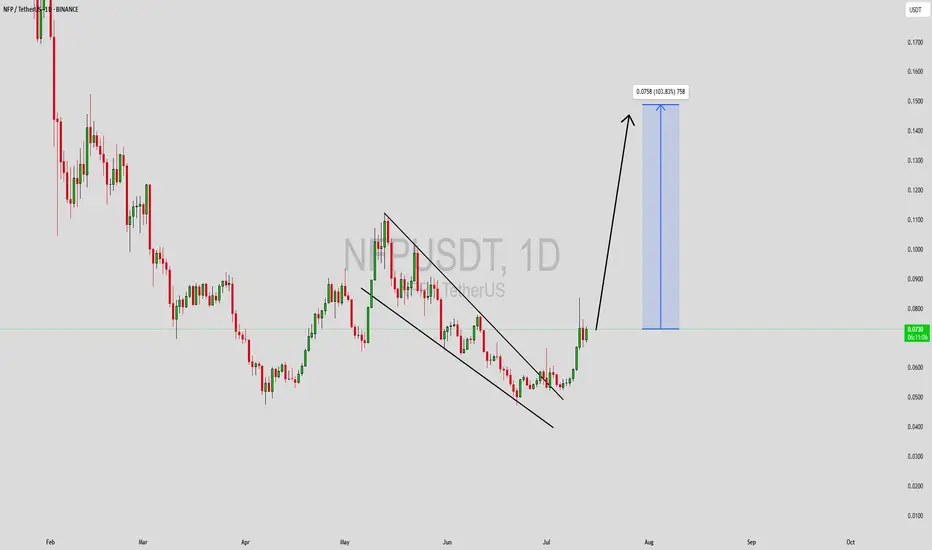
NFPUSDT Forming Descending ChannelNFPUSDT is starting to attract significant attention as it shows signs of reversing its downward trend with a promising technical setup. This crypto pair has recently broken out of a descending channel, indicating that selling pressure might be subsiding while buyers are stepping in. The price structure suggests a clear path for a potential bullish continuation, and the projected target hints at a strong gain of around 90% to 100%+. Technical traders are closely watching this level for a confirmed breakout and a sustained rally.
The volume on NFPUSDT remains good, showing that liquidity is healthy and there’s active participation from traders and investors. This is a critical factor in validating the breakout — when volume aligns with price action, the odds of a strong move increase. Many crypto traders rely on these confirmation signals to enter early positions, capturing the momentum as it picks up. With the market sentiment slowly shifting, NFPUSDT could see an influx of new interest in the coming weeks.
Investors are increasingly taking interest in this project, not just from a technical perspective but also due to its fundamentals and community engagement. As the crypto market looks for solid setups in a sea of volatility, pairs like NFPUSDT stand out for their clear patterns and realistic upside potential. Keep an eye on support levels holding firm and whether the breakout candle closes above resistance with strength.
✅ Show your support by hitting the like button and
✅ Leaving a comment below! (What is You opinion about this Coin)
Your feedback and engagement keep me inspired to share more insightful market analysis with you!
Nfp
NFP Bears gathering their troops? or will the Bulls stampede...The past 9 days have been quite interesting for the EUR/USD which has been relentless. Price has been rising like a helium balloon let loose at the park...
Bulls have clearly been in control, not only the past 9 days but since the beginning of the year with the exception of the strong pullback in April & May only to bounce for another 700 pip run.
I am totally USD bearish across the board as I have been mentioning in my analysis videos for the past few months but like all macro moves, we always have pullbacks along the way and that is why I have been shorting the EUR/USD back from 1.1500+ - 1.1700+
I've given this a lot of room to breathe, more than usual but considering the following technical setup, I'm willing to give the Bears some leeway and potentially show me they'll come through.
•Rising Broadening pattern (Where two trendlines start close together only to divergence and expand) - This is a bearish pattern.
•Negative Divergence on the MACD, Linear Regression & the RSI.
•Price has made a run to the yearly R3 pivot level. (Rare extension)
•Last daily candle is a hanging man candlestick (Reversal candle)
•Weekly chart has the EUR/USD at the upper band of a polynomial regression channel which calculates for price extremities in the market.
There are a few more setups as well but it's too much to describe here and I'd have to show it in a video (Which I plan to do over the weekend)
With all of that said... It could all fail lol but seriously speaking... You just can't ask for a better probabilistic setup so whatever happens during NFP... happens.
Aside from the technical aspect... I know yearly R2 around 1.1600 was a hotspot for shorts because divergence was at the early stages and taking a short there wouldn't have been a bad idea but we know institutions are in play as well, so above 1.1600 could have been a huge area to run stop losses and margin calls before a potential reversal.
250 pips would be enough to run a large pool of stops and liquidation.
IF price is going to reverse here during NFP, I believe late longs and breakout/pullback traders are going to try and buy at the trendline at 1.1660ish but it wont hold and trap them on the other side of the trade.
Under that, I can see us pulling back towards 1.1200ish...
If the Bears give up and price continues to climb... the original macro target may very well be under way which was 1.2000 - 1.2200 (Based on a Monthly and 3-Month chart analysis)
As of this writing the EUR/USD is pretty much completely flat which is expected before the NFP fireworks ahead of July 4th.
We'll see what happens tomorrow morning! buckle up!
As always, Good luck and Trade Safe! See you post NFP.

THE KOG REPORT - Update & NFP analysis End of day update from us here at KOG:
We managed to get the move into the red box we wanted which should have been a enough for the day. However, the levels were so clean during NY that we managed to get another decent trade into the Excalibur target to complete the day.
With NFP tomorrow and a US holiday on Friday, we're going to share our levels and view but due to unforeseen circumstances, I won't be around for the rest of the week to see it through.
We've added the updated red boxes, the key levels and the potential move if they break. So far, we've had a good week, so these levels are simply for reference and unless there is a clean set up, our traders will stay away until Monday.
Red boxes:
Break above 3350 for 3355, 3362, 3373, 3375 and 3390 in extension of the move
Break below 3335 for 3320, 3316, 3310. 3306, 3298 and 3285 in extension of the move
The week so far:
KOG’s bias for the week:
Bullish above 3250 with targets above 3278✅, 3285✅, 3297✅ and above that 3306✅
Bearish below 3250 with targets below 3240, 3232, 3220 and below that 3212
RED BOX TARGETS:
Break above 3275 for 3279✅, 3285✅, 3289✅ and 3306✅ in extension of the move
Break below 3260 for 3255, 3251, 3240 and 3235 in extension of the move
As always, trade safe.
KOG

EUR/USD: A Perfect Storm for BullsThis is a high-conviction long setup based on a powerful combination of macroeconomic divergence and a confirmed multi-year technical breakout.
The Non-Farm Payrolls report has now been released, and the resulting price dip has created what I believe is an ideal entry opportunity to align with the dominant bullish trend.
The Fundamental Why 📰
NFP Aftermath: Yesterday's NFP report was a mixed bag that ultimately reinforces the case for Fed rate cuts. The headline number beat expectations, causing an initial USD rally and a dip in EUR/USD. However, the underlying details like wage growth were soft. Crucially, the market continues to price in a 96% probability of a Fed rate cut by September, a figure that was unchanged by the data. The core driver of USD weakness—a dovish Fed—remains firmly intact.
Resilient EUR 🇪🇺: In contrast, the ECB has signaled it is at or near the end of its easing cycle. Economic data from core Eurozone countries is stabilizing, providing the Euro with relative strength.
Risk-On Sentiment 💹: The broader market remains in a "risk-on" mood, which is typically negative for the safe-haven USD. Gold is soaring and equities are near all-time highs, confirming the anti-dollar flow.
The Technical Picture 📊
The Secular Breakout 🚀: The most significant event is the breakout of a decade-long downtrend resistance line. This is a major structural shift. The pair has also achieved a monthly and quarterly close above the critical 1.1500 handle, turning a historic resistance level into a new support floor.
The Impulsive Uptrend 🌊: On the 4-hour chart, the price is in a clear ascending channel. The post-NFP dip represents a healthy correction within this uptrend, bringing price back toward key support.
Key Levels 🔑:
Support Zone: The dip has brought price directly into the key support confluence between 1.1700 and 1.1760, making this an ideal area to enter long.
Resistance Zone: Major resistance still sits at 1.1900, making it a prudent take-profit target.
Strategy & Risk Management 🧠
The stronger-than-expected NFP headline has provided the exact pullback this strategy was designed for. The dip presents a prime opportunity to buy into the dominant uptrend at a more favorable price. Instead of chasing the market, we are now positioned to enter on a technically sound correction.
Good luck, and trade safe!
Trade Parameters ✅
Pair: EUR/USD
Direction: Long / Buy 🟢
Entry Type: Limit Order
Entry Price: 1.1745
Stop-Loss: 1.1685 (60 pips) 🔴
Take-Profit: 1.1895 (150 pips) 🎯
Risk/Reward Ratio: 2.5 : 1

Gold Setup for July 3th: Don’t Get Caught in the Liquidity Net🌙 Good evening, sniper — lock in, load up, and let’s dance with Thursday’s chaos 💣
🌍 Macro & Geopolitical Pulse
Thursday’s setup is not for amateurs:
🔸 Non-Farm Employment Change
🔸 Unemployment Rate
🔸 Initial Jobless Claims
🔸 ISM Services PMI
🔸 Factory Orders
Add to that:
• A Fed still talking tough on rates
• Geopolitical flare-ups in the Black Sea and Middle East
• Gold trading deep into premium…
💡 This is where markets hunt weak hands, then flip direction without mercy.
We don’t chase candles. We wait for exhaustion. Then we execute.
🎯 Bias Snapshot (D1 → H4 → H1)
• Daily closed bullish but deep into old CHoCH + OB
• H4 printed HHs, but structure now presses into stacked supply
• H1 shows momentum fading — RSI divergence + weakening push
📌 Core bias: Still bullish — but every pip above 3360 is loaded with risk.
If 3380 fails to break cleanly, expect rejection.
If it breaks — the market likely wants full liquidity above 3400.
🗺️ Battlefield Zones
🟢 Buy Zone #1 – 3310 to 3320
The sniper’s discount pullback: Fibo 38.2%, M30 OB, EMA 50, and clean imbalance.
Wait for news spike + bullish confirmation to go long.
🟢 Buy Zone #2 – 3285 to 3295
The deep reaction zone.
Fibo 61.8% + OB + gap. Enter only on violent wick and rejection — but RR is exceptional.
🟡 Flip Zone – 3334 to 3340
This is where momentum flips:
• Hold above = continuation toward premium
• Break below = bearish reversal unlocked
No entries here — this is your compass, not your trigger.
🔴 Sell Zone #1 – 3357 to 3366
Classic CHoCH retest. H1/H4 OB with layered liquidity.
If price rejects here on post-news spike — short it back toward the flip.
🔴 Sell Zone #2 – 3387 to 3395
Top-of-range sweep.
If gold blows through zone 1, this becomes liquidity trap central.
Wait for rejection wick + bearish PA confirmation.
🔴 Sell Zone #3 – 3410 to 3420
The final premium kill zone.
This is where the market finishes stop-hunting every breakout buyer.
Fibo extension 1.272–1.618 hits here. If we wick this zone and stall — sniper short back to 3380–3366.
⚔️ Execution Blueprint
Wait for news to trigger the chaos — early entries are a donation.
Short 3357–3366 on exhaustion → target flip zone.
If price overextends into 3387–3395, get ready for the reversal play.
Extreme spike to 3410–3420? That’s your killshot short — ride it back down.
If price retraces into 3310–3320, it’s your safe sniper long.
Panic into 3285–3295? Deep long entry, only with confirmation.
Watch the flip zone (3334–3340) — above = bullish bias holds; below = bears back in control.
🎯 No guesswork. No hope. Just precision. Wait, confirm, and strike.
💬 Let’s stay sharp tomorrow — market will offer clean setups, but patience and clarity are key.
If this plan helped, drop a comment or share your thoughts below.
👉 Follow GoldFxMinds for daily sniper-entry plans crafted with precision.
Smash that🚀🚀🚀 if this plan sharpened your edge.
📝 You already know — we don’t guess, we execute. 🦅
Good night, snipers 💛
⚠️ Disclosure
I’m part of TradeNation’s Influencer Program and use their TradingView charts for analysis & educational content.


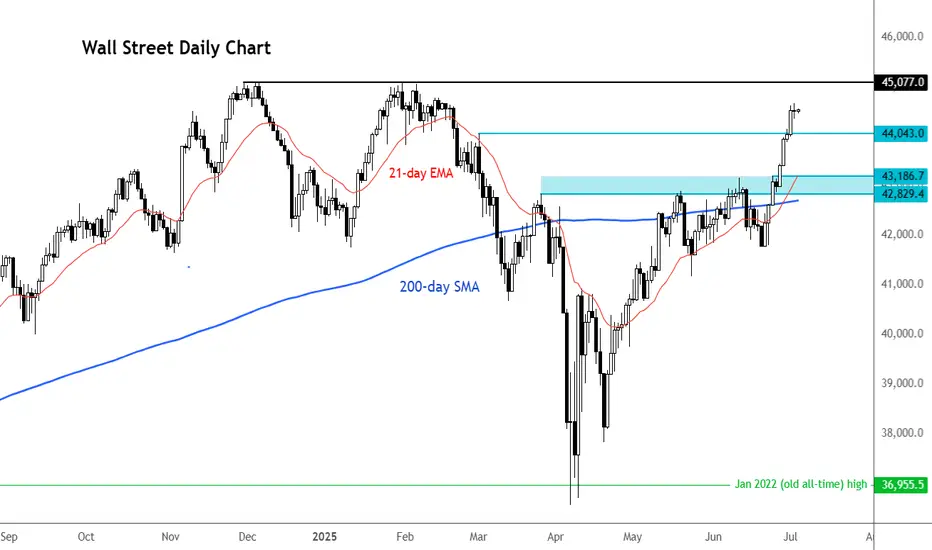
Can Dow hit new highs?While the likes of the S&P 500 and Nasdaq 100 are already record highs, the Dow has not achieved that target yet. It continues to make higher highs and higher lows, and the momentum seems to be getting stronger. Soon, it may even flirt with fresh all-time highs, as investors ride the tailwinds of a robust rally that kicked off in early April. There have been a few catalysts behind this rally. First, it was Trump hitting pause on reciprocal tariffs; then, a wave of optimism washed over markets following a sudden de-escalation in the Middle East. The bulls took charge, and markets haven’t looked back since. But with 4 July celebrations on the doorstep and Wall Street due to close at 1pm NY time, today’s shortened session has a singular focus: the all-important US non-farm payrolls report. Will we have enough time to see the Dow march to new highs? The key levels are marked on the chart.
By Fawad Razaqzada, market analyst with FOREX.com
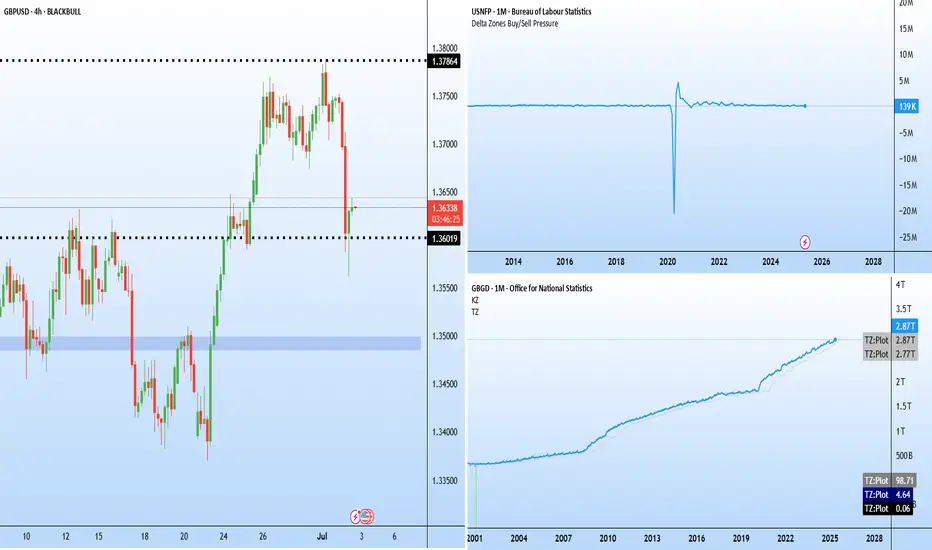
Jobs vs politics: GBPUSD caught in crossfire Two major stories are developing on either side of the Atlantic.
ADP reported a 33 k fall in June private payrolls (consensus +95 k). It is the third straight miss and sets the tone for Thursday’s early Non-Farm Payroll (NFP) release, brought forward because of the 4 July holiday.
In the UK, speculation is growing around the position of Chancellor Rachel Reeves after an emotional appearance in Parliament. Prime Minister Keir Starmer declined to confirm whether she would remain in the role, sparking questions over the government’s fiscal direction.
The political uncertainty helped accelerate the sell-off in GBPUSD, which has fallen sharply from recent highs near 1.38. The latest candles show a long lower wick around 1.3600, indicating that buyers are attempting to defend the area. If this support fails to hold, the next downside target lies near 1.3485–1.3500, which acted as a base for the late-June rally.
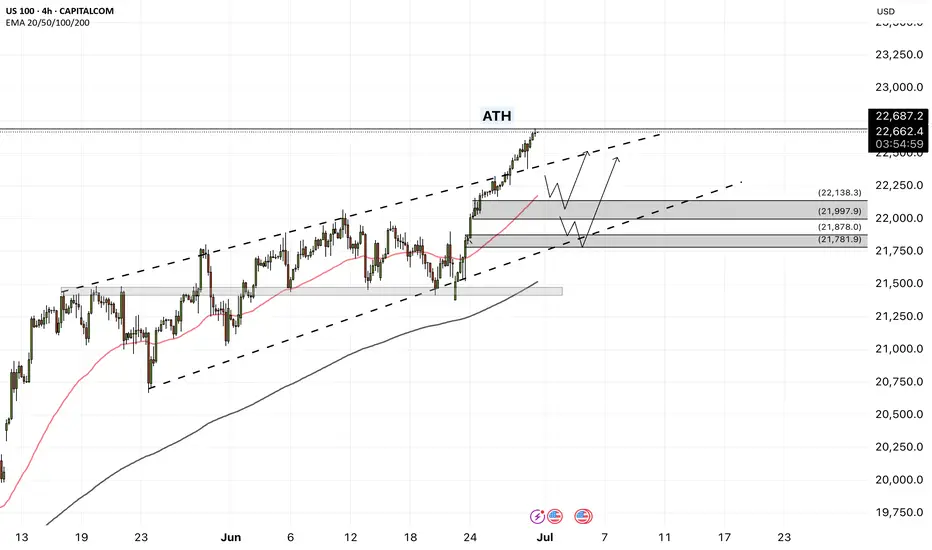
NAS100 - The stock market is breaking the ceiling!The index is above the EMA200 and EMA50 on the four-hour timeframe and is trading in its medium-term channels. If it does not increase and corrects towards different zone, it is possible to buy the index near the reward.
Following a strong rally in U.S.equities, the S&P 500 and Nasdaq indices both achieved new all-time highs on Friday. It marks the first time since February that the S&P 500 has surpassed its previous peak, while the Nasdaq entered fresh price territory for the first time since December.
Despite ongoing market focus on economic data and the Federal Reserve’s interest rate policy path, the simultaneous surge in both indices reflects a renewed appetite for risk in the stock market—an appetite that has been accelerating since mid-April, especially in tech stocks.
In contrast, the Russell 2000 index, which tracks small-cap U.S. companies, still remains significantly below its prior high. To return to its October levels, it would need to rise over 13.5%. However, Friday’s 1.7% gain suggests capital is beginning to flow more broadly into underrepresented sectors.
Analysts argue that a strong breakout in the Russell 2000 could signal a broader rotation toward increased risk-taking—possibly driven by optimism over future rate cuts, easing inflation, and improved business conditions in the second half of the year.
Now that the S&P 500 has reached new highs and the Nasdaq has joined in, attention turns to the Russell 2000. If it begins to accelerate upward, markets could enter a new phase of sustained bullish momentum.
Following a week focused on gauging U.S. consumer spending strength, the upcoming holiday-shortened week (due to Independence Day) will shift attention to key employment and economic activity data.
On Tuesday, markets await the ISM Manufacturing PMI and the JOLTS job openings report. Wednesday will spotlight the ADP private employment report, and Thursday—one day earlier than usual due to the holiday—will see the release of several crucial figures, including the Non-Farm Payrolls (NFP), weekly jobless claims, and the ISM Services Index.
Currently, investor reaction to Donald Trump’s tariff commentary has been minimal. Market participants largely believe that any new tariffs would have limited inflationary effects and that significant retaliation from trade partners is unlikely.
Friday’s PCE report painted a complex picture of the U.S. economy. On one hand, inflation remains above ideal levels; on the other, household spending is showing signs of fatigue—a combination that presents challenges for policymakers.
Inflation-adjusted personal consumption fell by 0.3%, marking the first decline since the start of the year and indicating a gradual erosion of domestic demand. While wages continue to rise, their impact has been offset by declining overall income and reduced government support. To maintain their lifestyle, households have dipped into their savings, driving the personal savings rate down to 4.5%—its lowest level this year.
On the inflation front, the core PCE price index—the Fed’s preferred inflation gauge—rose 2.7% year-over-year, slightly above expectations. Monthly inflation also increased by 0.2%. Although these figures appear somewhat restrained, they remain above the Fed’s 2% target, with persistent price pressures in services—particularly non-housing services—still evident.
Altogether, the data suggest the U.S. economy faces a troubling divergence: weakening household income and consumption could slow growth, while sticky inflation in the services sector—especially under a potential Trump tariff scenario—could limit the Federal Reserve’s ability to cut interest rates.
ETH HIT THE LIKE TO MANIFEST THISETH/USD is teasing the breakout zone again... 👀
Are we finally ready for liftoff, or is it another fakeout? 🚀🔄
The chart’s looking spicy, and the energy feels right. 🌌
Hit that like to manifest the pump — we’re in this together. 💎🙏
Let’s speak green candles into existence! 📈✨
#ETH #Ethereum #CryptoVibes #ManifestMoneyMoves #ETHUSD #ToTheMoon"

GOLD → Correction to 3275FX:XAUUSD and medium-term outlook: Friday's strong unemployment data strengthened the dollar and triggered a sell-off in gold. Money is temporarily flowing out of the metal and into currencies and the stock market...
Technically, gold is still in a bullish phase on the global timeframe. Logically, the situation is more reminiscent of a countertrend correction of the zone of interest before continuing growth.
Despite the rise in the DXY after Friday's news, the dollar is still under pressure from Trump, who is pushing for an early interest rate cut. This move could significantly shake the market (dollar down, gold up)
Locally, on the hourly XAUUSD timeframe, we can clearly see how the price is breaking out of the uptrend, thereby triggering a downward impulse.
Resistance levels: 3325, 3343
Support levels: 3303, 3275
The liquidity level of 3300 could act as a magnet for the price, from which a correction to the resistance of the range of 3325 could form (liquidity hunt), but due to the change in the fundamental background, gold may continue its correction to 3275 (support zone) before a possible continuation of growth.
Best regards, R. Linda!

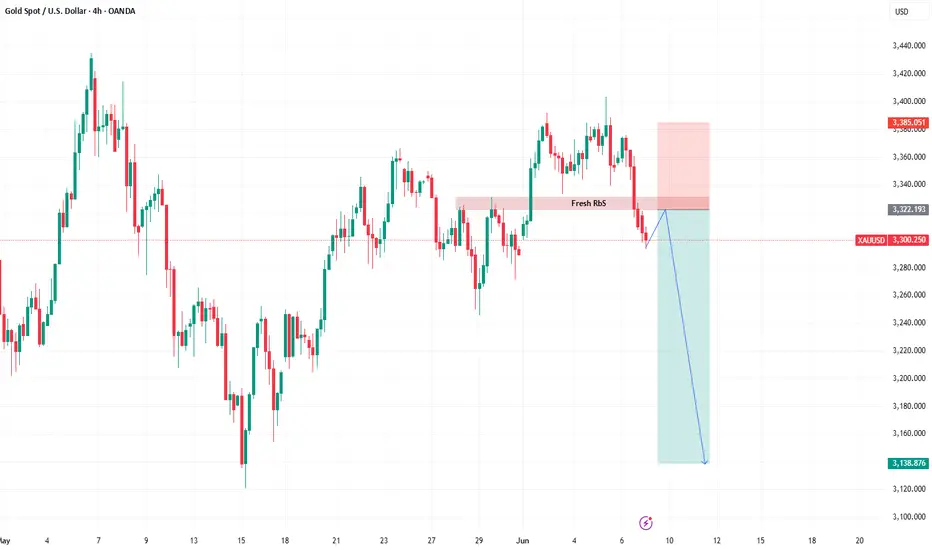
XAUUSD after NFPBased on chart
Price already break the RbS area
So for now the plan is to wait the price to retest the RbS area then drop
GBP/USD Is This the Last Dip Before 1.37?🔹 1. Price Action & Technical Structure (Weekly & Daily Charts)
Price has broken above the ascending channel highlighted on the weekly chart.
The 1.3545 area is currently acting as dynamic resistance — a weekly close above it is crucial to confirm a breakout.
Below, we find a bullish order block (demand zone) around 1.3340 – 1.3280, aligning with the 0.5 Fibonacci level.
RSI is neutral, showing no bearish divergence at the moment.
🔹 2. COT Report (Commitment of Traders)
USD Index:
Non-commercial traders: +823 new longs, +363 new shorts → Neutral to bullish positioning.
Commercials remain net short, indicating short-term USD strength potential.
EUR FX (inverse proxy for USD):
Significant reduction in speculative long positions → Less bullish pressure on the Euro, favoring USD strength.
🔹 3. Sentiment
67% of retail traders are short GBP/USD vs. 33% long.
This is a bullish contrarian signal, suggesting potential continuation toward the 1.36–1.37 zone.
🔹 4. Seasonality
Historically, June tends to be bearish for GBP/USD over the past 5–10 years.
However, the first 10 days of the month often start with bullish momentum before correcting in the second half.
🔹 5. Economic Calendar
Today: Construction PMI (GBP), ECB Press Conference (EUR), Unemployment Claims (USD).
Tomorrow: High potential volatility across all USD pairs.
Watch out — upcoming macro data may strongly impact breakout confirmation.
🔹 6. Operational Outlook
Primary Bias: Neutral/Bullish with potential for a technical pullback.
📍 Key Levels:
Resistance: 1.3545 – 1.3593 (Supply zone + 0.0 fib)
Support: 1.3340 – 1.3280 (OB + 0.5/0.618 fib)
🧠 Scenario 1 – Bullish Continuation:
Retest of 1.3340 → long targeting 1.3590 / 1.3680
Confirmation on daily close above 1.3550
🔻 Scenario 2 – Bearish Retracement:
Rejection below 1.3550 + USD macro strength → drop toward 1.3280
If that breaks → extended move to 1.3170 / 1.3150

THE KOG REPORT - NFPQuick one today as we haven't had much time to put together the report.
Instead, the red box levels are shared below and the extreme red boxes are on the chart.
We have key level 3365 which needs to break as shown and key level 3345 which needs to break downside.
RED BOX TARGETS
Break above 3365 for 3366, 337, 3385, 3390, 3406 and 3420 in extension of the move
Break below 3350 for 3345, 3336, 3329, 3320, 3310 and 3298 in extension of the move
As always, trade safe.
KOG

Just got the May NFPs... Let's have a lookWe just received the May NFPs, which, overall, are not bad. Let's dig in.
TVC:DXY
TVC:DJI
FX_IDC:USDJPY
FX_IDC:USDCAD TVC:GOLD
Let us know what you think in the comments below.
Thank you.
77.3% of retail investor accounts lose money when trading CFDs with this provider. You should consider whether you understand how CFDs work and whether you can afford to take the high risk of losing your money. Past performance is not necessarily indicative of future results. The value of investments may fall as well as rise and the investor may not get back the amount initially invested. This content is not intended for nor applicable to residents of the UK. Cryptocurrency CFDs and spread bets are restricted in the UK for all retail clients.


XAUUSD - Gold awaits NFP!Gold is trading in its ascending channel on the hourly timeframe, between EMA200 and EMA50. We should wait for a valid breakout of the pattern we identified yesterday, from which we had a Fick break above. We can enter the trade after it breaks in the formed pattern, and on the other hand, if gold corrects towards the demand zone, we can buy it in the short term with a reward at an appropriate risk.
Gold came under downward pressure amid renewed optimism regarding U.S.-China trade talks. Although prices surged to a four-week high earlier in the day due to strong demand from Asian and European buyers, a wave of selling during U.S. trading hours reversed part of that gain.
This shift in momentum coincided with rising U.S. Treasury yields and a boost in market sentiment following a phone call between the presidents of China and the United States. While no official statement has been issued yet, the decision to initiate a new round of high-level negotiations was seen as a positive signal. In recent months, gold has become a key indicator for gauging geopolitical and trade-related risks, having previously surged to an all-time high of $3,500 after the “Freedom Day” tariffs were implemented.
Despite ongoing concerns over Ukraine, Iran, and the growing U.S. fiscal deficit—which provide fundamental support for gold—the metal’s inability to break above the key resistance level of $3,437 has cast doubt on the short-term bullish outlook.
Meanwhile, Goldman Sachs has projected that the upcoming U.S. nonfarm payrolls (NFP) report for May will show a 125,000 increase in jobs. The unemployment rate is expected to remain steady at 4.2%, and monthly wage growth is estimated at 0.3%. The bank also anticipates a 10,000-job decline in the public sector, largely due to tariff-related policies and reduced hiring. Overall, Goldman Sachs expects the report to be balanced and free of surprises, which should encourage the Federal Reserve to maintain its current policy stance.
Although gold has managed to stabilize above $3,000 per ounce in recent weeks, many investors remain focused on reclaiming the historic peak reached in April. According to one research firm, it’s only a matter of time before that level is tested and broken again.
In the annual “Gold Focus 2025” report published Thursday by the UK-based firm Metals Focus, analysts stated that gold retains strong momentum for further gains in 2026. They forecast that the average gold price this year could reach an unprecedented $3,210, with new highs likely in the second half of the year.
In an interview with Kitco News, Metals Focus CEO Philip Newman said it is difficult to envision a scenario that would derail the current bull market. While this perspective isn’t included in their formal forecasts, he believes the rally could extend into 2026.
Newman added, “If you look at what’s happening across the global economy, all the ingredients for a structural bull market are present.” He highlighted that one of gold’s unique traits is how quickly investors adapt to new price levels, often converting previous resistance levels into future support. A year ago, he admitted he would have expected $3,000 to trigger widespread profit-taking.
However, despite ongoing economic uncertainty and geopolitical instability, investors have not been discouraged by current price levels. Newman emphasized that what makes 2025 distinct is that new investors are just now entering the market. While gold has been rallying since 2023, much of the demand until recently came from central banks and Asian markets—particularly China.
Newman noted that only in Q4 of last year and early this year did retail investors begin to decisively adopt a bullish stance. “We’ve seen strong growth in investment demand this year,” he said, “but there’s still a large amount of capital that hasn’t entered the market yet. This is not a bubble—this is a well-supported, structurally sound market.”
He concluded by identifying changing perceptions of the U.S. dollar as a major driver behind increased gold investment.While the dollar remains a traditional safe haven, ongoing trade tensions and unsustainable government debt levels have eroded market confidence, prompting investors to seek safety and diversification through gold.

USDX 1-Hour Timeframe – NFP 6 Jun 2025
Technical Analysis Report on USDX in Relation to the Non-Farm Payroll (NFP) Data – 6 June 2025
Tags: PEPPERSTONE:USDX

ES Trade Idea and Upcoming NFP ReportCME_MINI:ES1!
• What has the market done?
ES futures are lagging compared to tech heavy index NQ futures. ES futures are still below yearly open. Yearly open has been a strong area of resistance since the rally of April 6th Lows in futures complex.
• What is it trying to do?
ES futures are in consolidation mode, building value higher. VPOC has shifted higher since the gap up from May 11th open. VPOC and 0.786 fib level provide a base for a continuation higher.
• How good of a job is it doing?
Markets seem to be slowing its rally. After such a strong rebound, participants are wary of any pull-backs. Although a strong trend higher, consolidation or a pullback is not illogical at these levels.
• What is more likely to happen from here?
o Scenario 1: Hold steady and NFP provides needed boost for markets to get across yearly open resistance and climb higher.
o Scenario 2: A mixed NFP report may point towards further consolidation. Key level 5873 as support on move lower before reverting higher.
o Scenario 3: A hawkish NFP report that signals higher for longer rates, may be interpreted by market participants as less monetary stimulus and dwindling rate cut bets for this year. We anticipate a sell-off towards 0.618 fib level in this scenario, moving to the lower edge of micro composite volume profile.
In all the above scenarios, there is a clear LIS at yearly open. Other key levels are defined cleanly on the higher time frame. Important thing for traders to note here is to trade what you see and not what you think. Having an alignment between fundamentals and technicals is sound but the markets do what they do, and price moves where it should. Painting narrative to any move may sound fancy but it gets less important at intraday time frames in our opinion. Hence why we view all this considering auction markets and volume profile.
Glossary:
ES - emini-S&P 500 Futures
NQ - emini-NASDAQ 100 Futures
VPOC - Volume Point of Control: The most traded price by volume in a given range. Represents acceptance or consensus
NFP - Non-Farm Payroll: Released by the US Department of Labor around the 1st Friday of every month. It reports on Unemployment, Productivity and other key metrics. Key economic release
LIS - Line In the Sand: A key zone that might tip buyers or sellers to act to cover risk and might change the overall bias of our analysis

XAUUSD - Gold Awaits Employment Data!Gold is trading above the EMA200 and EMA50 on the 4-hour timeframe and is trading in its ascending channel. If gold corrects towards the demand range, it can be bought in the short term with appropriate risk-reward. A break of the resistance range will also pave the way for gold to rise to $3,400.
In April, the U.S. labor market demonstrated resilience and flexibility, with job openings climbing to 7.4 million—exceeding analysts’ expectations. Hiring reached its fastest pace since May 2024, as employers brought on 5.6 million new workers. While these upbeat figures surprised many, some economists remained cautious, warning that ongoing tariff policies could weigh on the labor market later this year.
Recent labor market data have featured unexpected results, mostly leaning positive. According to Tuesday’s report from the Bureau of Labor Statistics, job openings in April surpassed forecasts, rising from 7.2 million in March to 7.4 million.
Despite the encouraging nature of the data, the overall labor market picture has not shifted dramatically. Month-to-month fluctuations aside, the broader trend reflects a slowdown compared to the post-pandemic period when demand for workers was extremely high. Economists continue to expect that the uncertainty surrounding President Donald Trump’s tariff campaign will further hinder job creation in the months ahead.
Robert Frick, corporate economist at Navy Federal Credit Union, wrote in a commentary: “These figures still reflect a gradually slowing but stable job market. The jump in openings is more indicative of normal data volatility than a genuine surge in new positions. Likewise, the increase in hiring isn’t a strong recovery signal, as hiring remains within recent weak ranges.”
Alison Sriwastava, labor economist at the Indeed Hiring Lab, added: “The data show that U.S. employers had enough confidence to maintain more job openings in April than in March—whether through strong planning, resilient supply chains, or a bit of luck. But just because employers had a good month doesn’t mean they can sustain that success indefinitely, especially given the continued uncertainty and volatility.”
Meanwhile, the White House confirmed that it had sent letters to several countries asking them to submit their best trade offers by Wednesday. Progress on trade agreements since “Liberation Day” has been sluggish and challenging, and now all eyes are on what the Trump administration will do next.
Reuters obtained the letter, which asked countries to present their best proposals regarding tariffs, purchase quotas for U.S. goods, and plans to eliminate non-tariff barriers. However, according to the New York Post, immediate retaliation or action from the White House should not be assumed. Citing a source familiar with the matter, the letter’s purpose was described as an assessment of trade partners’ progress rather than a call for final offers.
In the diplomatic arena, newly appointed German Chancellor Friedrich Merz is set to meet with Donald Trump at the White House on Thursday following weeks of consultations. Key topics on the agenda include the war in Ukraine, Middle East crises, and trade policy. Merz, who recently took charge of Europe’s largest economy, has made rounds through major European capitals and now seeks to ease tensions with the Trump administration. The main areas of contention between Washington and Berlin involve trade imbalances, support for Ukraine, and domestic policy disputes.
This meeting presents a rare opportunity for Merz to voice his positions directly to Trump—unlike his predecessor, who never received a White House invitation.Nevertheless, Merz faces numerous challenges, ranging from far-right political pressures at home to clashes over tech companies on both sides of the Atlantic.
Meanwhile, President Donald Trump’s 50% tariffs on imported steel and aluminum officially took effect at 12:01 AM Eastern Time on Wednesday. These now-doubled tariffs apply to all trading partners except the United Kingdom. As the only country to have reached a preliminary trade deal with the U.S. so far, the U.K. will remain under a 25% tariff until at least July 9.
The executive order signed by Trump on Tuesday stated that the action is intended to “more effectively counter foreign nations that continue to sell excess and underpriced steel and aluminum in the U.S. market, undermining the competitiveness of America’s domestic steel and aluminum industries.”

Macro Outlook: Trade War Jitters, Deficit, NFP FridayAlthough there is a headline fatigue and markets have been stabilizing with the worst of trade war story behind us, the fact is that uncertainty still looms. President Trump announced over the weekend that he will double down on US steel and aluminum tariffs from 25% to 50% effective June 4th.
Highlight this week is US Jobs data this Friday. A key point to determine the resilience of the US labor market. With FED Chair Powell speaking today and FED speakers scheduled throughout the week, it will be key to watch how they shape markets' probability of rate cuts?
As we previously explained, ongoing uncertainty and dragging trade concerns present more risks until resolved. Here are some key points to consider:
It remains to be seen whether the trade deficit will continue to worsen or begin to reverse. April trade data, along with any policy shifts such as a reversal on reciprocal tariffs, will be important to monitor. These indicators will provide insight into how businesses are interpreting ongoing trade uncertainty. The key question is whether they will continue front-loading inventory in anticipation of future disruptions, or if the focus will shift toward restructuring supply chains and reining in spending as part of a longer-term strategic adjustment.
At the same time, consumer spending remains resilient, supporting overall demand. However, pressure may be building on business balance sheets, particularly businesses with poor cash flow to manage front loading inventory spending as the trade environment remains volatile. If consumer spending begins to weaken, businesses may be forced to cut costs, scale back investment, or offer steep discounts to clear excess inventory. This could lead to a cycle of margin compression, especially if firms attempt to pass higher costs onto price-sensitive consumers, potentially suppressing demand further.
Conversely, if businesses choose to absorb rising costs to maintain competitive pricing, they face deteriorating margins but may be betting on continued strength in consumer credit, household savings buffers as evident. Consumer confidence, despite being low, is not an accurate indicator in times of uncertainty. Here, we should watch what consumers do and not the sentiment.
In this scenario, firms may delay cost-cutting in the hope that continued strength in consumer spending will support revenues through the rest of the year.
A central tension remains: businesses must navigate a delicate balance between protecting margins and preserving demand. Meanwhile, persistent trade uncertainty and tighter financial conditions may slow capital investment and hiring, further complicating the outlook. Whether firms shift from defensive postures like front-loading toward long-term structural changes in supply chains will hinge on how durable current consumer strength proves to be and how responsive trade policy becomes in the months ahead.
Ongoing front-loading has caused ripples as the trade deficit has further widened. Will this reverse as businesses focus on sales and revenue instead of front-loading inventory?
In our analysis, trade imports, trade balance, consumer spending and corporate profits will be key to monitor despite being lagging indicators.
On the other hand, equally important to watch and monitor goods exports, durable goods to assess and evaluate the other side of the equation.
However, our focus is on imports as manufacturing jobs are at their lowest in US history.
Once the dust has settled and trade deals are locked in, it will be important to note if Exports by Country experience any significant shifts.
What does all this mean for the stock market and futures? In simple terms, the yearly pivot and last month’s high is a major resistance area for index futures. Until this is cleared, we may see a range bound market and two way trade. There is a lot of weak structure to revisit lower. Markets may perhaps retest this before resuming higher. What we would want to see is, last month’s low holding support and this month’s price action trading inside previous month’s range or resuming higher.
If we revisit May Monthly Lows, we may see increased selling pressure come in.

XAUUSD - Gold is on the verge of a very important week!Gold is trading above the EMA200 and EMA50 on the four-hour timeframe and is trading in its ascending channel. I predict the path ahead for gold to be upward and if the resistance level is broken, we can look for buying opportunities. If gold corrects, we can also buy it with a reward at an appropriate risk.
Gold prices experienced a mild decline over the past week, with market sentiment shaped less by fundamental shifts and more by mixed messages and scattered commentary around tariffs.Despite the noise, many traders chose to rely on data and technical charts rather than reacting emotionally—data that painted a more subdued picture than the headlines suggested.
Rich Checkan, CEO of Asset Strategies International, responded confidently in a recent survey, predicting further gains in gold. “The trajectory for gold is clearly upward. Prices have stabilized around the $3,300 level and appear ready for a new rally, especially if the appellate court’s ruling on tariffs is upheld,” he said.
Checkan also pointed to another macroeconomic factor that could support gold: “A new tax bill, described as large and costly, is set to be voted on in the Senate soon. If passed, it will likely widen the budget deficit, which historically leads to increased liquidity and rising inflation—a favorable environment for gold.”
On Friday, the PCE inflation report showed easing price pressures, though not enough to put the Federal Reserve at ease. Core PCE (excluding food and energy) rose by 0.1% month-over-month and 2.5% year-over-year in April—matching expectations and slightly down from 2.7% the previous month. The headline PCE also increased 2.1% annually, just below the forecast of 2.2%.
The key point: these data reflect the first month in which Trump’s new tariffs were active, yet there’s little evidence so far that they’ve caused inflation to rise. Still, the disinflationary trend remains sluggish and distant from the Fed’s 2% target. In its latest minutes, the Fed warned that inflation may prove more persistent than previously thought.
Nick Timiraos of The Wall Street Journal, despite the seemingly positive PCE numbers, issued a cautionary note with four key insights:
• The inflationary impact of tariffs is expected to begin showing up from May and be fully reflected in June’s data. This could accelerate goods price increases and disrupt the path of disinflation.
• Last year’s monthly PCE figures were particularly weak (May: 0%, June: 0.1%, July: 0.2%). As these drop out of the annual calculation, even if monthly gains remain steady, YoY rates could rise mathematically.
• The three-month average for Core PCE from May to October 2024 was only 0.1%. If upcoming monthly figures hit 0.2%, annual disinflation could stall or even reverse.
• While the latest report is encouraging, the effects of tariffs and the removal of last year’s weak data could complicate the inflation trajectory.
Looking ahead, market attention will focus heavily on a suite of crucial U.S. labor market indicators. The Job Openings and Labor Turnover Survey (JOLTS) is due Tuesday, private sector employment data (ADP) on Wednesday, and jobless claims on Thursday. However, the most anticipated release will be Friday’s Non-Farm Payrolls (NFP) report for May—widely viewed as a key factor influencing rate expectations.
Alongside labor data, markets will also watch other critical economic reports. The ISM Manufacturing PMI on Monday and the ISM Services PMI on Wednesday will offer broader insight into U.S. business activity. In the realm of monetary policy, interest rate decisions from the Bank of Canada (Wednesday) and the European Central Bank (Thursday) are expected to trigger notable movements in the currency and gold markets.

GOLD Price Analysis: Key Insights for Next Week Trading DecisionIn this video, we dissect how gold traded last week (May 26–30), why the price hovered near the top of a descending channel, and what’s driving market indecision. From geopolitical tensions to Federal Reserve interest rate uncertainty, we connect the dots between fundamentals and technical structure, enabling you to make better-informed trading decisions.
📅 Key Events to Watch This Week:
✅ISM Manufacturing PMI
✅ADP Employment Change
✅ISM Services PMI
✅Average Hourly Earnings
✅Non-Farm Payroll (NFP)
🎯 In this analysis, I walk you through:
🔸My technical blueprint (key zones for buyers & sellers)
🔸My bullish and bearish scenarios based on the structure on the chart
🔔 Don’t forget to like the video in support of my work.
Disclaimer:
Based on experience and what I see on the charts, this is my take. It’s not financial advice—always do your research and consult a licensed advisor before trading.
#GoldAnalysis #XAUUSD #GoldPriceForecast #GoldTrading #ForexAnalysis #MarketOutlook #NFP #FOMC #TechnicalAnalysis #FundamentalAnalysis #GoldBulls #GoldBears #TradingStrategy #Darcsherry #XAUUSDAnalysis #GoldOutlook #GoldPricePrediction
