Australian dollar hits five-month high after Australian electionThe Australian dollar continues to impress and has posted strong gains on Monday. European session, AUD/USD is trading at 0.6491, up 0.72% on the day and its highest level since early December 2025.
Prime Minister Anthony Albanese cruised to a resounding victory in Saturday's national election. Albanese' centre-left Labor Party increased its majority and thumped the Liberal Party opposition. The coalition's defeat was marked by its leader, Peter Dutton losing his own seat.
The long shadow of US President Donald Trump was a factor in the election. Dutton adopted right-wing policies such as promising tougher immigration laws and establishing a platform to reduce the waste of public funds. The similarities between Dutton and Trump hurt the Liberal leader as many voters were upset with Trump's 10% tariffs on Australia.
At the start of the year, Albanese was trailing badly in the opinion polls. However, he struck a receptive chord among voters on domestic issues such as health care and housing, and benefited from the anti-Trump sentiment, which proved to be a winning recipe.
US nonfarm payrolls, a key gauge of the US labor market, dipped slightly to 177 thousand in April, down from a revised 185 thousand in March. This easily beat the market estimate of 130 thousand. The positive unemployment report points to a resilient labor market which remains strong despite the US economy declining in the first quarter.
The markets have responded by lowering the odds of a rate hike in June to 33%, down sharply from 60% a week ago, according to the CME's FedWatch. The Federal Reserve meets on Wednesday and is virtually certain to maintain the benchmark rate of 4.25%-4.5%.
Nfp

EURUSD | Head‑&‑Shoulders on the Brink – Bears Eye 1.1250📉 Trade Thesis
A textbook Head‑and‑Shoulders has completed on the 30‑min EURUSD chart. Price is now testing the rising neckline drawn from mid‑April swing lows. A clean close and retest beneath that trendline opens room toward the next demand shelf and the lower boundary of the broader ascending channel.
🎯 Execution Plan
Entry: wait for a decisive candle close below the neckline, then look to short on a minor pull‑back into that broken support.
Stop: just above the right‑shoulder high to keep risk tight.
Target: the measured‑move objective sits near the channel median/support cluster highlighted on the chart; scale out as price approaches that zone.
🧩 Confluence Factors
Momentum loss: RSI made a lower peak on the “head” versus the prior thrust, signalling fading upside energy.
Event risk: upcoming NFP/ISM releases may fuel USD volatility, providing the catalyst for a break.
Structure: the right shoulder’s supply shelf has capped every rally since late April, reinforcing bearish pressure.
⚠️ Risk Management
Macro data can produce whipsaws—size positions accordingly and stick to the plan. Move stops to breakeven once price pushes convincingly away from the neckline.
For educational purposes only. Trade your own strategy & manage risk.

NFP: A Hidden Gem?#NFP has crashed over -95% since its late 2023 listing.
However, the rebound it had last month may signal the end of the downtrend.
Holding above $0.0545 (stop-loss) is crucial to avoid new ATLs and to validate a potential bullish reversal targeting higher levels.
#NFPrompt

Euro breaks slide as eurozone core CPI climbs, US nonfarm payrolThe euro has posted gains on Friday. In the European session, EUR/USD is trading at 1.1325, up 0.37% on the day. Today's gains follow a three-day slide. US nonfarm payrolls came in at 177 thousand, much stronger than the market estimate of 130 thousand.
Eurozone inflation for April was a surprise on the upside. Headline CPI remained steady at 2.2% y/y, edging above the market estimate of 2.1%. Lower energy prices were offset by a rise in service inflation and food prices. Monthly, CPI was also unchanged at 0.6%, above the forecast of 0.4%.
Core CPI, which excludes food and energy and is a better gauge of inflation trends, jumped to 2.7% y/y, up from 2.4% in March and above the market estimate of 2.5%. This was the first acceleration in the core rate since May 2024. Services inflation, a key component in Core CPI remains hot and jumped to 3.9% from 3.5% in March.
The rise in core CPI is a worrisome sign for the European Central Bank and could complicate plans to gradually lower interest rates. The ECB has been aggressive, cutting rates by 175 basis points in the current easing cycle. Still, more cuts are needed to boost the ailing eurozone economy.
US nonfarm payrolls came in at 177 thousand in April, slightly below the downwardly revised gain of 185 thousand in March. This easily beat the market estimate of 130 thousand and is a sign that the US labor market remains in decent shape. Wage growth was unchanged at 3.8% y/y, just below the market estimate of 3.9%. Monthly, wage growth dropped to 0.2% from 0.3%, shy of the market estimate of 0.3%.

THE KOG REPORT - NFPTHE KOG REPORT – NFP
This is our view for NFP, please do your own research and analysis to make an informed decision on the markets. It is not recommended you try to trade the event if you have less than 6 months trading experience and have a trusted risk strategy in place. The markets are extremely volatile, and these events can cause aggressive swings in price.
We’ve done well this week on gold, capturing the high into the low and then taking the long late session which has nearly completed our higher target for a decent week on this precious metal. As we’ve said, best practice is to let this play out, let them take it to where they want, once it settles, then look for the trade.
We have support now at the 320-35 level which is a key level that will need to break in order to reverse and go lower. This level also lines up with our Excalibur levels and red boxes so we can say it’s pretty strong. Above, we have the 3270-75 region which is the previous order level, our volume indicator is suggesting a pull back, so rejection there can take us back into support to settle for the NFP release. It’s this level, if held which can push this upside and our thoughts are at the moment, are they going to take this back into the previous range and hold it there into the close.
So as long as 3240 holds us, we’re likely to see higher pricing for now, 3310-20 is the key level above which needs to break to then give us the flip and potential for a new all time high.
For now, let’s sit back and see what happens.
RED BOXES:
Break above 3262 for 3265, 3270, 3275 and 3288 in extension of the move
Break below 3252 for 3240, 3236, 3230 and 3220 in extension of the move
Please do support us by hitting the like button, leaving a comment, and giving us a follow. We’ve been doing this for a long time now providing traders with in-depth free analysis on Gold, so your likes and comments are very much appreciated.
As always, trade safe.
KOG

NFP is out. Market reaction - 2025.05.02The NFP number came out higher than the forecast, but lower than the previous (even the revised one). The initial reaction was in favour of DXY, but it has gone quiet very quickly. Maybe because of the fact that the market is preparing for some action on 7th of May, when the Fed announces interest rates.
Let's dig in...
MARKETSCOM:DOLLARINDEX
FX_IDC:AUDUSD
FX_IDC:USDJPY
Let us know what you think in the comments below.
Thank you.
77.3% of retail investor accounts lose money when trading CFDs with this provider. You should consider whether you understand how CFDs work and whether you can afford to take the high risk of losing your money. Past performance is not necessarily indicative of future results. The value of investments may fall as well as rise and the investor may not get back the amount initially invested. This content is not intended for nor applicable to residents of the UK. Cryptocurrency CFDs and spread bets are restricted in the UK for all retail clients.

Can USD/JPY hold THIS key support after a mixed NFP report? The US dollar traded mixed shortly after the NFP was released, as risk-on sentiment remained the prevailing trend. As index futures rose further, commodity dollars extended their gains against the greenback, while the USD/JPY attempted to find support around the key 144.00 - 144.50 area. This zone was resistance in the past so let's see if the UJ will be able to rebound from here later in the session, and in early next week.
NFP comes in stronger, but...
The nonfarm payrolls data “beat” forecasts, with a headline print of 177K vs. 138K eyed. But data for March was revised lower to 185K rom 228K. Revisions to prior two months have taken out 58K from initial estimates. Taken together, this is hardly a beat. But the good news was that full-time employment rose sharply. The unemployment rate, meanwhile, was unchanged at 4.2%.
On the inflation side of things, average earnings came in slightly lower than expected, rising 0.2% on a month-over-month basis, compared with 0.3% expected. Nothing to get too excited over, but potentially good news as far as inflation is concerned – especially after we saw a slightly weaker Core PCE Price Index in mid-week.
NFP was never going to matter much
The market’s focus is on trade war and trade negotiations. We were never going to see any wild market reactions, and so it has so far proved. The US dollar initially spiked then quickly returned to pre-NFP levels. Gold fell, and index futures added onto earlier gains.
Up next: ISM Services PMI on Monday and FOMC on Thursday.
By Fawad Razaqzada, market analyst with FOREX.com

AUDUSD SELL (USD NFP NEWS FRDAY TOMORROW)As the chart looks its building resistance with many wicks, we can most likely see AUDUSD will drop tomorrow as Non-Farm Payroll from USD. It does not seem it will push up as I thought to expect to break the resistance, but still keep a good watch on it.
Take Profit: 0.634 or below

Yen slides as BoJ cuts growth forecastThe Japanese yen continues to lose ground and is sharply lower on Thursday. In the European session, USD/JPY is trading at 144.36, up 0.92% on the day. Earlier, the yen weakened to 144.74, its weakest level since April 10.
There were no surprises from the Bank of Japan, which maintained its key interest rate at 0.5% in a unanimous vote. The BoJ has signaled that it plans to continue hiking rates and normalize policy, but the turmoil caused by US President Trump's tariff policy may delay the next rate increase until after the summer.
The BoJ board cut its growth and inflation forecasts in its quarterly outlook report. The growth forecast for the fiscal year ending March 2026 was slashed to 0.5% from 1.1% in January and inflation is not expected to remain sustainable at 2% until the second half of 2026, a year later than in the January forecast.
The forecast noted that US tariffs would dampen Japan's economy by weighing on global trade and consumer and businesses confidence would be impacted due to the "heightened uncertainties" over the tariffs.
The markets expected a soft US GDP release for Q1 but the 0.3% q/q decline was well below the market estimate of 0.2%. This followed a strong 2.4% gain in the fourth quarter of 2024. The surprise decline was driven by Trump's tariffs, as imports surged ahead of the tariffs taking effect and consumer spending declined.
The weak GDP figure raised the probability of further rate cuts and the markets are looking for up to four rate cuts before the end of the year. The Fed is in a wait-and-see mode, with little chance of a cut in May, but further economic deterioration could force the Fed to cut in June.

ES Futures: Upcoming Mag 7 Earnings and NFP Report
This week, although there was not much market-moving macro newsflow over the weekend, we are approaching month-end. In addition, several key catalysts are on the horizon, including earnings from the Magnificent 7 and the release of Non-Farm Payrolls (NFP) data, which typically arrives on the first Friday of the month.
The Federal Reserve is currently in its blackout period ahead of the interest rate decision scheduled for May 7th, 2025.
As part of our process, we will be reviewing technical levels and drawing a plan based on current market structure. ES futures are currently trading above the March 2025 lows. A “death cross” — where the 50-day moving average crosses below the 200-day moving average on the daily timeframe — was recently observed. This pattern is commonly touted by analysts as a bear market indicator.
However, in a macro-driven environment, this could potentially be a false signal.
Key Levels:
• mCVAL: 5622
• Upper Neutral Zone: 5620 -5585
• March 2025 Low: 5533.75
• 2022 CVAH: 5384.75
• Lower Neutral Zone: 5171.75 -5150.75
Our scenarios are as follows:
Scenario 1: Range-bound price action
A P-shaped micro composite profile suggests resistance at our neutral zone. It is labeled neutral because the price is trading above the March 2025 lows. However, if the level above acts as resistance, we expect further range-bound price action. Markets may trade below the mCVAL for further price discovery and potentially establish a new short-term range, with the 2024 lows acting as downside support.
Scenario 2: Mag 7 and NFP as bullish catalysts
Four of the Magnificent 7 companies are reporting earnings this week. The Mag 7 collectively represent around one-third of the S&P 500 index by market capitalization. Microsoft and Meta are scheduled to report on Wednesday after the close, while Amazon and Apple report on Thursday after the close.
On Friday, the NFP data will be released. This could serve as a fundamentally net-positive catalyst for U.S. markets, especially in light of recent shocks that have weakened sentiment.
In this scenario, we will be closely watching our neutral zone and mCVAL as potential areas to initiate long trades.
Glossary Index for all technical terms used:
Blue Zones: Neutral zones.
C: Composite (prefix before VAL, VAH, VPOC, VP, AVP)
mC: micro-Composite (prefix before VAL, VAH, VPOC, VP, AVP)
VAL: Value Area Low
VAH: Value Area High
VP: Volume Profile
CME_MINI:ES1!

#NFP/USDT#NFP
The price is moving within a descending channel on the 1-hour frame, adhering well to it, and is heading for a strong breakout and retest.
We are seeing a bounce from the lower boundary of the descending channel, which is support at 0.0700.
We have a downtrend on the RSI indicator that is about to be broken and retested, supporting the upward trend.
We are looking for stability above the 100 moving average.
Entry price: 0.0714
First target: 0.0726
Second target: 0.0744
Third target: 0.0763

NFP Roadmap (1D)It seems that the NFP has entered a corrective phase from the point where we placed the red arrow on the chart.
Currently, it appears to be in the bearish wave C of this phase, and wave C itself is a symmetrical pattern. At the moment, we are in wave g of this symmetrical pattern.
This symmetrical pattern could complete in the green zone, and the price may enter wave D, which is a bullish wave.
In the green zone, one could look for buy/long positions. it’s best to enter a position with confirmation.
A daily candle closing below the invalidation level would invalidate this analysis.
For risk management, please don't forget stop loss and capital management
Comment if you have any questions
Thank You

Canadian dollar slides as Canada's job growth declinesThe Canadian dollar has stabilized on Monday after declining close to 1% on Friday. In the North American session, USD/CAD is trading at 1.4225, up 0.23% on the day. It has been a roller-coaster for the Canadian dollar, which jumped 1.1% on Thursday but gave up almost all of the gains a day later.
Canada's economy shed 32.6 thousand jobs in March, the biggest decline since August 2022. This was a sharp reversal from the 1.1 thousand gain in February and much lower than the market estimate of 12 thousand. The unemployment rate rose to 6.7% from 6.6% and the participation rate ticked lower to 65.2% from 65.3%.
The employment data points to weakness in the labor market and the economic chill from the latest US tariffs could lead to further deterioration of the employment landscape.
Businesses are holding back on investment and hiring due to the economic uncertainty and the plunge in oil prices will hurt the economy, as Canada is a major oil producer.
US nonfarm payrolls surprised on the upside with a gain of 228 thousand, up from a revised 117 thousand in February and above the market estimate of 135 thousand. This was the strongest nonfarm payroll reading in three months.
The positive employment report was overshadowed by the latest round of US tariffs which have sent the financial markets tumbling lower. There are increasing fears that the US tariffs and expected counter-tariffs could upend the US economy and tip it into a recession.
Investors are hoping that the Trump administration will reduce the tariffs or at least announce negotiations will take place with targeted countries. So far, however, Trump has sounded defiant and said that the tariffs will stay in place.

NFP beats but focus is fixated on trade warToday’s NFP report was NEVER going to take much attention away from the trade war – and so it has proved with mixed readings. US rates were being priced lower amid deteriorating trade war risks, which remains the main focal point. Powell is up next, while CPI, PPI and UoM surveys all on tap next week.
The nonfarm payrolls data beat expectations, with a headline print of 228K. Most of those gains were in full-time jobs. But the unemployment rate ticked higher to 4.2% from 4.1% unexpectedly. Market’s focus is on trade war, and rightly so. They were never going to go wild on this NFP release.
Average earnings came in as expected, rising 0.3% on a month-over-month basis, but the prior month weas revised lower a tad. Year-over-year rate was weaker 3.8% vs. 4.0%. Nothing to get too excited over, but potentially good news as far as inflation is concerned.
By Fawad Razaqzada, market analyst with FOREX.com

Let's cover the action of some instruments as we get the NFPLet's see what's happening with the market as we get the NFP number live.
Let's dig in!
MARKETSCOM:DOLLARINDEX
TVC:DXY
TVC:GOLD
FRED:SP500
FX_IDC:EURUSD
MARKETSCOM:EURUSD
Let us know what you think in the comments below.
Thank you.
77.3% of retail investor accounts lose money when trading CFDs with this provider. You should consider whether you understand how CFDs work and whether you can afford to take the high risk of losing your money. Past performance is not necessarily indicative of future results. The value of investments may fall as well as rise and the investor may not get back the amount initially invested. This content is not intended for nor applicable to residents of the UK. Cryptocurrency CFDs and spread bets are restricted in the UK for all retail clients.

Markets eye US, Canada job reports, US dollar steadiesThe Canadian dollar has taken a break after an impressive three-day rally, in which the currency climbed about 2%. In the European session, USD/CAD is trading at 1.4148, up 0.39%. On Thursday, the Canadian dollar touched 140.26, its strongest level since December.
The hottest financial news is understandably the wave of selling in the equity markets, but there are some key economic releases today as well. The US and Canada will both release the March employment report later today.
The US releases nonfarm payrolls, with the markets projecting a gain of 135 thousand, after a gain of 151 thousand in February. This would point to the US labor market cooling at a gradual pace, which suits the Federal Reserve just fine. The Fed will also be keeping a watchful eye on wage growth, which is expected to tick lower to 3.9% y/y from 4.0%. The unemployment rate is expected to hold at 4.1%.
The employment landscape is uncertain, with the DOGE layoffs and newly-announced tariffs expected to dampen wage growth in the coming months. Canada's employment is expected to improve slightly to 12 thousand, after a negligible gain of 1.1 thousand in February. Unemployment has been stubbornly high and is expected to inch up to 6.7% from 6.6%.
US President Donald Trump's tariff bombshell on Wednesday did not impose new tariffs on Canada, but trade tensions continue to escalate between the two allies. Canada said it would mirror the US stance and impose a 25% tariff on all vehicles imported from the US that do not comply with the US-Canada-Mexico-Canada free trade deal. The US has promised to respond to any new tariffs against the US, which could mean a tit-for-tat exchange of tariffs between Canada and the US.
USD/CAD has pushed above resistance at 1.4088 and 141.26. The next resistance line is 1.4170
1.4044 and 1.4006 are the next support levels

Markets eye US, Canada job reports, US dollar steadiesThe Canadian dollar has taken a break after an impressive three-day rally, in which the currency climbed about 2%. In the European session, USD/CAD is trading at 1.4148, up 0.39%. On Thursday, the Canadian dollar touched 140.26, its strongest level since December.
The hottest financial news is understandably the wave of selling in the equity markets, but there are some key economic releases today as well. The US and Canada will both release the March employment report later today.
The US releases nonfarm payrolls, with the markets projecting a gain of 135 thousand, after a gain of 151 thousand in February. This would point to the US labor market cooling at a gradual pace, which suits the Federal Reserve just fine. The Fed will also be keeping a watchful eye on wage growth, which is expected to tick lower to 3.9% y/y from 4.0%. The unemployment rate is expected to hold at 4.1%.
The employment landscape is uncertain, with the DOGE layoffs and newly-announced tariffs expected to dampen wage growth in the coming months.
Canada's employment is expected to improve slightly to 12 thousand, after a negligible gain of 1.1 thousand in February. Unemployment has been stubbornly high and is expected to inch up to 6.7% from 6.6%.
US President Donald Trump's tariff bombshell on Wednesday did not impose new tariffs on Canada, but trade tensions continue to escalate between the two allies. Canada said it would mirror the US stance and impose a 25% tariff on all vehicles imported from the US that do not comply with the US-Canada-Mexico-Canada free trade deal. The US has promised to respond to any new tariffs against the US, which could mean a tit-for-tat exchange of tariffs between Canada and the US.
USD/CAD has pushed above resistance at 1.4088 and 141.26. The next resistance line is 1.4170
1.4044 and 1.4006 are the next support levels

NFP + tariffs = market chaos? In addition to tariff rumors, reports, and retaliations, this week’s Nonfarm Payrolls (NFP) could add even more volatility to markets.
Gold continues to hit record-high after record-high (best quarterly performance since 1986), could be the most important asset to watch.
The market consensus expects the US economy to have added 128,000 jobs in March, down from February’s 151,000.
Danske Bank is more cautious, perhaps responding to Consumer confidence deteriorating to its lowest level since 2013, projecting just 110,000.
Trading Economics is even more bearish, forecasting an increase of only 80,000 jobs. What do they know that others don’t? If they're right, markets may not be priced for it.

Surging yen hits 5-month high, wage data mixedThe Japanese yen has started the week with strong gains. In the European session, USD/JPY is trading at 147.07, down 0.766 on the day. Earlier, the yen strengthened to 146.72, its best level since Oct. 4, 2024.
Japan's wage data for January was mixed. Base pay for Japanese workers jumped by 3.1% y/y but more importantly, inflation-adjusted real wages declined by 1.8%. This follows two consecutive months of gains and signals that inflation has outpaced growth.
The wage report was released just days before the end of annual wage negotiations at Japan's largest companies. The largest labor union in Japan is demanding large wage hike of 6% and the Bank of Japan wants to see a strong rise in wages in order to keep inflation sustainable at the 2% level.
The BoJ has urged companies and workers to reach a deal that significantly raises wages. The central back meets next week and is widely expected to keep interest rates unchanged. Still, the Bank has signaled it plans to continue raising rates during the year.
In the US, nonfarm payrolls rose to 151 thousand in February, up from a downwardly revised 125 thousand in January but shy of the market estimate of 160 thousand. The unemployment rate rose to 4.1% from 4%. Wage growth eased to 0.3% m/m from a revised 0.4% in January, in line with expectations. Annualized, wages ticked higher to 4%, up from a revised 3.9% in January but below the market estimate of 4.1%.
The employment report was decent but the threat of US tariffs continues to cloud the economic outlook. If trade tensions escalate, the Federal Reserve may have to adjust its rate path, depending on how tariffs affect inflation and growth.
USD/JPY has pushed below support at 147.26 and is testing support t 147.26. Next is support at 1.46.48
148.51 and 148.98 are the next resistance lines

Will the stock market turn positive again?!The index is trading below the EMA200 and EMA50 on the four-hour timeframe and is trading in its descending channel. If the index moves down towards the specified demand zone, we can look for further buying opportunities in Nasdaq. A break of the resistance range and the channel ceiling will also cause the Nasdaq to continue its short-term upward trend.
In February 2025, the U.S. labor market grew at a slower pace than anticipated. According to published data, non-farm employment increased by 151,000 jobs in January, while expectations were set at 160,000.This indicates that while job growth continues, its momentum has been weaker than projected.
The unemployment rate rose to 4.1% in February, slightly above the expected 4%. Meanwhile, labor force participation declined by 0.2 percentage points to 62.4%. Average hourly earnings increased by 0.3% during the month, aligning with forecasts. On an annual basis, wage growth reached 4%, slightly below the estimated 4.1%.
Among various sectors, the highest job gains were recorded in healthcare (52,000 jobs), finance (21,000 jobs), and local government (20,000 jobs). Employment also rose in construction, transportation, social assistance, and manufacturing.
Conversely, some industries experienced job losses. The hospitality sector shed 16,000 jobs, retail lost 6,000, and the federal government reduced employment by 10,000 positions. Additionally, temporary jobs declined by 12,000, signaling a potential slowdown in economic growth.
Overall, the report suggests that while the U.S. labor market remains stable, certain indicators, such as rising unemployment and a decline in full-time jobs, may point to a deceleration in economic expansion. Following the report’s release, the U.S. dollar weakened slightly, but the market reaction was muted due to prior concerns over a more significant decline.
Hassett, the White House economic advisor, stated that future reports are likely to show further reductions in government employment. He emphasized the administration’s plan to cut government jobs and spending while boosting employment in the manufacturing sector. He also confirmed that tariffs are inevitable, arguing that such measures will support the expected 3% to 4% economic growth. Hassett expressed doubt that President Trump would grant exemptions for steel tariffs.
As investors try to adjust to Trump’s evolving trade policies, the U.S. Consumer Price Index (CPI) report for February is set to be released on Wednesday. Given the recent Personal Consumption Expenditures (PCE) index data from January, it is possible that CPI could be entering a new downward trend.
The Federal Reserve’s battle against inflation remains challenging, and the recent rise in price pressures has undoubtedly been frustrating for policymakers. However, signs indicate that U.S. inflation may be shifting course, with expectations of a decline in the coming months.
One major uncertainty remains: tariffs. Trump’s decision to impose a 25% tariff on Canadian and Mexican imports and a 20% increase on Chinese goods, along with additional sector-specific and retaliatory tariffs still under discussion, could undermine the Fed’s efforts to bring inflation down to 2%.
In January, the overall CPI climbed to 3%, marking its highest level since June 2024. Core inflation also reached 3.3%. However, February’s data is expected to ease months of concern about inflationary resurgence, with projections indicating a decline in overall CPI to 2.9% and core inflation to 3.1%. Monthly estimates for both indices stand at 0.3%.
Later in the week, Thursday’s Producer Price Index (PPI) for February will provide further insights into inflationary pressures, while on Friday, investors will closely monitor the University of Michigan’s preliminary consumer sentiment survey for March. Last month’s survey raised alarms, as consumer inflation expectations climbed to their highest level in 30 years.

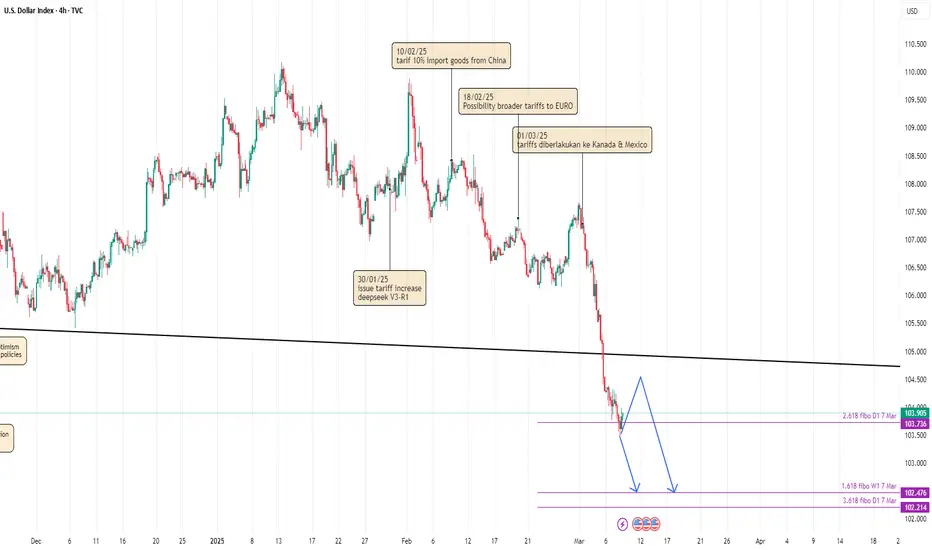
DOLLAR GAINS BUYER AMID NFP BAD DATA??Dollar seems on hold in it's 2.618 fibonacci support after NFP data released. Will it go higher next week?
I see dollar still waiting next data release. I mention JOLTS Job Opening & CPI which both of them crucial in current context of US macro-economy. Strong job opening & CPI means investor and retail trader must be no worries about US macro-economic despite concern about trade war. Otherwise, weak job opening & CPI means labor market and inflation continue cooling down. It will push THE FED to give clear path about their plan for future Interest Rate.
So, dollar could make sideways movement (or even gain buyer) but overall still in bearish momentum. Dollar still driven by concern of trade war and if job opening comes weaker than expected, it could gives more power to seller.
Nasdaq 100 drops below 20K after NFP, but could it rebound?The Nasdaq and S&P 500 were testing their weekly lows after what has been a bruising last few session. But with both indices testing their respective key support areas, could we see a recovery from around the current levels, especially in light of a weaker US jobs report?
Keep an eye on the area around 20,000 on the Nasdaq, where the Trump rally commenced back in November. It is a key psychological area for the market. Can we see a bounce, or will the selling continue as we head deeper into the US session?
At the time of writing, the index was below this level, but the session is not over yet. In any case, a confirmed reversal on the lower time frames should be observed by traders looking to potentially buy this dip. For example, if the index recovers to go bac above yesterday's low of 20180, that would be a bullish sign in my view. But right now it is looking quite bleak.
By Fawad Razaqzada, market analyst with FOREX.com

THE KOG REPORT - NFPTHE KOG REPORT – NFP
This is our view for NFP, please do your own research and analysis to make an informed decision on the markets. It is not recommended you try to trade the event if you have less than 6 months trading experience and have a trusted risk strategy in place. The markets are extremely volatile, and these events can cause aggressive swings in price.
Firstly, we would suggest traders stay away from this NFP altogether, the markets are very delicate and moving to extreme levels not only on Gold but most forex pairs. For that reason we’ll keep it simple and look at the key levels together with the structure formed.
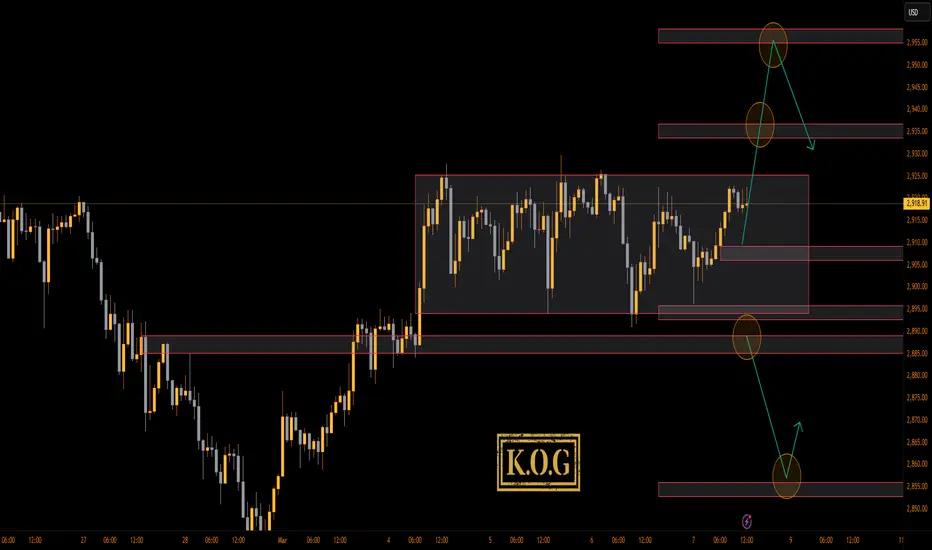
We have the higher resistance level here which is the previous order region 2930-35 which looks to be a potential region price may want to attack if they want to continue this move upside, above that is the extension of the move around 2945-55. Price needs to stay below this level, If we can reject and not break above these levels, an opportunity to see the market correct may be available back down in attempt to break 2900 level.
On the flip, if they push price downside, we’ll wait, the range needs to be broken, price should want to retest the flip and then continue the move, that’s when we can start using the red boxes to target those lower levels and potentially look for the swing low from the circled hotspot.
As above, keep it simple, the trade comes after the event and most accounts are blown during these events due to traders using large lots on small accounts attempting to capture the volume driven candles. Unless you’re already in and protected, the swing in the opposite direction can cause huge problems to less experienced traders.
RED BOXES:
Break above 2930 for 2934, 2940, 2944 and 2955 in extension of the move
Break below 2910 for 2903, 2895, 2890 and 2879 in extension of the move
Please do support us by hitting the like button, leaving a comment, and giving us a follow. We’ve been doing this for a long time now providing traders with in-depth free analysis on Gold, so your likes and comments are very much appreciated.
As always, trade safe.
KOG