Long Ern Usdt analysisOnce it'll break the resistance and make a new ATH in few weeks or coming days.
The update such as like mobile apps and etc soon be launch it.
Nft

NEW GAME COIN PUMP ON KUCOIN ~ GALA! Damn guys, really sorry I didn't post this one when I found it last week... GALA games is run by the founder of Zynga and is making blockchain-based games with NFT integration & ways to earn tokens.
Their token got added to Kucoin last month and I got hit up by a recruiter about a position there, which is actually how I found out about them in the first place.
Generally speaking, I'm bullish on NFT and Game tokens, especially if you can catch them early. With such a heavyweight founder and an active community on Discord, GALA is one to watch.
Hard to say what a good entry point is right now... I mostly exited my position at 130% gain and held onto some in case it moons. I will consider re entering once more price action gets printed.
happy trades,
CD


The Altcoin Market Made an All-Time High Monthly CloseThis is just a simple observation. Don't really have time to go too in-depth with this one, but this is a substantial deviation from the prior cycle. This time, it appears Ethereum and other altcoins are leading the market. This makes sense, since Ethereum has numerous applications and investment vehicles within its own ecosystem. Bubbles within bubbles. Even so, I think the cryptocurrency market is unlikely to withstand a prolonged Bitcoin downturn, unless everything moves to stablecoins. Even then, there probably wouldn't be enough liquidity for such an event. Stablecoins are likely to be further regulated as it is.
Anyway, for the month of April, TOTAL2 closed at $1.073 Trillion. It closed at $1.198 Trillion in August. This tells us that the majority of the space is still in a bull market (at least in terms of market capitalization). TOTAL2 also never closed below the 9 month EMA (orange), while Bitcoin closed below it in June.
We also cannot ignore the rise and application of stablecoins. TOTAL3 (the market cap minus both Bitcoin and Ethereum) also made an ATH monthly close.
I do think sentiment particularly in the altcoin market is very frothy. Despite this, the market can continue up, and the next move can be quite explosive. As they say, "the market can stay irrational longer than you can stay solvent." If we see something like that, with everything going up suddenly in rocket-style fashion, I think it's likely to end in a blowoff top (similar to 2017). TOTAL2 will not be in a bearish trend until the monthly trend reverses. Even in 2018, alts didn't really continue making monthly highs once Bitcoin topped.
Does this tell us that Bitcoin itself hasn't topped yet?
That's it! We'll see. Very interesting times. I'll write a more philosophical post soon, but for now back to my other work. Thank you for your support! This is not financial advice. This is meant for speculation and entertainment only.
-Victor Cobra

$Alpha BOOM BOOM🐱🏍🚀Alpha on the path to growth towards its true value.
My final target for this bull run is $23 for Alpha. But provided that he can present his products and projects on time.

LTCUSDT is testing the daily resistance 🦐LTCUSDT is testing the daily resistance above the weekly support. IF the price is going to have a breakout, According to Plancton's strategy (check our Academy ), we can set a nice order
–––––
Follow the Shrimp 🦐
Keep in mind.
🟣 Purple structure -> Monthly structure.
🔴 Red structure -> Weekly structure.
🔵 Blue structure -> Daily structure.
🟡 Yellow structure -> 4h structure.
⚫️ Black structure -> <4h structure.


ADA - LongSudden move from $2.40 to $2.75 prior to the SMART contracts launching on the 12th Sep
Is this a strong signal for price to move to $3.40 and $4 next?

$MBOX to 0.00028 SATI believe the bottom is in as it made a HH and HL in 4H charts.
My proposal is 0.00028 SAT as binance launchpad is 7 days to end.
Time frame: 1-2 weeks

psg to next level psg is planning to bring nft . if they able to bring nfts of players like messi, ramos , neymer then the whole level will be changed

$SAND retracement? I think that $SAND is potentially a good investment in case $BTC remains bullish scenario before huge correction.
- 1D RSI shows hidden bullish divergence
- We retraced about 40% from ATH price and I suppose at least one bounce back to those levels is possible, but I don't think that we'll make new ATH
- The price strongly stays in the middle of the pitchfork which at least suggests the continuous uptrend movement
But since we are forming a rising wedge in the 1h timeframe, my thoughts are that we are going to drop down to the trendline and penetrate it to collect Stop-Losses. So in case we don't fixate under the trendline, the uptrend movement is highly likely. In that case the perfect entrance point is around 0.64-0.69$.
Possible targets:
0.75 -> 0.88 -> 0.92 -> 0.95 -> 1.2
Stop-loss: 0.6-0.605
It is not a financial advice. Do your own research. These are just my personal opinions.
Good luck.

ETH - WE REPEATED THIS PATTERN IN 2017! | CRASH MAY NOT BE OVER!Analysis
Price action is following a similar pattern to 2017 where there was a hefty consolidation after an insane price surge
Price this year had surged to over $4000 in a short time frame which resulted in an over 60% crash to $1600
This crash was to the 61.8% fibonacci retracement, just as the previous 2017 cycle had crashed to
Following the 2017, mid-cycle crash, price formed an ascending triangle which lasted around 6 months before continuing the final surge to end the bull market
Similarities between current price action and 2017's price action leads me to believe that something similar may act here again
Price has already crashed after failing to print a new ATH as it couldn't break through this resistance
This may lead to further consolidation and ranging which could form some sort of ascending triangle like 2017
Price action in 2017 did the same as it failed to break past the previous ATH at that point and retraced to the 61.8% level
Thus, insinuating that we may crash further from here and all the way to the 61.8% local fibonacci level
Conclusion
Price action has largely followed the 2017 mid-cycle consolidation phase before resuming the bull market
As a result, this suggests that something similar may occur, but not guaranteed, meaning consolidation has yet to finish
Short Term: Price is expected to crash further to, at most, the 61.8% fibonacci level
Mid Term: Price is expected to consolidate in an ascending triangle like formation, winding before finally breaking the $4000 level and off to new ATH's
Long Term: Price is expected to resume the bull market to new all-time highs in the region of $10,000+

SAND Investment Analysis 07-09-2021 by TheSocialCryptoClubGood evening everyone!
We present an analysis on the SAND asset.
Fundamentals :
For those who don't know, SAND is a token related to the world of NFT Gaming and will be used to buy and sell items, land and more in the SandBox Game metaverse.
The gaming industry was one of the few that held up very well during the corona crisis, and the rise of play to earn games is totally changing the gaming paradigm around the world.
SandBox is a very interesting project, with a solid structure behind it, a populous universe of gamers, game makers and asset creators since before the project was launched.
As seen with Axie Infinity (AXS) this could be a great medium to long term investment opportunity.
The long term outlook remains always bullish even in view of the release of the game, of which many major players in the crypto world, for example Binance , ATARI , Square Enix , have already purchased multiple lots of land in order to create levels of the metaverse and consequently have a return linked to the amount of players who will play it.
Technical Analysis :
As we can see the token has suffered, like the rest of the sector, a steep decline due to the May dump.
Recovering thanks to the news on the game, we can see that a definite ascending channel was formed with the formation of a triangle that was broken towards new highs.
Currently we are in price discovery and it is not advisable to start an accumulation plan, but as visible from the volumetric profile, it is possible to identify a new POC in formation.
Below it there is a strong volumetric gap that could lead the price towards the retest at the base of the channel coinciding with the break out levels of the triangle.
If this does not hold we could return to the levels of the previous poc.
Also the CryptoFall indicator confirms that these levels are important for the price right in the area between 0.382 and 0.618.
This area could be interesting for a series of equidistant orders of small equal amount to make a well dosed accumulation plan on the depth of an eventual retracement.
Thanks for your attention and happy to support the TradingView community!

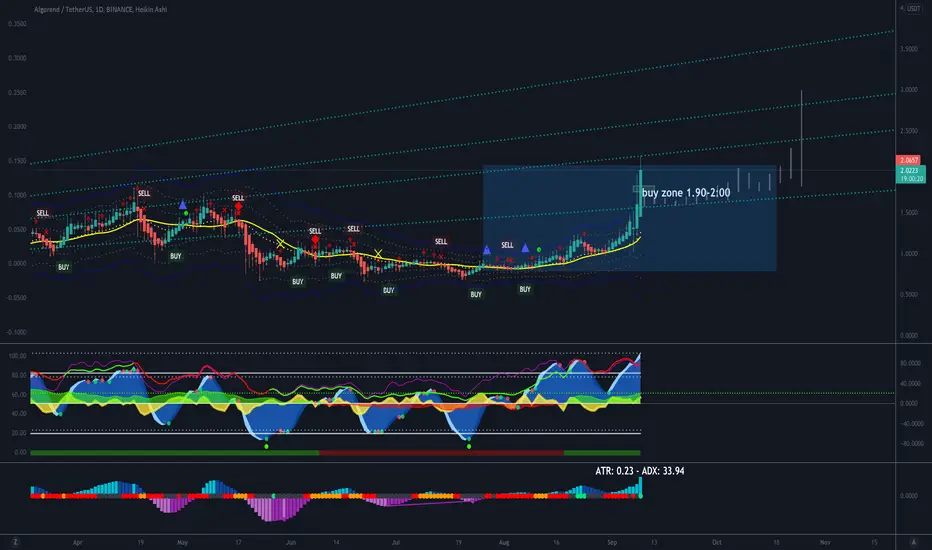
Algorand can hit previous all time high of 3.50 in the near termWith daily squeeze firing and if that in return drives firing of weekly squeezes we can see ALGO hitting 3.50 as my first PT. Buy the dip on all pull backs $2.00 and below.
algo huge cup and handelis it a huge cup and handel ? we had some huge news about nft in algo would it continue the pump for a huge move up in this market?
#algo
#algousdt

NFTUSDT Potential Bullish Move.Price break trendline. Nice buy structure. Awaiting to move to 261.8 fibonachi. Max at 4.236 extension of fibs.

ENJ will touch $5#ENJUSDT
$ENJ broke out from a strong resistance, it may continue its upward move from here or maybe make a correction move .
based on fib levels the min target is $3.2 and I think this powerful coin have potential to touch $5.3.

Why High Fees Are Good - Crypto and "Profitability"High gas fees of the Ethereum network have been getting a bad rap lately, but not everyone agrees that it's necessarily a bad thing.

SOLANA TO THE MOON!Greetings TradingView!
Breaking all time highs seems to be Solana's walk in the park. Up 142% since August 26th.
Solana has managed to outperform XRP, the second-biggest gainer within the top 10 in the last 24hrs.
This is mainly attributed to Solana being one of the fastest blockchains in the world and there is a growing interest in the the NFTs on the platform. Furthermore, its also a contending player in the DeFi space.
Happy Trading!
ALTUS

An Eco-System Is BornI have been long awaiting the launch of Efinity
I can't attest to what will happen with price action in the short term, but long term ENJIN and its surrounding ecosystems are posed to take over the NFT and Gaming crypto space.
Do your own due diligence and research into what ENJIN is building here with launch of Efinity and Jumpnet.
Small piece of information pulled from the Efinity whitepaper:
"The Enjin JumpNet blockchain allows users to execute transactions for free. In order to offer this, JumpNet imposes a series of limits against each address on the network.
By holding EFI on JumpNet (referred to as "JEFI"), users will be able to increase their JumpNet transaction limits. For every 100 JEFI* a user holds on JumpNet, their limits will be doubled (up to designated limits)."
ENJIN chart linked below in related ideas.
As Always,
Good Luck And Safe Trading.

THETAUSDT Trend Line breaks!THETAUSDT (DAY CHART) Technical Analysis Update
Trend line Breakout
THETA/USDT currently trading at $7.98
Buy-level: Above 7.90
Stop loss: $5.90
Target 1: $9.00
Target 2: $10.5
Target 3: $13.00
target 4: $15.30
Max Leverage: 2X or buy it on spot
ALWAYS KEEP STOP LOSS...

Catch the Explosion Before Others Find itCHZ is set for the Mother of all Rallies. If you have not been watching, now is the time. Institutions are mopping it up like crazy! #NFT season

