NATGAS Free Signal! Buy!
Hello,Traders!
NATGAS went down and
Almost reached the horizontal
Support of 3.014$ from where
We can enter a long trade
With the Take Profit of 3.066$
And the Stop Loss of 2.981$
Buy!
Comment and subscribe to help us grow!
Check out other forecasts below too!
Disclosure: I am part of Trade Nation's Influencer program and receive a monthly fee for using their TradingView charts in my analysis.
Ng1!f

Natural Gas | Oil | Dollar | Silver | Gold Price Forecast.Natural Gas | Oil | Dollar | Silver | Gold Price Forecast.
NYMEX:NG1! AMEX:UNG NYMEX:CL1! COMEX:GC1!

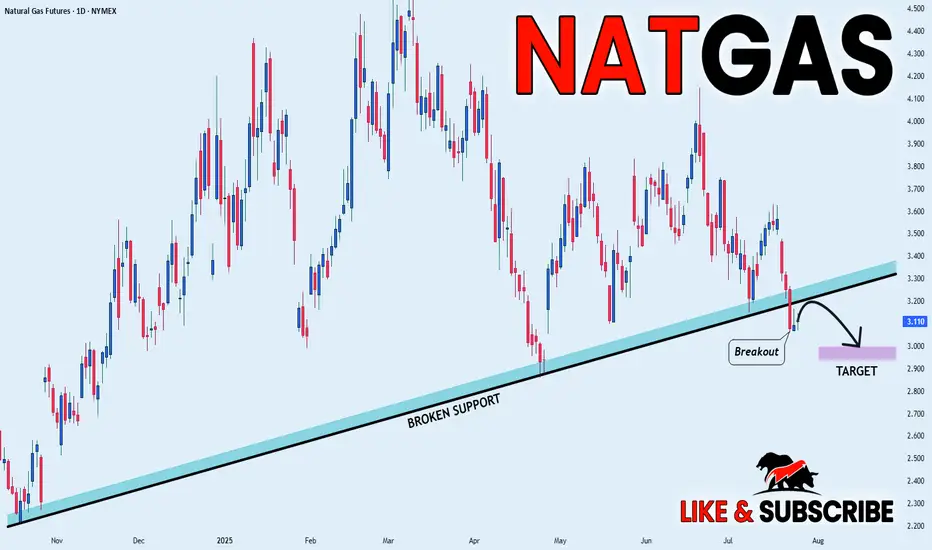
NATGAS BEARISH BREAKOUT|SHORT|
✅NATGAS broke the rising support
While trading in an local downtrend
Which makes me bearish
And I think that after the retest of the broken line is complete
A rebound and bearish continuation will follow
SHORT🔥
✅Like and subscribe to never miss a new idea!✅
Disclosure: I am part of Trade Nation's Influencer program and receive a monthly fee for using their TradingView charts in my analysis.
NG1! BEST PLACE TO BUY FROM|LONG
NG1! SIGNAL
Trade Direction: long
Entry Level: 3.111
Target Level: 3.357
Stop Loss: 2.946
RISK PROFILE
Risk level: medium
Suggested risk: 1%
Timeframe: 1D
Disclosure: I am part of Trade Nation's Influencer program and receive a monthly fee for using their TradingView charts in my analysis.
✅LIKE AND COMMENT MY IDEAS✅

NG1!: Target Is Up! Long!
My dear friends,
Today we will analyse NG1! together☺️
The price is near a wide key level
and the pair is approaching a significant decision level of 3.087 Therefore, a strong bullish reaction here could determine the next move up.We will watch for a confirmation candle, and then target the next key level of 3.107.Recommend Stop-loss is beyond the current level.
❤️Sending you lots of Love and Hugs❤️

NATGAS Support Ahead! Buy!
Hello,Traders!
NATGAS keeps falling but
A strong horizontal support
Level is ahead at 3.00$ so
After Gas retests the support
We will be expecting a local
Bullish rebound
Buy!
Comment and subscribe to help us grow!
Check out other forecasts below too!
Disclosure: I am part of Trade Nation's Influencer program and receive a monthly fee for using their TradingView charts in my analysis.

"NATURAL GAS PRICE THEFT IN PROGRESS – JOIN THE HEIST!"🔥 XNG/USD HEIST – BEARISH LOOT AWAITS! SWIPE & ESCAPE BEFORE THE COPS ARRIVE! 🔥
🌍 Greetings, Fellow Market Robbers! (Hola! Oi! Bonjour! Hallo! Marhaba!) 🚔💸
🚨 Mission Briefing:
Based on 🔥Thief Trading Intelligence™🔥, we’ve identified a prime robbery opportunity in the XNG/USD (Natural Gas) Energy Market. Our Bearish Heist Plan is locked & loaded—long entries are a trap, and the real loot lies in the downside escape.
🎯 Heist Strategy:
Entry (Swipe the Loot!) 🏦
"The vault is cracked! Bears are distracted—time to steal!"
Sell Limit Orders preferred (15m-30m pullback entries).
DCA/Layering Strategy for maximum loot efficiency.
Stop Loss (Escape Route) 🚨
SL at nearest swing high (4H basis) – 3.480 (Day/Swing Trade)
Adjust based on risk tolerance, lot size, & number of orders.
Target (Police Evasion Zone) 🎯 2.900 (or earlier if cops close in!)
🔪 Scalpers’ Quick Heist:
Short-side scalp ONLY!
Big money? Go direct. Small stack? Join the swing robbers.
Trailing SL = Your Getaway Car! 🚗💨
⚡ Why This Heist? (Bearish Forces at Play)
Fundamentals: Oversupply, weak demand, storage glut.
Technicals: Overbought, trend exhaustion, reversal signals.
Sentiment: Bulls are overconfident—perfect trap setup!
📰 Breaking News Alert (Stay Sharp!)
High-impact news = Volatility spikes!
Avoid new trades during releases.
Trailing SL = Your Shield. (Lock profits before the cops raid!)
💥 BOOST THIS HEIST!
👉 Hit LIKE & FOLLOW to fuel our next robbery! More loot = More strategies! 🚀💰
⚠️ WARNING (Legal Escape Plan):
Not financial advice!
Your risk, your loot.
Markets change—adapt or get caught!
🤑 NEXT HEIST COMING SOON… STAY TUNED, ROBBERS! 🐱👤🔥

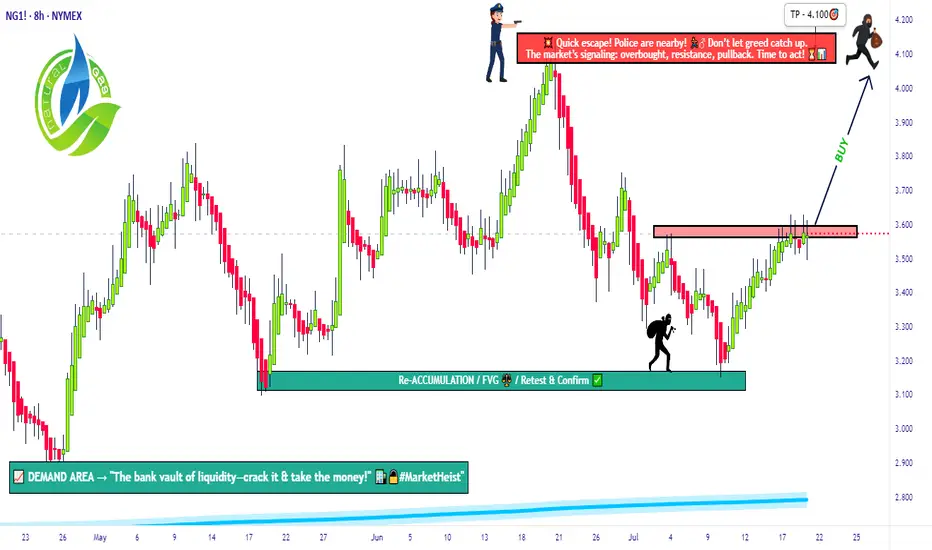
The Great Gas Heist: Load Your Longs Before It Blows💎🚨“Operation Gas Vault: NG1! Breakout Robbery Blueprint”🚨💎
🌟Hi! Hola! Ola! Bonjour! Hallo! Marhaba!🌟
Welcome to all my Market Hustlers & Silent Robbers 🕵️♂️💼💰
Today’s target: NG1! Henry Hub Natural Gas Futures
📍Strategy: A bullish heist mission with a calculated escape plan.
🔥Thief Trading Blueprint: Gas Market Heist🔥
🎯 Entry Gameplan
“The vault cracks open at 3.630 – That’s your cue.”
Wait for resistance breakout 🧱 (around 3.630) – that’s the signal.
Set Buy Stop orders above the Moving Average.
Or, use a layered DCA entry via Limit Orders near swing highs/lows (15m or 30m timeframe).
Thief Tip: Set an alert/alarm so you don’t miss the breakout bang 🔔💥
🛡 Stop Loss Setup (Post-Breakout Only!)
“Don’t be reckless. No SL before breakout — wait for confirmation.”
SL Location: Swing low (4H) near 3.370.
Set SL after breakout happens, not before.
Adjust based on your risk tolerance, lot size & number of open entries.
⚠️ Placing early SL = triggering the trap before the door opens.
🏴☠️ Loot Target 🎯
Take Profit Zone: 4.100
Escape Tip: No need to be greedy. Take profit before the police arrive (resistance)!
🧲 Scalper’s Shortcut
Only go Long – avoid fighting the current.
If you’ve got cash flow, strike early. If not, ride with the swing crew.
Use trailing SL to protect your stack 💼📉
📊 Fundamental Clues Behind the Heist
The gas vault is heating up thanks to:
🔥COT Reports
🛢 Inventory & Storage data
📈 Seasonal trends
💹 Sentiment flows
⚖ Intermarket linkages
Checkk your own global indicators 🌍🔗 – don’t enter blindfolded.
🗞️ News Traps & Position Protection
Avoid new entries during major news releases 📰🚫
Trail stops to guard running positions
Markets react fast. Adapt even faster.
⚠️ Disclaimer: This is educational info, not personal investment advice. Your money, your risk, your decisions.
💥 Support the Robbery Squad 💥
If you vibe with the Thief Trading Style, smash that Boost Button 💖
Grow the gang, expand the vaults, and master this money maze together! 🤑🏆🚀
Stay tuned – another heist plan is on the way.
Until then, trade smart, trade sharp. 👊🕶💼
🔒#NaturalGas #ThiefTrading #BreakoutStrategy #SwingTrade #FuturesHeist #NG1Plan #RobTheMarket
NATGAS Trading Opportunity! SELL!
My dear followers,
This is my opinion on the NATGAS next move:
The asset is approaching an important pivot point 3.567
Bias - Bearish
Technical Indicators: Supper Trend generates a clear short signal while Pivot Point HL is currently determining the overall Bearish trend of the market.
Goal - 3.480
About Used Indicators:
For more efficient signals, super-trend is used in combination with other indicators like Pivot Points.
Disclosure: I am part of Trade Nation's Influencer program and receive a monthly fee for using their TradingView charts in my analysis.
———————————
WISH YOU ALL LUCK
NG1! BEARS ARE GAINING STRENGTH|SHORT
NG1! SIGNAL
Trade Direction: short
Entry Level: 3.737
Target Level: 3.205
Stop Loss: 4.089
RISK PROFILE
Risk level: medium
Suggested risk: 1%
Timeframe: 1D
Disclosure: I am part of Trade Nation's Influencer program and receive a monthly fee for using their TradingView charts in my analysis.
✅LIKE AND COMMENT MY IDEAS✅

Natural Gas | Oil | Dollar | Silver | Gold Price Forecast.Natural Gas | Oil | Dollar | Silver | Gold Price Forecast.
NYMEX:NG1! AMEX:UNG NYMEX:CL1! COMEX:GC1!

NATGAS REBOUND AHEAD|LONG|
✅NATGAS is going up now
And the price made a bullish
Rebound from the horizontal
Support level around 3.50$
So we are bullish biased and
We will be expecting a
Further bullish move up
LONG🚀
✅Like and subscribe to never miss a new idea!✅
Disclosure: I am part of Trade Nation's Influencer program and receive a monthly fee for using their TradingView charts in my analysis.
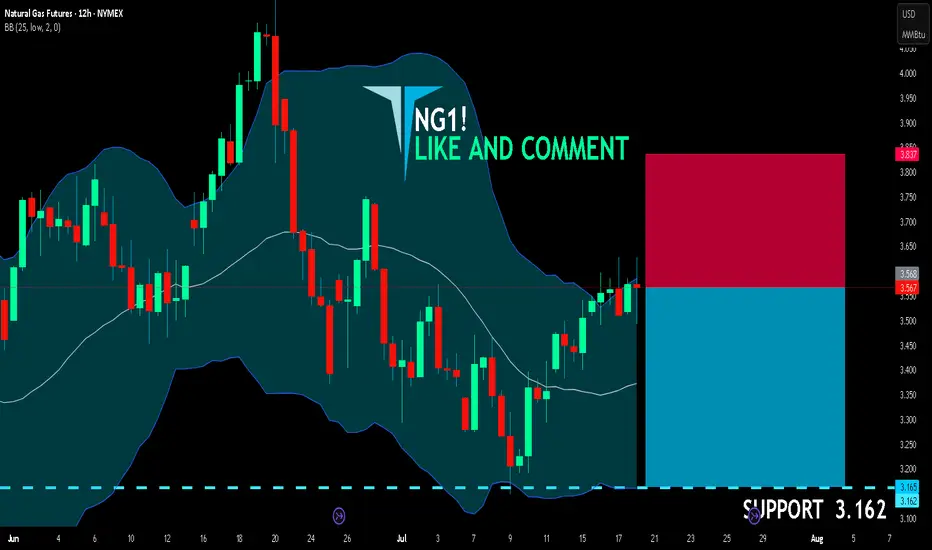
NG1! BEARS ARE STRONG HERE|SHORT
NG1! SIGNAL
Trade Direction: short
Entry Level: 3.568
Target Level: 3.162
Stop Loss: 3.837
RISK PROFILE
Risk level: medium
Suggested risk: 1%
Timeframe: 12h
Disclosure: I am part of Trade Nation's Influencer program and receive a monthly fee for using their TradingView charts in my analysis.
✅LIKE AND COMMENT MY IDEAS✅
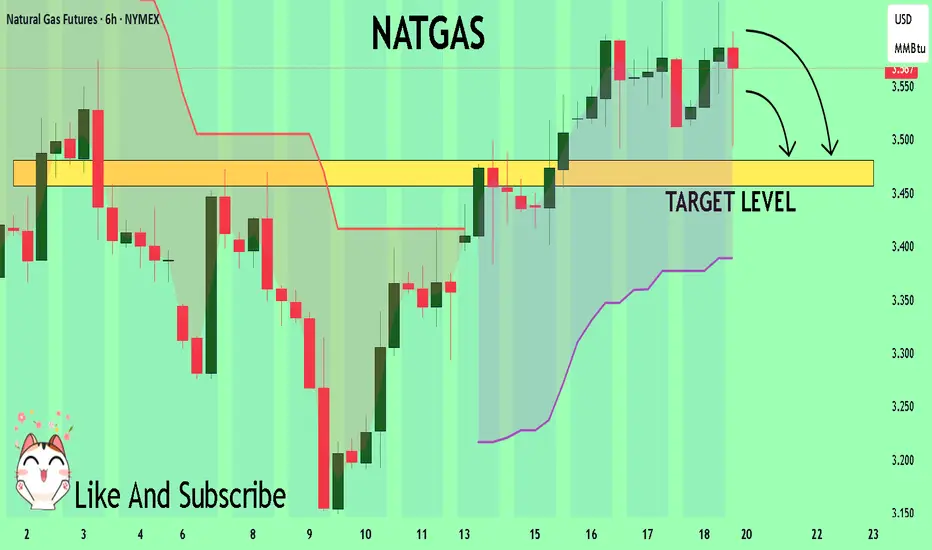
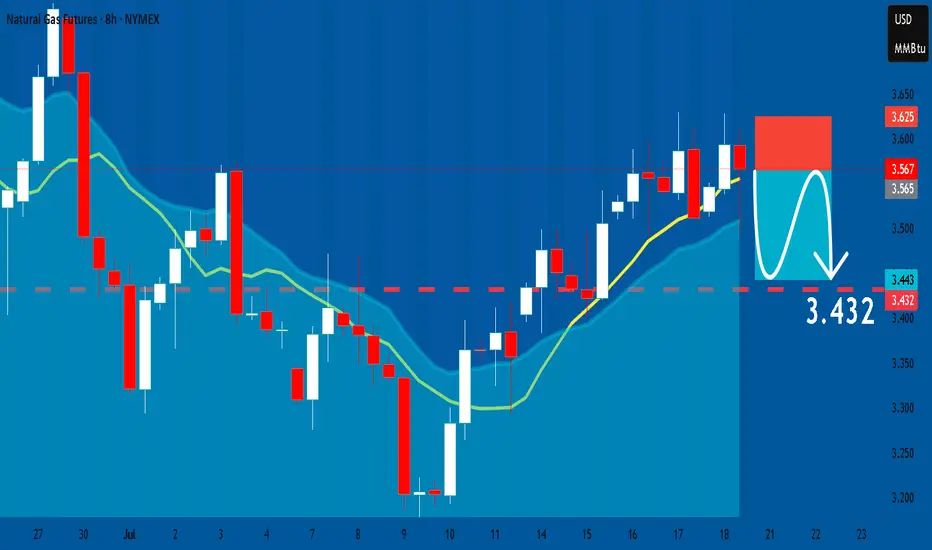
NATGAS: Bearish Continuation & Short Signal
NATGAS
- Classic bearish formation
- Our team expects fall
SUGGESTED TRADE:
Swing Trade
Sell NATGAS
Entry Level - 3.567
Sl - 3.625
Tp - 3.432
Our Risk - 1%
Start protection of your profits from lower levels
Disclosure: I am part of Trade Nation's Influencer program and receive a monthly fee for using their TradingView charts in my analysis.
❤️ Please, support our work with like & comment! ❤️
Gold | Oil | Dollar | Silver | Natural Gas July 2025 Forecast.Gold | Oil | Dollar | Silver | Natural Gas July 2025 Forecast.
NYMEX:NG1! COMEX:GC1! COMEX:SI1! NYMEX:CL1!

NG1! SHORT FROM RESISTANCE
NG1! SIGNAL
Trade Direction: short
Entry Level: 3.356
Target Level: 3.150
Stop Loss: 3.493
RISK PROFILE
Risk level: medium
Suggested risk: 1%
Timeframe: 2h
Disclosure: I am part of Trade Nation's Influencer program and receive a monthly fee for using their TradingView charts in my analysis.
✅LIKE AND COMMENT MY IDEAS✅

NG1!: Strong Growth Ahead! Long!
My dear friends,
Today we will analyse NG1! together☺️
The price is near a wide key level
and the pair is approaching a significant decision level of 3.377 Therefore, a strong bullish reaction here could determine the next move up.We will watch for a confirmation candle, and then target the next key level of 3.408.Recommend Stop-loss is beyond the current level.
❤️Sending you lots of Love and Hugs❤️

NATURAL GAS Best buy opportunity of the Channel Up.Natural Gas (NG1!) touched yesterday the bottom (Higher Lows trend-line) of the 1.5-year Channel Up, marginally below the 1D MA200 (orange trend-line) and is reacting so far today with a bullish tone.
If this evolves in a full-scale rebound, then technically it will be the pattern's new Bullish Leg. The previous one rose by +161.12% and a repeat of that will take this Leg back to the top of the Channel Up.
Our Target is marginally below that mark, on the 2.5 Fibonacci extension level at 6.800.
-------------------------------------------------------------------------------
** Please LIKE 👍, FOLLOW ✅, SHARE 🙌 and COMMENT ✍ if you enjoy this idea! Also share your ideas and charts in the comments section below! This is best way to keep it relevant, support us, keep the content here free and allow the idea to reach as many people as possible. **
-------------------------------------------------------------------------------
💸💸💸💸💸💸
👇 👇 👇 👇 👇 👇

NATGAS Support Ahead! Buy!
Hello,Traders!
NATGAS keeps falling but
The price will soon hit a
Horizontal support of 2.90$
From where we will be expecting
A local bullish rebound
Buy!
Comment and subscribe to help us grow!
Check out other forecasts below too!
Disclosure: I am part of Trade Nation's Influencer program and receive a monthly fee for using their TradingView charts in my analysis.

Operation Gas Leak: Bearish Swing in XNG/USD🧨XNG/USD Energy Vault Playbook: Natural Gas Power Grab!⚡💸
🌟Hi! Hola! Ola! Bonjour! Hallo! Marhaba!🌟
Dear Market Raiders & Strategy Hustlers 🕵️♂️📊💼
Welcome to the 🔥Thief Trader Energy Strategy🔥 for XNG/USD (Natural Gas) – our tactical plan for smart intraday & swing moves based on technical, fundamental, and sentiment fusion.
💼This setup focuses on short-side scalps & swing entries, with a target to lock profits around the high-risk Green Zone before the market guards show up. Resistance zones are hot – expect consolidation, pressure buildup, and possible shakeouts.
🔑 Entry:
📍Plan smart pullback entries on 15–30 min TF near swing high/low zones.
🎯“The vault is open”—watch the market for weak bounces or fakeouts to ride the move.
🛡️ Stop Loss:
📌Primary SL is the most recent swing high on the 4H (around 3.600)
🔧Adjust based on risk tolerance, lot sizing, and how deep your stack of trades runs.
💥 Target:
🎯 Aim for 3.200 – a clean technical pivot where past price action has shown tension. Perfect spot to secure the bag.
🧲 Scalping Strategy:
🦅Short bias only. Stay light, stay fast. Use trailing SLs and don’t overstay your welcome. Let the swing crew do the heavy lifting.
🔍Market Narrative:
📉 Currently biased bearish, Natural Gas is facing pressure from:
Macro fundamentals
Seasonal distortions
Inventory & storage levels
COT report & Sentiment
Intermarket signals
📊Stay aware of news events – they’re known to rattle price structures. Set trailing SLs and manage your exposure wisely.
💬Final Words from the Thief Playbook:
💣Boost your strategy, not your stress. Let’s outsmart the market makers with sharp entries, sniper exits, and disciplined risk. 🚀
🔥💖Smash that LIKE if you vibe with this Energy Heist Plan. More tactical drops coming soon, so stay alert! 🧠📈🐱👤

Gold | Oil | Dollar | Silver | Natural Gas July 2025 Forecast.July 2025 Forecast.
Gold | Oil | Dollar | Silver | Natural Gas
NYMEX:NG1! COMEX:GC1! COMEX:SI1! AMEX:UNG

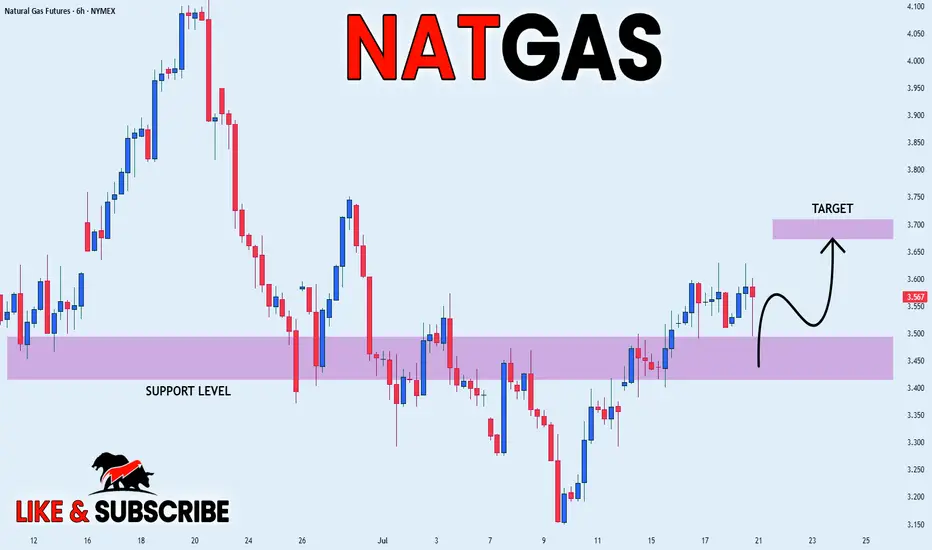
NG1! SENDS CLEAR BULLISH SIGNALS|LONG
NG1! SIGNAL
Trade Direction: long
Entry Level: 3.387
Target Level: 3.635
Stop Loss: 3.222
RISK PROFILE
Risk level: medium
Suggested risk: 1%
Timeframe: 9h
Disclosure: I am part of Trade Nation's Influencer program and receive a monthly fee for using their TradingView charts in my analysis.
✅LIKE AND COMMENT MY IDEAS✅

NG1!: Move Up Expected! Long!
My dear friends,
Today we will analyse NG1! together☺️
The price is near a wide key level
and the pair is approaching a significant decision level of 3.403 Therefore, a strong bullish reaction here could determine the next move up.We will watch for a confirmation candle, and then target the next key level of 3.429.Recommend Stop-loss is beyond the current level.
❤️Sending you lots of Love and Hugs❤️
