NATGAS: Bears Will Push Lower
Remember that we can not, and should not impose our will on the market but rather listen to its whims and make profit by following it. And thus shall be done today on the NATGAS pair which is likely to be pushed down by the bears so we will sell!
❤️ Please, support our work with like & comment! ❤️
Ng1

NATGAS The Target Is DOWN! SELL!
My dear subscribers,
NATGAS looks like it will make a good move, and here are the details:
The market is trading on 2.719 pivot level.
Bias - Bearish
Technical Indicators: Both Super Trend & Pivot HL indicate a highly probable Bearish continuation.
Target - 2.604
About Used Indicators:
The average true range ATR plays an important role in 'Supertrend' as the indicator uses ATR to calculate its value. The ATR indicator signals the degree of price volatility.
———————————
WISH YOU ALL LUCK

Bullish Outlook: UNG Prices Surge Amidst Anticipation of Record In the wake of widespread winter weather last week, the volatile natural gas futures front month, specifically the expiring February contracts for UNG, are witnessing a robust uptick.
Traders are eagerly anticipating a potentially record-breaking storage withdrawal, adding fuel to the bullish sentiment.
The market's sharp rebound in early trading on Thursday reflects the optimism surrounding the impending storage pull, setting the stage for a significant uptrend in UNG prices.
Investors are closely monitoring the situation, poised for potential gains in the midst of evolving market dynamics.

✅NATGAS BUYING OPPORTUNITY|LONG🚀
✅NATGAS gapped down and
Then went even further down
So the commodity is locally
Oversold and as the horizontal
Support of 2.250 is ahead
I will be expecting a
Local bullish correction
LONG🚀
✅Like and subscribe to never miss a new idea!✅

NATGAS The Target Is UP! BUY!
My dear subscribers,
My technical analysis for NATGAS is below:
The price is coiling around a solid key level - 2.519
Bias - Bullish
Technical Indicators: Pivot Points Low anticipates a potential price reversal.
Super trend shows a clear buy, giving a perfect indicators' convergence.
Goal - 2.869
About Used Indicators:
By the very nature of the supertrend indicator, it offers firm support and resistance levels for traders to enter and exit trades. Additionally, it also provides signals for setting stop losses
———————————
WISH YOU ALL LUCK

NATGAS: Bullish Continuation & Long Signal
NATGAS
- Classic bullish formation
- Our team expects growth
SUGGESTED TRADE:
Swing Trade
Buy NATGAS
Entry Level - 2.519
Sl - 2.356
Tp - 2.926
Our Risk - 1%
Start protection of your profits from lower levels
❤️ Please, support our work with like & comment! ❤️

Natural Gas at historically significant levels. All in the video. I'm collecting Nat gas near these levels and I explain why in the video - I hope it's helpful - good luck!

NG is a buy with S/L 2.69Entry Price: Enter the trade at the current market price of 2.80.
Stop Loss: Place a stop-loss order at 2.69, which is slightly below the recent support level. This will limit your potential losses if the price of NG falls unexpectedly.
Target Prices: Take partial profits at the first target price of 3.00 and consider trailing the stop-loss to lock in profits. The second target price of 3.20 can be used as an exit point for the remaining position.

Natural Gas Probes Support. Is One More Feb '24 Bounce Possible?The US Natural Gas Fun (UNG) paces for its third-worst single-session performance in the ETF's 17-year history as of this writing. Tuesday afternoon weather model runs did the prompt-month of natural gas no favors, and the February contract has plunged all the way back under $3 after poking above $3.30 late last week. The current record-shattering polar snap will prove to be short-lived for the CONUS. A mild forecast in both the NOAA 6-10 day and 8-14 day outlooks are bearish for the energy-dependent commodity.
This is the most volatile time of the year for nat gas, and the infamous “widowmaker” trade (the March/April spread) looms. For now, though, I see support on the chart in a broad range. Notice in my featured chart this week that $2.80 to $3.00 has historically been a battleground between the bulls and bears. What’s more, natty is now testing its 38.2% retracement from the December low to the January high, offering potential support.
The trade here, in my view, is long with a stop under $2.80 on the prompt month. We will have a contract roll later this month to the much cheaper March contract (currently about 45 cents less expensive than Feb). So, we will get a natural gap down once the roll takes place. Thus, the duration of this idea is through January 26.

NATGAS Trading Opportunity! SELL!
My dear followers,
I analysed this chart on NATGAS and concluded the following:
The market is trading on 3.331 pivot level.
Bias - Bearish
Technical Indicators: Both Super Trend & Pivot HL indicate a highly probable Bearish continuation.
Target - 3.061
About Used Indicators:
A super-trend indicator is plotted on either above or below the closing price to signal a buy or sell. The indicator changes color, based on whether or not you should be buying. If the super-trend indicator moves below the closing price, the indicator turns green, and it signals an entry point or points to buy.
———————————
WISH YOU ALL LUCK

NATGAS: Expecting Bearish Movement! Here is Why:
Looking at the chart of NATGAS right now we are seeing some interesting price action on the lower timeframes. Thus a local move down seems to be quite likely.
❤️ Please, support our work with like & comment! ❤️

NATURAL GAS Long-term High has been made. SELL.Natural Gas (NG1!) is having a strong bearish reversal since the January 09 High, which on this 1D time-frame can be identified as a Lower High on a 3-month Channel Down pattern. On top of that, the 1D RSI got overbought above 70.00 and is correcting.
This appears to be the new Bearish Leg of the Channel Down and we expect it to last around 1 month. Our Target is a new Lower Low on Support 2 at 2.135.
-------------------------------------------------------------------------------
** Please LIKE 👍, FOLLOW ✅, SHARE 🙌 and COMMENT ✍ if you enjoy this idea! Also share your ideas and charts in the comments section below! This is best way to keep it relevant, support us, keep the content here free and allow the idea to reach as many people as possible. **
-------------------------------------------------------------------------------
💸💸💸💸💸💸
👇 👇 👇 👇 👇 👇
✅NATGAS SHORT FROM RESISTANCE🔥
✅NATGAS is set to retest a
Strong resistance level above at 3.00$
After trading in a local uptrend for some time
Which makes a bearish pullback a likely scenario
With the target being a local support below at 2.836$
SHORT🔥
✅Like and subscribe to never miss a new idea!✅

NATGAS: Short Trade with Entry/SL/TP
NATGAS
- Classic bearish pattern
- Our team expects retracement
SUGGESTED TRADE:
Swing Trade
Sell NATGAS
Entry - 2.906
Stop - 3.004
Take - 2.696
Our Risk - 1%
Start protection of your profits from lower levels
❤️ Please, support our work with like & comment! ❤️

NG1! Bullish WeeklyNatural Gas has been consolidating for almost a year now at an 886 fib retracement, considered deep value. The week of December 11th ran all local lows going back to June 2023 and had the highest volume in 3 years. Could be putting in a bottom here?

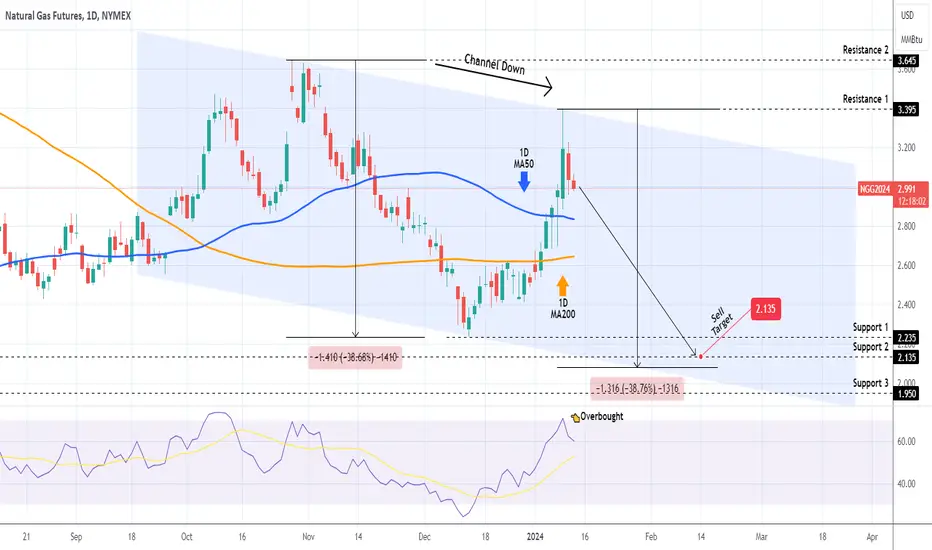
NATURAL GAS Strong sell on the 1D MA50.Natural Gas has been so far following the sell strategy we shared with you a month ago (December 04, see chart below), having already hit one Target (2.425):
Yesterday the price hit the 1D MA50 (blue trend-line) and managed to close the 1D candle below it, which stands out as the most efficient sell opportunity since the October 27 2023 High. Technically we can see a new Channel Down emerging with two Lower Lows and two Lower Highs already. Our long-term 2.135 Target on Support 2 remains, but technically the downside can be considerably bigger (-38.67% was the previous Bearish Leg).
If the price breaks above Resistance 1 (2.990), we will take an additional short-term buy, targeting 3.275 (Resistance 2).
-------------------------------------------------------------------------------
** Please LIKE 👍, FOLLOW ✅, SHARE 🙌 and COMMENT ✍ if you enjoy this idea! Also share your ideas and charts in the comments section below! This is best way to keep it relevant, support us, keep the content here free and allow the idea to reach as many people as possible. **
-------------------------------------------------------------------------------
💸💸💸💸💸💸
👇 👇 👇 👇 👇 👇

Natural Gas - Elliott Wave CountNatural Gas - Elliott Wave Count
Natural Gas - the market seems to be forming ending diagonal on C of Wave 4 and we can see a decline to wave 5 soon.
Please note that this information is solely for educational purposes, and it is essential to exercise caution when trading
CAPITALCOM:NATURALGAS AMEX:UNG MCX:NATURALGAS1! PEPPERSTONE:NATGAS MOEX:NG1! FXOPEN:XNGUSD FOREXCOM:NATURALGASCFD

Naturalgas - Elliott Wave CountNaturalgas - Elliott Wave Count
Naturalgas - the market looks like in Triangle B and after the correction up to 2.34 or below level we can see a good pullback towards 2.78 range.
Please note that this information is solely for educational purposes, and it is essential to exercise caution when trading
MOEX:NG1! MCX:NATURALGAS1! CAPITALCOM:NATURALGAS FOREXCOM:NATURALGASCFD FOREXCOM:NATURALGASCFD CITYINDEX:NATURALGASCFD

Natural gas longterm upsideNatural gas ling term upside. Alredy broke resistance..as per fibo my target is 3.1..

NATGAS Bullish Breakout! Buy!
Hello,Traders!
NATGAS is going up now
And we are seeing a
Bullish breakout of the
Key horizontal level
Of 2.486 and the breakout
Is confirmed so I think
That we will see a further
Move up after the market opens
Buy!
Like, comment and subscribe to help us grow!
Check out other forecasts below too!

NATGAS: Growth & Bullish Forecast
The analysis of the EURUSD chart clearly shows us that the pair is finally about to go up due to the rising pressure from the buyers.
❤️ Please, support our work with like & comment! ❤️

NATGAS Will Collapse! SELL!
My dear followers,
This is my opinion on the NATGAS next move:
The asset is approaching an important pivot point 2.469
Bias - Bearish
Technical Indicators: Supper Trend generates a clear short signal while Pivot Point HL is currently determining the overall Bearish trend of the market.
Goal - 2.385
About Used Indicators:
For more efficient signals, super-trend is used in combination with other indicators like Pivot Points.
———————————
WISH YOU ALL LUCK

NATGAS Local Short! Sell!
Hello,Traders!
NATGAS went up from the
Local lows but will soon
Retest the falling resistance
Line from where I think
We are likely to see
A bearish move down
Sell!
Like, comment and subscribe to help us grow!
Check out other forecasts below too!
