NatGas UpdateI believe the leading diagonal wave (a) has ended, and we are now in wave (b), which can take various forms (including the possibility that it has already ended). I suggested a few possible paths.
Once there is a pattern or a mature wave count in wave (b), I can make an assumption when exactly the next leg up will occur.
Ng1

NatGas UpdateA quick update here.
✔️ More faith in the upward trend.
🌫️ The near-term forecast for the next few days is a bit uncertain since there are various ways to read the expanding diagonal.

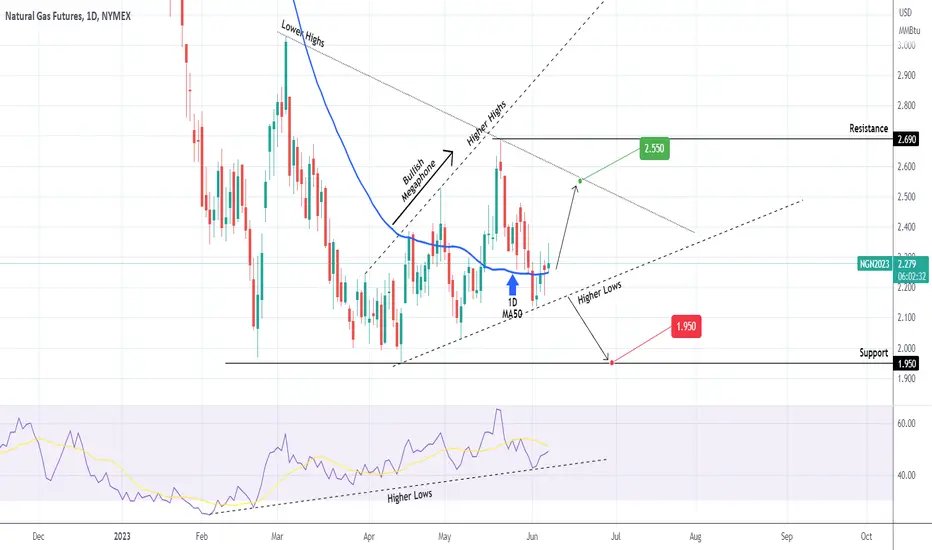
NATURAL GAS Buy signal unless this Higher Lows line breaks.Natural Gas (NG1!) is trading inside a Bullish Megaphone that has just priced its new Higher Low. The price is above the 1D MA50 (blue trend-line) and has started the new leg to a Higher High. Before that however, it has several Resistance levels to overcome, namely the 2.690 Resistance and before that the Lower Highs trend-line. As a result we are buyers but set a target below that level at 2.550. If instead the price closes a 1D candle below the bottom (Higher Lows trend-line) of the Megaphone, we will sell and target the 1.950 Support.
It is worth mentioning the 1D RSI that has been trading on Higher Lows since February 03, an early Bullish Divergence signal against the downtrend's Lower Lows for the price. This momentum continues to favor buying on the medium-term.
-------------------------------------------------------------------------------
** Please LIKE 👍, FOLLOW ✅, SHARE 🙌 and COMMENT ✍ if you enjoy this idea! Also share your ideas and charts in the comments section below! **
-------------------------------------------------------------------------------
💸💸💸💸💸💸
👇 👇 👇 👇 👇 👇
NATGAS BOIL NG Bottoming formation.Natural gas has been basing for a few months now in what has become a very recognizable Wyckoff accumulation pattern. Complete with high volume on the start to low volume towards the end. Breakouts occur on LOW VOLUME in accumulation phases so don't look for volume to give a clue. Just like the AMEX:SPY and NASDAQ:QQQ markets did at the October bottoms. Remember everyone saying how low the volume was? Yes, same here. We also see a very recognizable MEGAPHONE BOTTOM specifically on BOIL. This is regarded as a bullish signal showing that the existing downtrend may reverse to start a new UPTREND. Further, we see evidence in arcs of a possible bottom. EW counts also suggest the bottom is in for now.

NatGas Update I'm keeping an eye out for a potential leading diagonal. For rigour, I should also include the possibility of expanded diagonal (pale red), which is thought to be unusual but extremely uncomfortable if realized, sowing doubt and despair.

NatGas UNG Detail Trade Plan With Support & Resistance Levels- UNG falling wedge still intact
- potential lacking follow through on the bears on Friday
- Natural Gas needs to confirm 1h uptrend as their very first step

NG1! Expected Growth! BUY!
My dear friends,
NG1! looks like it will make a good move, and here are the details:
The asset is approaching an important pivot point 2.228
Bias - Bullish
Technical Indicators: Pivot Points Low anticipates a potential price reversal.
Super trend shows a clear buy, giving a perfect indicators' convergence.
Goal - 2.366
About Used Indicators:
Super-trend indicator is more useful in trending markets where there are clear uptrends and downtrends in price.
———————————
WISH YOU ALL LUCK

NG1!: Long Signal Explained
NG1!
- Classic bullish pattern
- Our team expects growth
SUGGESTED TRADE:
Swing Trade
Long NG1!
Entry - 2.171
Sl - 2.081
Tp - 2.306
Our Risk - 1%
❤️ Please, support our work with like & comment! ❤️

NG1! LONG FROM SUPPORT
Hello,Friends!
We are going long on the NG1! with the target of 2.461 level, because the pair is oversold and will soon hit the support line below. We deduced the oversold condition from the price being near to the lower BB band.However, we should use low risk here because the 1W TF is red and gives us a counter-signal.
✅LIKE AND COMMENT MY IDEAS✅

NATGAS Will Keep Falling! Sell!
Hello,Traders!
NATGAS is trading in a
Downtrend and the pair
Has formed a bearish flag
Pattern so now that we are
Seeing a bearish breakout
I think that the price
Will go further down
Sell!
Like, comment and subscribe to help us grow!
Check out other forecasts below too!

✅NATGAS STRONG DOWNTREND|SHORT🔥
✅NATGAS has formed a bearish
Flag pattern while trading in a
Downtrend so IF we see a breakout
Then I think that the price
Will go further down
SHORT🔥
✅Like and subscribe to never miss a new idea!✅

Natural Gas Critical LevelsNatural gas, which fell sharply from $ 6.5 to $2 is trying to recover again.
During this process, critical levels were determined. These levels appear at $2.10, $3.50 and $5.50.
As long as it does not fall below the $2.10 level, I can say that the $3.50 targeted buying opportunity in natural gas continues.

UNG Perfect Falling Wedge Rejection | Support & Resistance Guide- UNG rejected from falling wedge upper resistance now dropping a little more then what bulls want to see
- need to confirm a hourly uptrend as the first step for bulls
- want to see it hold it hold 6.65 otherwise going to 6.3

NATURALGAS 22May2023broadly speaking, it is sideways with a fairly large range. but we can still take a chance on a good moment. if you look at the current elliot notation, it is likely that the price will go to the previous HH, you can take a long opportunity with the SL area below the invalid area

Natural Gas Psychology | In-depth Support & Resistance Guide- Natural Gas First Daily uptrend in a while, still continuing
- potential Weekly bull flag if we don't retrace over 0.382
- Next key resistance at 2.65 zone

NG1! BEARISH BIAS RIGHT NOW| SHORT
Hello,Friends!
We are now examining the NG1! pair and we can see that the pair is going up locally while also being in a uptrend on the 1W TF. But there is also a powerful signal from the BB upper band being nearby, indicating that the pair is overbought so we can go short from the resistance line above and a target at 2.246 level.
✅LIKE AND COMMENT MY IDEAS✅

Natgas very stretched to the downsideHow far are we away from monthly:
SMA 36
Mom 12
It looks like might really be ready for bounce - catching the falling knive?

Ng1! bounce ahead?No clear bottom just yet. MacD on the monthly and Stoch RSI are not giving any signals.
The Moving averages are also still trying to catch up to the downside.

✅NATGAS POTENTIAL SHORT🔥
✅NATGAS will soon retest
The falling resistance of the
Narrowing wedge from where
I think it will fall down
Towards the rising trendline below
SHORT🔥
✅Like and subscribe to never miss a new idea!✅

#NaturalGas Can Rise Up Very Quickly #NATGASTraders, Natural gas has created several bullish breakouts over the past weeks but failed to push higher. Now as we are reaching the end of the wedge pattern, a breakout is imminent. This can create a W pattern which in turn can push the prices higher.
Please support this analysis by liking and sharing. 👍🙂
Rules:
1. Never trade too much
2. Never trade without a confirmation
3. Never rely on signals, do your own analysis and research too
✅ If you found this idea useful, hit the like button, subscribe and share it in other trading forums.
✅ Follow me for future ideas, trade setups, and updates on this analysis
✅ Don't hesitate to share your ideas, comments, opinions, and questions.
Take care and trade well
-Vik
____________________________________________________
📌 DISCLAIMER
The content of this analysis is subject to change at any time without notice and is provided for the sole purpose of education only.
Not financial advice or signal. Please make your own independent investment decisions.
____________________________________________________

Natural Gas Clear Support & Resistance Guide | Falling Wedge- AMEX:UNG AMEX:BOIL PEPPERSTONE:NATGAS Natural Gas clear falling Wedge
- Daily uptrend confirmed without much follow through at the moment
- bulls would like us to hold prior pivot lows and bonce off next week

NG1! Is Going Down! Sell!
Please, check our technical outlook for NG1!?
Time Frame: 9h
Current Trend: Bearish
Sentiment: Overbought (based on 7-period RSI)
Forecast: Bearish
The market is testing a major horizontal structure 2.279.
The above-mentioned technicals clearly indicate the dominance of sellers on the market. I recommend shorting the instrument, aiming at 2.146 level.
P.S
We determine oversold/overbought condition with RSI indicator.
When it drops below 30 - the market is considered to be oversold.
When it bounces above 70 - the market is considered to be overbought.
Like and subscribe and comment my ideas if you enjoy them!

NATGAS Bearish Bias! Sell!
Hello,Traders!
NATGAS is trading in a
Narrowing wedge which
But the long-term bias
Is bearish so as the price
Is about to retest the
Falling resistance of the
Wedge I think that we will
See a move down
To retest the rising support
Sell!
Like, comment and subscribe to help us grow!
Check out other forecasts below too!
