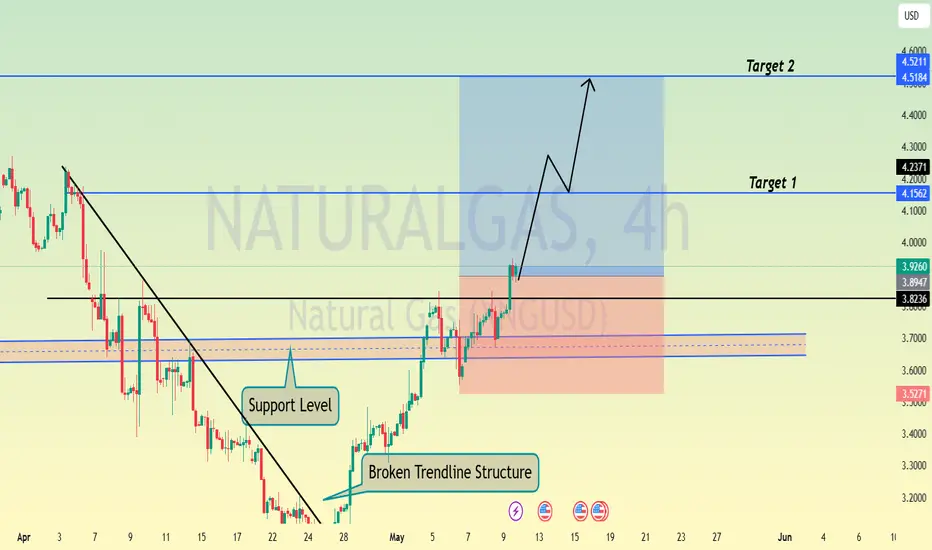
NATGAS WILL GROW|LONG|
✅NZD_USD fell again to retest the support of 3.40$
But it is a strong key level
So I think that there is a high chance
That we will see a bullish rebound and a move up
LONG🚀
✅Like and subscribe to never miss a new idea!✅
Disclosure: I am part of Trade Nation's Influencer program and receive a monthly fee for using their TradingView charts in my analysis.
Ng1

Natural Gas is in the Buying DirectionHello Traders
In This Chart NATGAS HOURLY Forex Forecast By FOREX PLANET
today NATGAS analysis 👆
🟢This Chart includes_ (NATGAS market update)
🟢What is The Next Opportunity on NATGAS Market
🟢how to Enter to the Valid Entry With Assurance Profit
This CHART is For Trader's that Want to Improve Their Technical Analysis Skills and Their Trading By Understanding How To Analyze The Market Using Multiple Timeframes and Understanding The Bigger Picture on the Charts

Natural Gas | Oil | Dollar | Silver | Gold Price ForecastNatural Gas | Oil | Dollar | Silver | Gold Price Forecast
NYMEX:NG1! NYMEX:CL1! COMEX:GC1! COMEX:SI1!

NG1! BEARS ARE STRONG HERE|SHORT
NG1! SIGNAL
Trade Direction: short
Entry Level: 3.461
Target Level: 3.044
Stop Loss: 3.737
RISK PROFILE
Risk level: medium
Suggested risk: 1%
Timeframe: 12h
Disclosure: I am part of Trade Nation's Influencer program and receive a monthly fee for using their TradingView charts in my analysis.
✅LIKE AND COMMENT MY IDEAS✅

NATGAS: Forecast & Technical Analysis
The recent price action on the NATGAS pair was keeping me on the fence, however, my bias is slowly but surely changing into the bullish one and I think we will see the price go up.
Disclosure: I am part of Trade Nation's Influencer program and receive a monthly fee for using their TradingView charts in my analysis.
❤️ Please, support our work with like & comment! ❤️

NG1!: Move Down Expected! Short!
My dear friends,
Today we will analyse NG1! together☺️
The market is at an inflection zone and price has now reached an area around 3.473 where previous reversals or breakouts have occurred.And a price reaction that we are seeing on multiple timeframes here could signal the next move down so we can enter on confirmation, and target the next key level of 3.447.Stop-loss is recommended beyond the inflection zone.
❤️Sending you lots of Love and Hugs❤️

Natural Gas is in the Buying DirectionHello Traders
In This Chart NATGAS HOURLY Forex Forecast By FOREX PLANET
today NATGAS analysis 👆
🟢This Chart includes_ (NATGAS market update)
🟢What is The Next Opportunity on NATGAS Market
🟢how to Enter to the Valid Entry With Assurance Profit
This CHART is For Trader's that Want to Improve Their Technical Analysis Skills and Their Trading By Understanding How To Analyze The Market Using Multiple Timeframes and Understanding The Bigger Picture on the Charts

Natural Gas | Oil | Dollar | Silver | Gold Price ForecastNatural Gas | Oil | Dollar | Silver | Gold Price Forecast
COMEX:GC1! COMEX:SI1! TVC:DXY NYMEX:CL1!

NG1!: Next Move Is Down! Short!
My dear friends,
Today we will analyse NG1! together☺️
The price is near a wide key level
and the pair is approaching a significant decision level of 3.307 Therefore, a strong bearish reaction here could determine the next move down.We will watch for a confirmation candle, and then target the next key level of 3.269.Recommend Stop-loss is beyond the current level.
❤️Sending you lots of Love and Hugs❤️

NATGAS LOCAL SHORT|
✅NATGAS has retested a key resistance level of 3.50$
And as the pair is already making a bearish pullback
A move down to retest the demand level below at 3.30$ is likely
SHORT🔥
✅Like and subscribe to never miss a new idea!✅
Disclosure: I am part of Trade Nation's Influencer program and receive a monthly fee for using their TradingView charts in my analysis.

NG1! BEARS ARE STRONG HERE|SHORT
NG1! SIGNAL
Trade Direction: short
Entry Level: 3.790
Target Level: 3.302
Stop Loss: 4.116
RISK PROFILE
Risk level: medium
Suggested risk: 1%
Timeframe: 1D
Disclosure: I am part of Trade Nation's Influencer program and receive a monthly fee for using their TradingView charts in my analysis.
✅LIKE AND COMMENT MY IDEAS✅

Natural Gas | Oil | Dollar | Silver | Gold Price ForecastNatural Gas | Oil | Dollar | Silver | Gold Price Forecast
NYMEX:NG1! CAPITALCOM:NATURALGAS COMEX:GC1! COMEX:SI1!

NATGAS: Long Trade Explained
NATGAS
- Classic bullish pattern
- Our team expects retracement
SUGGESTED TRADE:
Swing Trade
Buy NATGAS
Entry - 3.325
Stop - 3.206
Take - 3.559
Our Risk - 1%
Start protection of your profits from lower levels
Disclosure: I am part of Trade Nation's Influencer program and receive a monthly fee for using their TradingView charts in my analysis.
❤️ Please, support our work with like & comment! ❤️

NG1!: The Market Is Looking Up! Long!
My dear friends,
Today we will analyse NG1! together☺️
The in-trend continuation seems likely as the current long-term trend appears to be strong, and price is holding above a key level of 3.324 So a bullish continuation seems plausible, targeting the next high. We should enter on confirmation, and place a stop-loss beyond the recent swing level.
❤️Sending you lots of Love and Hugs❤️

NATGAS Will Collapse! SELL!
My dear friends,
My technical analysis for NATGAS is below:
The market is trading on 3.787 pivot level.
Bias - Bearish
Technical Indicators: Both Super Trend & Pivot HL indicate a highly probable Bearish continuation.
Target - 3.487
Recommended Stop Loss - 3.956
About Used Indicators:
A pivot point is a technical analysis indicator, or calculations, used to determine the overall trend of the market over different time frames.
Disclosure: I am part of Trade Nation's Influencer program and receive a monthly fee for using their TradingView charts in my analysis.
———————————
WISH YOU ALL LUCK

XNG/USD Natural Gas Heist: Thief Style Long Entry Plan!🌍 Greetings, global treasure hunters! Ciao! Salaam! Salut! Hola! 🌍
Attention, wealth snatchers and market bandits! 💸🦹♂️
Crafted with the slick Thief Trading Style—a blend of sharp technicals and cunning fundamentals—here’s our blueprint to raid the XNG/USD Natural Gas Energy Market. Follow the chart’s game plan, locked on a long entry. Our mission? Slip out near the perilous YELLOW ATR Zone—a high-stakes trap where overbought vibes, consolidation, or trend flips empower bearish rogues. 🎯💰 “Cash out and spoil yourself, crew—you’ve earned it!” 🥂🚀
Entry 1: “The safe’s cracked! Watch for the MA breakout at 3.750, then pounce—bullish loot awaits!”
Hot tip: Set buy stop orders above the Moving Average or place buy limit orders at the latest 15/30-min swing low/high for pullback plays. 📣 Add a chart alert to nab the breakout!
Entry 2: “The caper’s live! Lurk for the MA pullback in the Grand Heist Zone at 3.300, then strike—fortune favors the bold!”
Stop Loss 🛑: “📢 Yo, crew, hear me out! 🗣️ If you’re jumping in with buy stop or limit orders, don’t set that stop loss until the breakout pops off. 💥 Play it safe and place it where I mark 📍, or go rogue if you’re feeling wild 😎—but don’t blame me if the market bites! ⚡ Your risk, your call.”
📍 Thief SL set at the nearest 4H swing low (3.400) or Grand Heist Zone SL at (3.100) for swing trades.
📍 Adjust SL based on your trade risk, lot size, and multi-order strategy.
Target 🎯: 4.220—or ghost out early if the vibe shifts.
🧲 Scalpers, eyes up! 👀 Stick to long-side scalps. Got deep pockets? Dive in now. Otherwise, join the swing traders for the big heist. Use trailing SL to lock in your haul. 💵
⛽ XNG/USD Natural Gas is buzzing with bullish heat, fueled by key drivers. ☝📰 Dig into Fundamentals, Macro Trends, COT Reports, Inventory Data, Seasonal Patterns, Sentiment Vibes, Intermarket Insights, and Future Targets. Check the full scoop here 👉🔗
⚠️ Heist Alert: News & Position Defense 🗞️🚨
News drops can shake the market like a getaway chase. To protect your stash:
Skip new trades during news hours.
Use trailing stops to guard profits and secure your escape.
💎 Back our heist crew! 💥 Smash that Boost Button 💥 to fuel our money-grabbing spree. Join the Thief Trading Style squad and swipe profits daily with swagger. 🏆🤝🎉
Catch you at the next caper—stay sharp, bandits! 🤑😼🚀

Natural Gas | Oil | Dollar | Silver | Gold Price ForecastNatural Gas NYMEX:NG1! | Oil | Dollar | Silver | Gold Price Forecast
OANDA:XAUUSD NYMEX:CL1!

NATGAS: Short Signal with Entry/SL/TP
NATGAS
- Classic bearish pattern
- Our team expects retracement
SUGGESTED TRADE:
Swing Trade
Sell NATGAS
Entry - 3.787
Stop - 3.900
Take - 3.557
Our Risk - 1%
Start protection of your profits from lower levels
Disclosure: I am part of Trade Nation's Influencer program and receive a monthly fee for using their TradingView charts in my analysis.
❤️ Please, support our work with like & comment! ❤️

Natural Gas is in the Buying Direction After Trendline Breakout Hello Traders
In This Chart NATGAS HOURLY Forex Forecast By FOREX PLANET
today NATGAS analysis 👆
🟢This Chart includes_ (NATGAS market update)
🟢What is The Next Opportunity on NATGAS Market
🟢how to Enter to the Valid Entry With Assurance Profit
This CHART is For Trader's that Want to Improve Their Technical Analysis Skills and Their Trading By Understanding How To Analyze The Market Using Multiple Timeframes and Understanding The Bigger Picture on the Charts
NG1!: Local Bearish Bias! Short!
My dear friends,
Today we will analyse NG1! together☺️
The market is at an inflection zone and price has now reached an area around 3.789 where previous reversals or breakouts have occurred.And a price reaction that we are seeing on multiple timeframes here could signal the next move down so we can enter on confirmation, and target the next key level of 3.690.Stop-loss is recommended beyond the inflection zone.
❤️Sending you lots of Love and Hugs❤️

NATURAL GAS Massive 1W MA50 rebound eyes $6.800Natural Gas (NG1!) is on 3 week bullish streak following the rebound on its 1W MA50 (blue trend-line), which came straight after a 1W MA50/100 Bullish Cross. This rebound manages to keep the long-term Channel Up valid and this rebound is technically the start of it new Bullish Leg.
This price action is similar to the previous 1W MA50/100 Bullish Cross, which also took place inside a Channel Up. As you can see the 1W RSI fractals among the two sequences are identical and the past one rose by +167.17% from that 1W MA50 bottom to the 2.5 Fibonacci extension.
If this time it 'only' hits the 2.5 Fib ext, then we are looking at a $6.800 Target around the end of the year.
-------------------------------------------------------------------------------
** Please LIKE 👍, FOLLOW ✅, SHARE 🙌 and COMMENT ✍ if you enjoy this idea! Also share your ideas and charts in the comments section below! This is best way to keep it relevant, support us, keep the content here free and allow the idea to reach as many people as possible. **
-------------------------------------------------------------------------------
💸💸💸💸💸💸
👇 👇 👇 👇 👇 👇

Natural Gas | Oil | Dollar | Silver | Gold Price ForecastPrice action, multi time frame, trend analysis on
NYMEX:NG1! PEPPERSTONE:NATGAS AMEX:UNG | Oil | Dollar | Silver | Gold Price Forecast

NATGAS Under Pressure! SELL!
My dear friends,
Please, find my technical outlook for NATGAS below:
The instrument tests an important psychological level 3.667
Bias - Bearish
Technical Indicators: Supper Trend gives a precise Bearish signal, while Pivot Point HL predicts price changes and potential reversals in the market.
Target - 3.408
Recommended Stop Loss - 3.818
About Used Indicators:
Super-trend indicator is more useful in trending markets where there are clear uptrends and downtrends in price.
Disclosure: I am part of Trade Nation's Influencer program and receive a monthly fee for using their TradingView charts in my analysis.
———————————
WISH YOU ALL LUCK
