Norwegian pennystock Flex LNG (Natural gas transportation)Table of contents:
§ 1 About FLNG
§ 2 The market
§ 3 Why I am bullish
§ 4 The risks
§ 1
Flex LNG(FLNG) is a Norwegian company.
They specialize in transporting liquid natural gas around the world for heat, cooking etc.
They also create ships themselves, specially created within the CE regulations to ensure safe transport, as natural gas is highly flammable and explosive (who would have figured that one out...)
Now, FLNG has done something that might be incredibly smart or it might be incredibly stupid depending on which way things goes:
Most companies transporting gas and oil get a fixed rate on the transport, however FLNG has made it so they get paid based on the spot price of natural gas (futures are called NG1! if you want to see the price)
This means if the price of natural gas goes up, so does their revenues, which also creates an interesting scenario for us as I will explain in more details in § 3.
§ 2
FLNG's market is mostly based in China and India (~2 billion people) which in latest years have used a lot of coal for heating, the problem with burning coal is that it's very harmful to the environment, it releases a lot of CO2 and last but not least it releases microscopic particles in the air increasing cases of astma and COPD (Chronic Obstructing Pulmonary Disease) which I don't have to tell you - is reall bad.
Now both China and India needs to move over to a more environmental friendly source of energy and heat, this is where natural gas comes in.
When you burn natural gas, you only get CO2 and water as a biproduct, which is still bad for global warming, but does not increase cases of COPD or astma.
§ 3
I am bullish when it comes to FLNG as I believe it will be ranging a lot based on time of year, as we can see when it comes to natural gas spot prices, this can make it a lot easier to predict price movements, as price has historically been highest in the winter (because it's cold and people need more heating, again, who would have figured...), and lower in the summer as very few people need heat in the summer.
I also think that because the market is so huge with at least 2 billion people I think there is a LOT of room for expansion.
§ 4
Although I believe this is an up and coming industry that will be huge the coming years, there is no guarantee that FLNG will be the leaders in the market, but seeing as Norway historically have been one of the leading ship builders and also leading within oil technology I strongly believe flex have a high potential. However, if it does not reach a 50-100% increase within February, it will likely not happen this year as spot prices will be on their way down again.
Another risk is market turbulence which might hurt FLNGs price.
To end it off with a little bit of my techincal analysis:
Price bounced from the 80NOK mark (~$10) where it has not been since it's true pennystock days where liquidity was scarce. Price was trending downwards after the winter just like NG prices have too. I believe the 80NOK level will hold because a lot of bigger institutions bought in at 120NOK and I believe they will either look to average down around the 80NOK mark to get their average to 100NOK to lower their overall downside.
And as we are smarter than the institutions (not really) I came up with an idea on how to spot more accurately when price is likely to explode (thank me later):
Look at weather forcast for the most populated areas in China and India, when temperatures start dropping it's probably time to buy either FLEX or NG futures.
Thank you all for reading and have a great rest of your day.
Ng1

Natural Gas (NATGASUSD): Technical Outlook 💨
A lot of questions about Natural Gas.
Here is my detailed technical outlook.
2 weeks ago, the market reached a key daily structure support and nicely bounced from that.
Zooming in the chart and analyzing a price action, we may spot an ascending triangle formation - a classic bullish accumulation pattern.
The price sets higher lows, respecting 6.2 - 6.6 horizontal resistance.
I believe that the next bullish move will initiate after a bullish breakout of the underlined structure (we need a daily candle close above that to confirm the breakout).
A bullish continuation will be expected to 7.076 then.
Alternatively, a bearish breakout of a trend line may push the market to a current low.
❤️If you have any questions, please, ask me in the comment section.
Please, support my work with like, thank you!❤️

✅NATGAS SHORT FROM RESISTANCE🔥
✅NATGAS is going up now
But a strong resistance cluster level is ahead
Thus I am expecting a pullback
And a move down towards the target
SHORT🔥
✅Like and subscribe to never miss a new idea!✅

Pessimistic picture of natural gasThis scenario is under the assumption that we keep downtrend in natural gas irresistible manner.
There is also the alternative with breaking up to 8, but in downtrends we always expect breaking up and mostly always going down and down.
On normal scale we broke a little trend line, on logarithmic - not.

NATURAL GAS NATGAS Technical analysisSee Chart For Analysis.
Higher Timeframe:
-Price inside weekly demand
-Trend = uptrend
-Looking for longs
Lower Timeframe:
-4hr over-extended market broke 3x DBD in a row.
-Price making HH/HL on 4hr timeframe.
-Price shows both ML break + opposing zones removed + quality zones
Options:
1) buy inside 4hr demand
2) look for 5min/15min buys with confirmation once price enters 4hr demands.

✅NATGAS SWING SHORT🔥
✅NATGAS violated the rising support recently
And went down just as I predicted
In my previous analysis but the price
Went up in a bullish correction
To retest the resistance from where
We are already seeing a bearish reaction
So a bearish continuation is to be expected
SHORT🔥
✅Like and subscribe to never miss a new idea!✅

NATGAS Risky Short! Sell!
Hello,Traders!
NATGAS is retesting a broken horizontal level
So I am bearish biased
And I think that we are likely
To see a move down
Sell!
Like, comment and subscribe to boost your trading!
See other ideas below too!

BUY NGRecently, the price of natural gas has been under pressure due to measures to reduce consumption and prices in Europe ahead of winter. Officials expect another supply crunch due to restricted access to Russian pipelines and a possible jump in demand for heating goods. Today, the price of natural gas NATGAS / USD is stable between the level of $5.81 and the level of $6.03 per million British thermal units. On another note. An inventory report from the US Department of Energy can determine if the floor can hold or not. Analysts expect a smaller increase in inventories of 103 billion cubic feet compared to the previous increase of 125 billion cubic feet, indicating an increase in purchases.
LNG exports to other countries and storage activity leading to colder months may be responsible for the slowdown in the increase in storage. However, a larger-than-expected increase could mean more downside for natural gas as this may indicate that demand remains weak.
On the gas crisis front following the ongoing Russo-Ukrainian war:
German Chancellor Olaf Scholz has warned that a proposal to cap gas prices at the EU level could backfire as the region seeks to offset significant supply cuts from Russia. “Price capping always involves the risk that producers will sell their gas elsewhere – and we Europeans will end up having less gas instead of more,” Schulz said Thursday in a speech to the German parliament in Berlin.
The German chancellor was speaking ahead of a two-day summit of European Union leaders in Brussels. The bloc's member states will discuss ways to keep energy prices under control and ensure security of supplies, as well as the recent situation in Russia's war in Ukraine. Rather than setting a price cap, Schulze supported the idea of cooperating closely with buyers such as Japan and South Korea to avoid competition for limited supplies, while also attracting like-minded producers. "I am convinced that countries like the United States, Canada or Norway, who stand with us in solidarity with Ukraine, have an interest that energy in Europe will not become too expensive," he said.
According to gas technical analysis: Natural gas price NATGAS/USD has retreated to the main area of interest shown on the longer-term time frames, and a break below could pave the way for a move to the next major support area at $3,635. Technical indicators favor a bounce, as the 100 SMA is above the 200 SMA to reflect bullish pressure. However, the gap between the indicators is narrowing to hint at a possible bearish crossover soon. The commodity is also trading below its two moving averages as an early indication of selling momentum.
If that materializes, the price of natural gas could drop below $5,585 and make its way to the next main floor. The stochastic has been indicating oversold conditions for some time, which means that sellers can use a breakout period and let the buyers take control. Similarly, the RSI is in the oversold territory to indicate exhaustion among the bears. A turn higher means that bullish momentum could pick up and take the commodity back to the next upside barrier around $8,000.

Too fast, too furious for Natural Gas?After a sharp drop in August, Natural Gas futures is now sitting close to the long-term uptrend support which has marked key reversal points since June 2020. Our question is whether prices have fallen too fast and too soon?
We question “too furious” when we look at the RSI which currently points to oversold levels. Hitting a low close to 24, the last time RSI reached such an oversold level, in February 2017, prices rallied close to 35% over the next 2 months. We also note the formation of RSI divergence now, like the one we observed during the 2017 period. If history is any guide, from a technical perspective we can expect some upside for Natural Gas in the coming 2 months.
We question “too fast” as we are at the dawn of the seasonality trade. With demand for Natural gas used for heating generally rising as winter months are approaching, we can reflect on the seasonality behavior of Natural Gas prices over the past winters. A simple strategy of buying in the middle of October and waiting for the winter months gives a 70% win-rate when we look back at the past 10 years. Could we expect the same this winter?
On top of these, we think there are a few structural factors that might boost natural gas demand in the US over a longer-term horizon.
1) The recent announcement by the Biden administration that ruled out a ban or curbs on natural gas exports this winter, and Europe’s struggle with the energy crisis spell good news for Natural Gas’s demand.
2) Current Natural gas storage levels are also below the 5-year average as reported by the US EIA .
3) A move away from coal as agreed in the COP26 means alternative energy sources are bound to replace coal. With many coal-powered plants being refurbished to work with natural gas, we see structural demand rising as more of these plants come online.
Natural gas’s current technical levels point oversold to us, with the seasonality trade potentially on the cards and an overall supportive macro backdrop, we lean bullish on Natural gas. As Natural Gas is considered a highly volatile contract, we can use the Average True Range (ATR) to set our stops. In this case, we follow the rule of thumb to multiply the ART by 2, which sets our stop at roughly 4.550.
Entry at 5.200, stop at 4.550. Target at 6.400.
The charts above were generated using CME’s Real-Time data available on TradingView. Inspirante Trading Solutions is subscribed to both TradingView Premium and CME Real-time Market Data which allows us to identify trading set-ups in real-time and express our market opinions. If you have futures in your trading portfolio, you can check out on CME Group data plans available that suit your trading needs www.tradingview.com
Disclaimer:
The contents in this Idea are intended for information purpose only and do not constitute investment recommendation or advice. Nor are they used to promote any specific products or services. They serve as an integral part of a case study to demonstrate fundamental concepts in risk management under given market scenarios.

NATGAS Supply And Demand LONG AnalysisHigher Timeframe:
-Price inside HTF weekly demand
-Look for buys
Lower Timeframe:
-4hr timeframe overextended with 6x DBD in a row.
-Wait for aggressive downward trend line break + strong quality zone to be created
-looking to either buy the demand is price pulls back or use as my highertimeframe and then look for new lowertimeframe
confirmation.

Ultra Short Term and Mid Term view of NATURAL GAS NG UNGTickers: NG1!, UNG
Short term view: We are finding weak support at $4.90 level on NG, or $17.50 on UNG.
We are in overall BEAR BIAS MARKET (even with the short term uptrend in the larger equities and bond market) so we will retain the retracement from the SELLERS perspective.
We find a strong case to take profit at $5.20 (NG1!) or $18.15 (UNG)
TP1: $5.20 (NG1!) / $18.15 (UNG)
TP2: $5.35 (NG1!) / $18.80 (UNG)
There is a possibility if the market exuberance continues, we can consider a mid-term view of NG
MIDTERM VIEW :
SHORT TERM VIEW:

what the market says we have 2 ways
if close above the resistance 7.23 will go heigher
if we get rejection in that area we will have a big move into down and we look for short

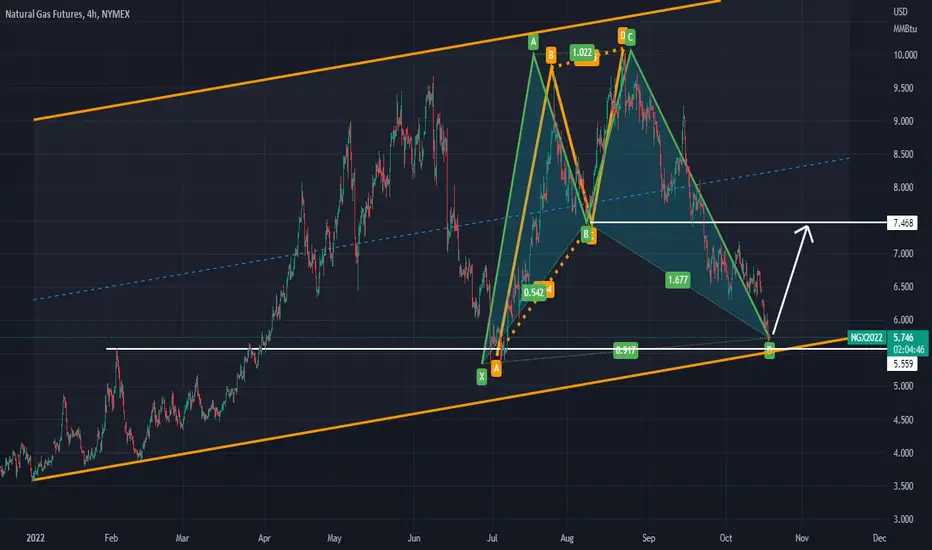
looking for bullish cypher set upPrevious Resistances of $5.559 acting as support for this current D leg.. I initially spotted the ABCD pattern in orange, then I looked for the Bullish Cypher on D leg to kick off. The AD Will confirm
Natural Gas - Head and Shoulder target 5.325Head and Should Target 5.325 also coincides with July lows

NATURAL GAS Futures (NG1!), H4 Potential for Bearish MomentumType: Bearish Momentum
Resistance: 600.5
Pivot: 516.5
Support: 327.8
Preferred Case: On H4, as the price moving below ichimoku cloud and descending channel, we have a bearish bias that the price may drop from the pivot at 516.5. which is in line with the overlap resistance to the 1st support at 327.8, where the 127.2% fibonacci extension is.
Alternative scenario: Alternatively, the price may rise to the 1st resistance at 600.5, which is in line with the 38.2% fibonacci retracement.
Fundamentals: There are no major news.

✅NATGAS MOVE DOWN AHEAD|SHORT🔥
✅NATGAS was trading along the rising support
But now we are seeing a bearish breakout
So I am bearish biased and I think
That the price will fall down
To retest the demand level below
SHORT🔥
✅Like and subscribe to never miss a new idea!✅

NATURAL GAS Support Ahead! Buy!
Hello,Traders!
NATURAL GAS is going down
But a horizontal support level
Is ahead so after the retest
A bullish rebound is likely
To happen with the retest
Of the target level above
Buy!
Like, comment and subscribe to boost your trading!
See other ideas below too!

Natural gas trading idea.NATGAS has a lot of big fundamental factors currently, with Russia controlling I believe 75% of the worlds NATGAS reserves we are seeing the tampering of supply alter the market price alot.
Coming into the winter months we could see the price rise considerably as everyone tries to store as much gas as possible we could see supply side issues.
Ideally TWAP turning green gives a good indication of any further imbalance.

Natural Gas: The supply-demand dynamic is at a critical stageDeutsche Bank reported that in a particularly critical phase is the supply-demand dynamics regarding natural gas towards the winter season, which the behavior of households will be decisive in the coming months, as their consumption represents a large percentage of total consumption. A supply failure is likely to be avoided at least as the scenarios confirm that a 20% YoY reduction in consumption this winter (and flat annual demand thereafter) is likely to lead to some shortages either early in 2023 or the winter of 2023/24.
The reduction in Germany remains at 40%, while if demand falls by only 10% YoY stocks will not be exhausted even in such a scenario. For certain, fill levels would fall below 10% in late winter 2022/23, but this would not put energy security in doubt until 2024. The European Commission is working on proposals to limit prices. While negotiating with reliable suppliers, for instance, Norway, and strengthening common markets seem to be the Commission’s preferred options, the idea of a (temporary) price cap on imported natural gas is gaining ground.
The greater the potential for the implementation of a cap the lower the success of the implementation of the first two measures. Such an implementation could lead to increase supply risks, depending on the design of such an import price cap which would accompany the mandatory demand reduction.
From an Elliot wave perspective, we will examine the Natural Gas chart to see its potential move in the short to mid-term.
Looking at the weekly chart, natural gas made an impulsive five-wave rally from the lows, which suggests that low is in place and we can expect a bigger recovery. However, in Elliott waves, after every five-wave rise we can expect a slow down in three waves, so we are tracking now an (A)-(B)-(C) correction before the uptrend resumes. First support is around 5.3 level, while second support would be around 3.5 level.
All the best!
If you like what we do, then please like and share our idea.
Disclosure: Please be informed that information we provide is NOT a trading recommendation or investment advice. All of our work is for educational purposes only.

NG rally imminent creating BOIL rally - call strategyI expect NG to rally off the lower trend line of the pennant and go to at least the $8.47 liquidity zone. This is not purely a technical play as it is the season to expect increases in gas consumption/demand. Technically all the signs of a rally are present. The Weis waves for supply are decreasing and demand is increasing. The accumulation/distribution line has turned up. There is an increase in volume associated with the buys sufficient to build momentum to cross the creek/ break through the upper trend line. My target for NG is based on the liquidity left there from the last swings.
My first target for Natural Gas is $7.50. Second is $7.72. The trade will be invalidated south of the lower pennant trend line so a 'stop' placed there.
I am playing this long with October call options in BOIL While I am purchasing BOIL and not NG, my stop will be triggered by NG quote trigger - crossing 5 cents under the low of 9/26 at $6.72. It is possible there will be a shakeout/spring/liquidity grab before the real move so cannot set stop too tight.
This is what I see in NG1!:
And this is my chart for BOIL:
My play is options. Aiming for a home run on this. It is possible that both NG and BOIL will bounce off the targets the first time, so if you copy the naked option play the perfect play sells the calls on the pullback and buys back lower. But be careful being greedy! :)

Natural Gas (NATGASUSD): Confirmed Breakout 💨
Last week, I shared with you a head and shoulders pattern formation
that I spotted on Natural Gas on a daily time frame.
The price has successfully closed below its neckline.
The price is currently heading towards 6.175.
Bias remains very bearish.
If you missed the entry, consider an occasional retest of a broken neckline.
❤️If you have any questions, please, ask me in the comment section.
Please, support my work with like, thank you!❤️

NATGAS Will Go Up! Buy!
Hello,Traders!
NATGAS fell sharply from the highs
But a rising support is nearby
So a bullish correction is ahead
With the target being the resistance above
Buy!
Like, comment and subscribe to boost your trading!
See other ideas below too!
