NATGAS: Short Trading Opportunity
NATGAS
- Classic bearish formation
- Our team expects pullback
SUGGESTED TRADE:
Swing Trade
Short NATGAS
Entry - 3.667
Sl - 3.862
Tp - 3.269
Our Risk - 1%
Start protection of your profits from lower levels
Disclosure: I am part of Trade Nation's Influencer program and receive a monthly fee for using their TradingView charts in my analysis.
❤️ Please, support our work with like & comment! ❤️
Ng1

NG1!: The Market Is Looking Down! Short!
My dear friends,
Today we will analyse NG1! together☺️
The in-trend continuation seems likely as the current long-term trend appears to be strong, and price is holding below a key level of 3.653 So a bearish continuation seems plausible, targeting the next low. We should enter on confirmation, and place a stop-loss beyond the recent swing level.
❤️Sending you lots of Love and Hugs❤️

NATGAS Resistance Ahead! Sell!
Hello,Traders!
NATGAS is growing sharply
But the price is nearing a
Strong horizontal resistance
Around 3.80$ so after the
Retest on Monday we will be
Expecting a local bearish
Correction as Gas is already
Locally overbought
Sell!
Comment and subscribe to help us grow!
Check out other forecasts below too!
Disclosure: I am part of Trade Nation's Influencer program and receive a monthly fee for using their TradingView charts in my analysis.

Potential Decline of Natural Gas Prices to $2.43–$2.74Brief Overview of Events and News Explaining the Potential Decline of Natural Gas Prices to $2.43–$2.74.
➖ Weather Forecast and Reduced Demand
On April 23, 2025, the U.S. National Weather Service forecasted milder-than-average weather across the U.S. for late spring and early summer 2025, particularly in key gas-consuming regions like the Northeast and Midwest.
Warmer weather reduces the demand for heating, a primary driver of natural gas consumption. This led to a 2.5% decline in Henry Hub natural gas futures, settling at $3.05 per MMBtu on April 24, 2025.
Source: Reuters
➖ High U.S. Natural Gas Inventories
The U.S. Energy Information Administration (EIA) reported on April 17, 2025, that natural gas inventories increased by 75 billion cubic feet (Bcf) for the week ending April 11, 2025, significantly exceeding the five-year average build of 50 Bcf. Total U.S. inventories are now 20% above the five-year average, indicating an oversupply that pressures prices downward.
Source: EIA, "Weekly Natural Gas Storage Report," April 17, 2025
➖ Weak Global LNG Demand
On April 22, 2025, Bloomberg reported a decline in demand for liquefied natural gas (LNG) in Asia, particularly in China, due to an economic slowdown and a shift to cheaper coal alternatives. China’s LNG imports in Q1 2025 dropped 10% year-over-year, reducing export opportunities for U.S. gas producers and adding pressure on domestic prices.
Source: Bloomberg, "China’s LNG Imports Fall as Coal Use Rises," April 22, 2025
Technical Analysis
Natural gas futures (NYMEX) are currently around $3.15 per MMBtu as of April 28, 2025, following a recent decline from a peak of approximately $4.90 in 2025.
Fibonacci retracement levels indicate correction targets at 38.2% ($2.74) and 50% ($2.43).
Fundamental factors, such as oversupply and reduced demand, support a bearish scenario that could drive prices to these levels in the near term.
Nearest Entry Point Target:
• $2.74
Growth Potential:
Long-term:
• $10
Screenshot:

NATGAS Set To Fall! SELL!
My dear friends,
NATGAS looks like it will make a good move, and here are the details:
The market is trading on 2.964 pivot level.
Bias - Bearish
Technical Indicators: Supper Trend generates a clear short signal while Pivot Point HL is currently determining the overall Bearish trend of the market.
Goal - 2.929
About Used Indicators:
Pivot points are a great way to identify areas of support and resistance, but they work best when combined with other kinds of technical analysis
Disclosure: I am part of Trade Nation's Influencer program and receive a monthly fee for using their TradingView charts in my analysis.
———————————
WISH YOU ALL LUCK

NG1!: The Market Is Looking Up! Long!
My dear friends,
Today we will analyse NG1! together☺️
The recent price action suggests a shift in mid-term momentum. A break above the current local range around 2.951 will confirm the new direction upwards with the target being the next key level of 3.042 and a reconvened placement of a stop-loss beyond the range.
❤️Sending you lots of Love and Hugs❤️

NATGAS: Expecting Bearish Continuation! Here is Why:
It is essential that we apply multitimeframe technical analysis and there is no better example of why that is the case than the current NATGAS chart which, if analyzed properly, clearly points in the downward direction.
Disclosure: I am part of Trade Nation's Influencer program and receive a monthly fee for using their TradingView charts in my analysis.
❤️ Please, support our work with like & comment! ❤️

The Natural gas will make a dip once againNATURAL GAS H1 Analysis 📊
First of all , lets take about the gap
war , This gap is due to war and as you know market will refill it sooner or later , thats the main reason of the selling
Yes, no doubt , the market can go up for some sl hunting thats why the red zone is little wider
The ultimate trend is sell due to no investors in gas because all the investors are busy in the BITCOIN AND GOLD. so it will come back at its lowest support sooner or later
Follow the money management strictly and this is just the prediction.
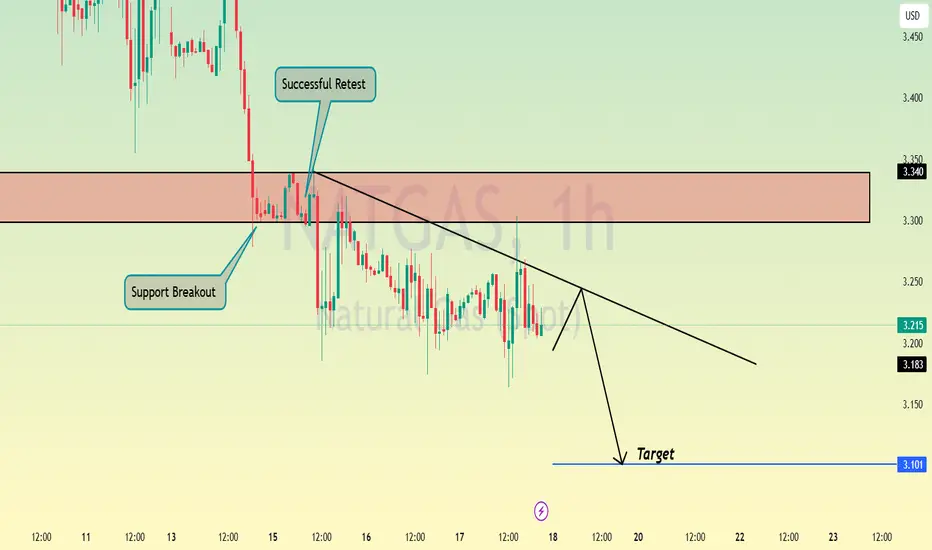
NATGAS - Bearish Head and ShouldersHello Traders !
The Natural Gas price formed a head and shoulders pattern.
Currently, The neckline is broken !
So, I expect a bearish move📉
_______________
TARGET: 3.2350🎯

NG1! BUYERS WILL DOMINATE THE MARKET|LONG
NG1! SIGNAL
Trade Direction: long
Entry Level: 3.247
Target Level: 3.717
Stop Loss: 2.932
RISK PROFILE
Risk level: medium
Suggested risk: 1%
Timeframe: 1D
Disclosure: I am part of Trade Nation's Influencer program and receive a monthly fee for using their TradingView charts in my analysis.
✅LIKE AND COMMENT MY IDEAS✅

Natural Gas | Oil | Dollar | Silver | Gold Price ForecastNatural Gas | Oil | Dollar | Silver | Gold Price Forecast
NYMEX:CL1! COMEX:SI1! COMEX:GC1! AMEX:UNG

NG1!: Next Move Is Down! Short!
My dear friends,
Today we will analyse NG1! together☺️
The in-trend continuation seems likely as the current long-term trend appears to be strong, and price is holding above a key level of 3.241 So a bullish continuation seems plausible, targeting the next high. We should enter on confirmation, and place a stop-loss beyond the recent swing level.
❤️Sending you lots of Love and Hugs❤️

NATGAS Resistance Cluster Above! Sell!
Hello,Traders!
NATGAS made a bearish
Breakout of the support
Cluster of the rising and
Horizontal support levels
Which is now a resistance
Cluster round 3.717$ then
Went down and made a local
Pullback on Thursday and
Friday but we are bearish
Biased mid-term so we
Will be expecting a further
Bearish move down this week
Sell!
Comment and subscribe to help us grow!
Check out other forecasts below too!
Disclosure: I am part of Trade Nation's Influencer program and receive a monthly fee for using their TradingView charts in my analysis.

Natural Gas | Oil | Dollar | Silver | Gold Price ForecastNatural Gas | Oil | Dollar | Silver | Gold Price Forecast
NYMEX:CL1! COMEX:SI1!

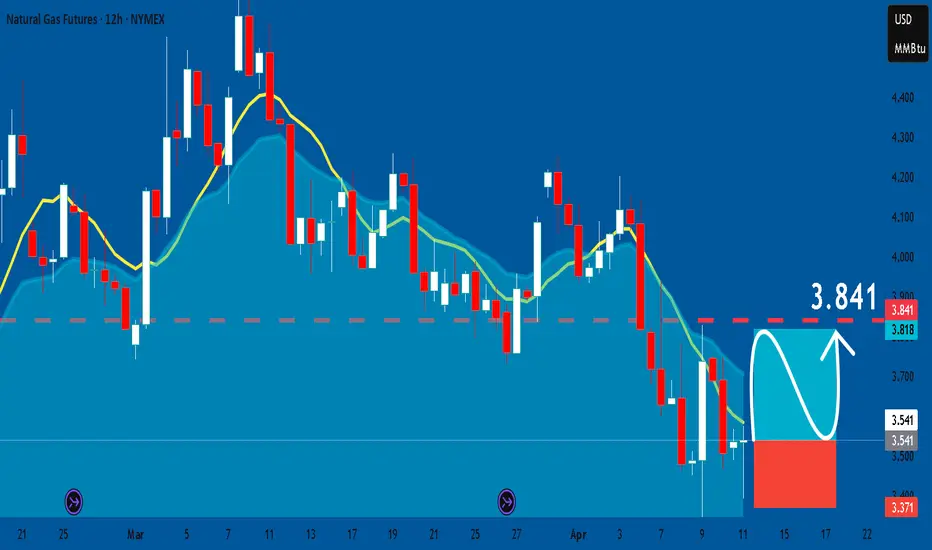
NATGAS: Long Trade Explained
NATGAS
- Classic bullish formation
- Our team expects pullback
SUGGESTED TRADE:
Swing Trade
Long NATGAS
Entry - 3.541
Sl - 3.371
Tp - 3.841
Our Risk - 1%
Start protection of your profits from lower levels
Disclosure: I am part of Trade Nation's Influencer program and receive a monthly fee for using their TradingView charts in my analysis.
❤️ Please, support our work with like & comment! ❤️
NG1!: Will Go Down! Short!
My dear friends,
Today we will analyse NG1! together☺️
The price is near a wide key level
and the pair is approaching a significant decision level of 3.540 Therefore, a strong bearish reaction here could determine the next move down.We will watch for a confirmation candle, and then target the next key level of 3.507..Recommend Stop-loss is beyond the current level.
❤️Sending you lots of Love and Hugs❤️

"XNG/USD Natural Gas" Energy Market Heist Plan (Scalping/Day)🌟Hi! Hola! Ola! Bonjour! Hallo! Marhaba!🌟
Dear Money Makers & Robbers, 🤑 💰💸✈️
Based on 🔥Thief Trading style technical and fundamental analysis🔥, here is our master plan to heist the "XNG/USD Natural Gas" Energy Market. Please adhere to the strategy I've outlined in the chart, which emphasizes long entry. Our aim is to escape near the high-risk ATR Zone. Risky level, overbought market, consolidation, trend reversal, trap at the level where traders and bearish robbers are stronger. 🏆💸"Take profit and treat yourself, traders. You deserve it!💪🏆🎉
Entry 📈 : "The vault is wide open! Swipe the Bearish loot at any price - the heist is on!
however I advise to Place sell limit orders within a 15 or 30 minute timeframe most nearest or swing, low or high level for Pullback Entries.
Stop Loss 🛑:
📌Thief SL placed at the nearest/swing High or Low level Using the 2h timeframe (3.800) Day/Scalping trade basis.
📌SL is based on your risk of the trade, lot size and how many multiple orders you have to take.
🏴☠️Target 🎯: 3.200
🧲Scalpers, take note 👀 : only scalp on the Long side. If you have a lot of money, you can go straight away; if not, you can join swing traders and carry out the robbery plan. Use trailing SL to safeguard your money 💰.
⛽💨"XNG/USD Natural Gas" Energy Market Heist Plan (Scalping/Day) is currently experiencing a bullishness,., driven by several key factors. 👇👇👇
📰🗞️Get & Read the Fundamental, Macro Economics, COT Report, Inventory and Storage Analysis, Seasonal Factors, Sentimental Outlook, Intermarket Analysis, Future trend targets & Overall Outlook Score... go ahead to check 👉👉👉🔗🔗
⚠️Trading Alert : News Releases and Position Management 📰 🗞️ 🚫🚏
As a reminder, news releases can have a significant impact on market prices and volatility. To minimize potential losses and protect your running positions,
we recommend the following:
Avoid taking new trades during news releases
Use trailing stop-loss orders to protect your running positions and lock in profits
💖Supporting our robbery plan 💥Hit the Boost Button💥 will enable us to effortlessly make and steal money 💰💵. Boost the strength of our robbery team. Every day in this market make money with ease by using the Thief Trading Style.🏆💪🤝❤️🎉🚀
I'll see you soon with another heist plan, so stay tuned 🤑🐱👤🤗🤩

NATGAS Local Bearish Pullback Expected! Sell!
Hello,Traders!
NATGAS is about to hit
A strong horizontal resistance
Level of 3.880$ after a sharp
Push upwards by the bulls
So a local correction is needed
From the resistance with the
Expected target being the
Local level below at 3.655$
Sell!
Comment and subscribe to help us grow!
Check out other forecasts below too!
Disclosure: I am part of Trade Nation's Influencer program and receive a monthly fee for using their TradingView charts in my analysis.

NATGAS Bearish Breakout! Sell!
Hello,Traders!
NATGAS made a bearish
Breakout of the key horizontal
Resistance of 3.626$ and the
Breakout is confirmed so we
Are bearish biased and we will
Be expecting a further
Bearish move down
Sell!
Comment and subscribe to help us grow!
Check out other forecasts below too!
Disclosure: I am part of Trade Nation's Influencer program and receive a monthly fee for using their TradingView charts in my analysis.

NATGAS BEARISH BREAKOUT|SHORT|
✅NATGAS formed a head
And shoulders pattern then
Made a bearish breakout of
The neckline which is now
A resistance of 3.850$
And the breakout is confirmed
So we are bearish biased and
We will be expecting a
Further bearish move down
SHORT🔥
✅Like and subscribe to never miss a new idea!✅
Disclosure: I am part of Trade Nation's Influencer program and receive a monthly fee for using their TradingView charts in my analysis.

Gold | Oil | Dollar | Silver | Natural Gas Price ForecastGold | Oil | Dollar | Silver | Natural Gas Price Forecast

NATGAS Technical Analysis! BUY!
My dear friends,
My technical analysis for NATGAS is below:
The market is trading on 3.819 pivot level.
Bias - Bullish
Technical Indicators: Both Super Trend & Pivot HL indicate a highly probable Bullish continuation.
Target - 3.970
Recommended Stop Loss - 3.740
About Used Indicators:
A pivot point is a technical analysis indicator, or calculations, used to determine the overall trend of the market over different time frames.
Disclosure: I am part of Trade Nation's Influencer program and receive a monthly fee for using their TradingView charts in my analysis.
———————————
WISH YOU ALL LUCK

NATGAS SUPPORT AHEAD|LONG|
✅NATGAS will soon retest a key support level of 3.728$
So I think that the pair will make a rebound
And go up to retest the supply level above at 3.887
LONG🚀
✅Like and subscribe to never miss a new idea!✅
Disclosure: I am part of Trade Nation's Influencer program and receive a monthly fee for using their TradingView charts in my analysis.
