NG Halloween Trick or TreatToday the November(X) contract for Natural Gas corrected down to the historically significant $2.50 level. Going back a couple years it is clear that prices tend to hangout above $2.75 so right now prices are undervalued.
Buying here.
+1 @ $2.53
Ng1

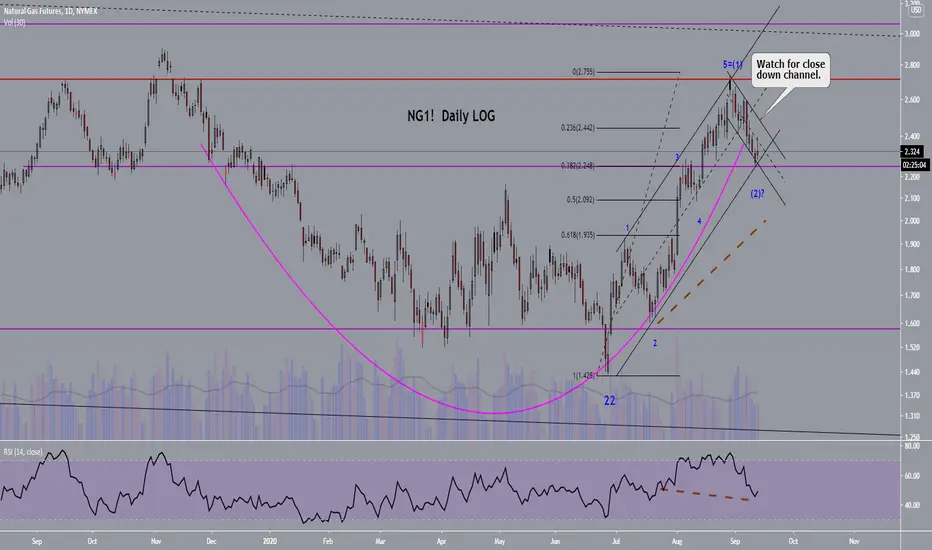
Natural gas: Cup with handle formation. Looks bullishWe have a cup with handle formation. Signal for buy would be a close the current down channel line. If you would go long now can use close below most ring low.
Supporting this idea is a sizable positive reversal in the daily RSI .
Major natural gas producers are: AR,EQT , and RRC all of which are up today. Take a look at them.
UNG is a natural gas ETF .
Natural Gas (NATGASUSD): Three Reasons to Pay Attention!!!
Looks like bullish continuation is coming on NATGAS.
Key levels, price action, and scenarios explained.
Please, support me with like and comment. Thank you!

NG - September Pullback Arrived 9/12/2020NG at the daily view.
September's pullback finally arrived. This shouldn't be a surprise at all. Temperatures lowered to a level where the A/C doesn't need to be on all the time. However, the temperature is not cold enough to turn on the heat.
Utility companies are already planning for how much energy would be needed for the fall.
I wouldn't go full short with this. Usually, September is a pullback. However, when approaching October, that's when natural gas rallies again. You do not want to be caught short when the heat demands ramps up.
Other than that, NG seemed to have form an upward channel since August. The price action seems to be aligning with the lines.

Natural Gas (NATGASUSD): Update & Bearish Continuation
as it been said in my earlier analysis for natgas,
the market reached a key weekly supply zone.
based on that the market violated a rising channel that it followed from the beginning of August.
it looks like the sentiment is changing and bears are willing to push even lower.
goals:
2.31
2.19
(on the chart is the short trade that I took yesterday during us opening, it is based on the retest of the support of the channel)


Natural Gas (NATGASUSD): Key Weekly Supply Zone AHEAD!
hey traders,
Summer's crazy bullish rally may be interrupted soon.
the price is entering a key weekly supply cluster based on 4 last year's price action.
analyzing the previous reaction of the market to that area, chances will be high that the market will at least stop there and start a consolidation.
depending on the price action on a daily, I will try to catch a pullback from there.
good luck.

Natural gasThe speculation and the hurricane season should be finished.
Eliott pattern is also done and there is a nice bearish divergence.
Target 2.20

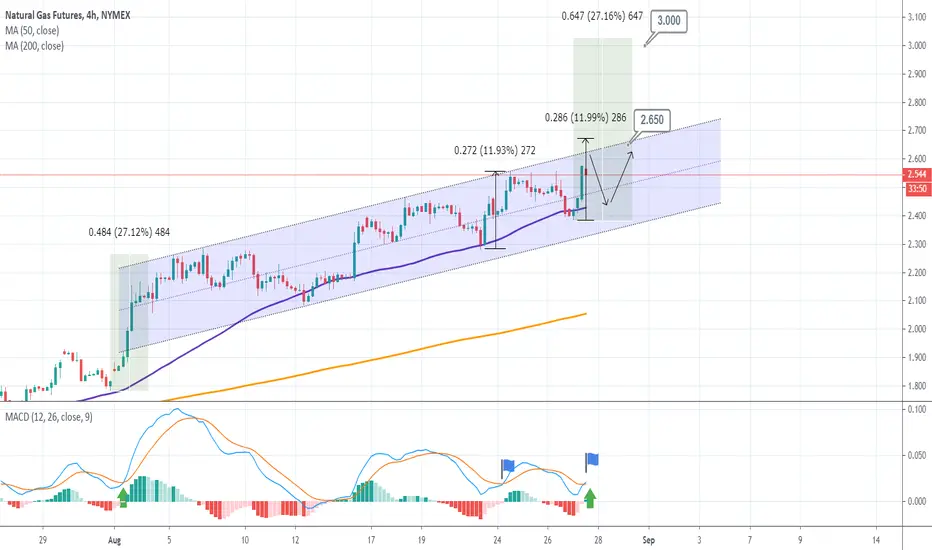
NATURAL GAS Trading PlanPattern: Channel Up on 4H.
Signal: Bullish on the 4H MA50 or if the Channel Up breaks upwards.
Target: 2.650 and if 2.680 breaks (+12% from low) potential extension towards 3.000 (+27% from low).
** Please support this idea with your likes and comments, it is the best way to keep it relevant and support me. **
!! Donations via TradingView coins also help me a great deal at posting more free trading content and signals here !!
September Pullback or Hurricane Rally? 8/25/2020NG at the daily view.
Natural gas is stuck between two trend lines. They're acting as both support and resistance. Currently, Natty is above all major moving averages which is bullish on its face. That said, this could go in two directions.
1) September usually has a pullback due to cooler weather and less need for A/C. However, the temperatures are just high enough to not need heat or stay indoors. Judging by how many supports are below, I am not expecting a big pullback. The next support could be 2.25, 2.08, or 1.99... And they're all rising. They keyword is "usually."
2) That said, Hurricane Laura is also disrupting the gas and oil extraction and production sites. If Hurricane Laura causes more damage and cut off production, then the supply of oil and gas may decrease further. That would increase the price. A series of gas companies filed for bankruptcies back in June. That also decreases the supply.
In either case, Natty will definitely ramp up when we near October due to increased demand. In this cycle, this would be a terrible time to be a bear.


Disappointing September Pullback? 8/23/2020NG at the daily.
NG usually has a pullback in September due to cooler weather, but not quite freezing. There are several supports below. 2.24 and 2.08 will be kind of hard to break since they are the 400 and 300 DMAs. The lowest price that I see this going is 1.97. It's less likely, but Natty has a tendency to do the improbable.
September's pullback may prove to be disappointing. A wave of gas companies filed for bankruptcy back in June which caused the short-term bearish pattern during the summer. Utility companies were expecting a prolonged shut down.
Here's the kicker. It's about about supply and demand.
Gasoline only comprises about 1% of natural gas' usage. The biggest usage has been heat, A/C, and the industrial sector. NY and CA are not industrial states. The Rust Belt and the Midwest are where most of the US' industrial sector is located. Most of the those regions are not shut down.
After a series of gas companies filed for bankruptcies and cut production, that means supply decreases dramatically. Even though the US is not back to 100%, the drop in demand is not as big as the drop in suppliers.
Think about it.
The need for heat and A/C will not go away completely. Eventually, that demand increases over time. If there are fewer suppliers, what happens to price? Furthermore, what are the chances that utility companies have to rethink their projected demands now that more states are opening? September might be a disappointing pullback due to the fact that demand may increase, but the number of suppliers may not. The recent hurricanes did not help with increasing the supply as well.
NG mainly has two paths. Either it pulls back to one of the supports and the launches or it breaks the 2.49 resistance. Either way, the end game is that NG may go higher than what bears want.
Remember, every bull and bear market cycle ends eventually. It was just time for NG's bear market to end.


Natural gaz shortAs I said Market will change direction
The market has responded to what we said yesterday.., So the first target Hit 2.30
So now the second target is 2.175
just wait .. protect your position
Mathematically it must go there
good luck
