Smart Money's Secret Signal - Commercials Loading Up on NattySmart Money's Secret Signal: Commercial Traders Are Loading Up on Natural Gas
The natural gas market is displaying compelling signals that suggest a potentially significant bullish trend change on the horizon. Through careful analysis of the Commitment of Traders (COT) report and several other key market indicators, we're seeing a convergence of bullish factors that warrant close attention from market participants.
Commercial Positioning at Multi-Year Extremes
Perhaps the most significant indicator is the current positioning of commercial traders, who are now more long than they've been in over three years. Commercial traders, often considered the "smart money" in commodity markets, tend to have the most comprehensive understanding of supply and demand dynamics. Their extreme long positioning is a powerful bullish signal that shouldn't be ignored.
Open Interest Analysis Confirms Bullish Outlook
Recent weeks have shown a notable increase in open interest concurrent with price declines. This relationship between price and open interest becomes particularly meaningful when we examine who's driving the increase of OI. In this case, the increase in open interest is primarily attributed to commercial traders building long positions – a highly bullish indication that suggests strong hands are accumulating positions at current price levels.
Contrarian Indicators Support the Bullish Case
Several contrarian indicators are aligning to support the bullish thesis:
-Investment advisor sentiment is currently very bearish, which historically has been a reliable contrarian indicator.
-Small speculators are showing extreme short positioning, and this group tends to be wrong at market extremes.
-Natural gas is undervalued when compared to historical relationships with gold and U.S. Treasuries.
Technical Confirmation Signals
The technical picture is adding weight to the bullish case:
-The Average Directional Index (ADX) has triggered a buy signal, dropping below 20 while commercials shifted to extreme long positioning.
-A bullish spread divergence has emerged between front-month and second-month contracts, implying immediate commercial demand for the front month, which is bullish.
-A major weekly bullish divergence has recently confirmed, suggesting potential for significantly higher prices.
Market Structure and Timing
While these indicators paint a compelling picture for higher natural gas prices, it's crucial to understand that this analysis doesn't necessarily call for immediate long positioning. Rather, it suggests that the market is fundamentally "setting up" for an upward move. Traders should wait for confirmation through a daily bullish trend change before considering positions.
The Power of COT Analysis in Trading
The Commitment of Traders report remains one of the most powerful yet underutilized tools in market analysis. Understanding how to interpret this data, particularly when combined with other technical and fundamental indicators, can provide traders with a significant edge in the markets. While many traders focus solely on price action or technical indicators, the COT report offers unique insights into the positioning of the market's most informed participants.
Ready to master the art of COT analysis and gain access to professional-grade market insights? Reach out to us today to take your trading to the next level.
Risk Disclaimer
IMPORTANT: The analysis provided in this article is for educational and informational purposes only and should not be construed as investment advice or a recommendation to buy or sell any security or derivative. Trading natural gas futures, options, or any other financial instruments involves substantial risk of loss and is not suitable for all investors. The market analysis presented here represents the opinion of the author based on the data available at the time of writing, but markets are dynamic and can change rapidly.
Past performance is not indicative of future results. The indicators and analysis techniques discussed in this article may not work in all market conditions and should not be relied upon as the sole basis for any investment decision. Before trading, you should carefully consider your investment objectives, level of experience, and risk appetite. You should only trade with money you can afford to lose.
It is strongly recommended that you conduct your own research and due diligence before making any investment decisions. You should also consult with a licensed financial advisor or broker regarding your specific situation. The author and the trading community mentioned may have positions in the securities discussed and may trade in these securities at any time.
Ng1

Natural Gas Oil, Dollar, Silver, Gold Price ForecastNatural Gas stock Bulls PEPPERSTONE:NATGAS Support & Resistance Guide
AMEX:USO Oil Stock Forecast
TVC:DXY US dollar Stock Forecast
Gold OANDA:XAUUSD Stock Forecast
Silver OANDA:XAGUSD

Natural Gas still coiling! breakdown or breakout?Hello Traders
In This Chart NATGAS HOURLY Forex Forecast By FOREX PLANET
today NATGAS analysis 👆
🟢This Chart includes_ (NATGAS market update)
🟢What is The Next Opportunity on NATGAS Market
🟢how to Enter to the Valid Entry With Assurance Profit
This CHART is For Trader's that Want to Improve Their Technical Analysis Skills and Their Trading By Understanding How To Analyze The Market Using Multiple Timeframes and Understanding The Bigger Picture on the Charts
Natural Gas is Ready For a Commercially Driven Bull MoveNatural gas is nicely setup for longs if we get a confirmed bullish trend change on the daily.
-Extreme commercial long positioning (most long they've been in the last 3 years) - bullish.
-Investment advisor sentiment very bearish - which is actually bullish.
-Undervalued vs gold & treasuries - bullish.
-ADX under 40 while commercials got extremely long - bullish.
-Bullish spread divergence between front month and next month out - bullish.
-Small specs at extreme in short positioning - bullish.
-True seasonal & some cycles are not supportive of going long, but these are the last things I look at. Enough indicators are supporting longs that I'm not going to worry about this.
-Bullish momentum divergence has triggered on some high timeframes, implying much higher prices are on the cards for Natty. There is also some smaller bullish weekly divergence currently setup (but not confirmed).
Have a good week.

NATGAS: Bears Will Push
The charts are full of distraction, disturbance and are a graveyard of fear and greed which shall not cloud our judgement on the current state of affairs in the NATGAS pair price action which suggests a high likelihood of a coming move down.
❤️ Please, support our work with like & comment! ❤️

Will the Perfect Storm in Natural Gas Markets Lead to a New EnerIn an era of unprecedented global energy transformation, the natural gas market stands at a critical juncture where geopolitical tensions, technological advancement, and infrastructure development converge to create a potentially game-changing scenario. The ongoing Middle East crisis, particularly the Israel-Iran tensions threatening the Strait of Hormuz, could reshape energy flows and trigger a cascade of effects across interconnected global energy markets, potentially forcing a fundamental reassessment of natural gas's role in the global energy mix.
A seismic shift is approaching in North American markets with LNG Canada's anticipated 2025 launch, which promises to revolutionize Canadian gas pricing dynamics and global market access. This transformation coincides with an extraordinary surge in potential demand from AI and data centers, projected to consume between 3 and 30 billion cubic feet per day of additional North American gas. Such technological evolution, coupled with Asia's growing appetite for cleaner energy sources, suggests a structural reformation of traditional gas flow patterns and pricing mechanisms.
The convergence of these factors presents both challenges and opportunities for market participants. While weather patterns and storage dynamics continue to influence short-term price formation, longer-term strategic considerations are increasingly dominated by infrastructure development, market access, and geopolitical risk management. As the industry adapts through strategic hedging, infrastructure investment, and consolidation, the natural gas market appears poised for a period of dynamic evolution that could fundamentally alter its global value proposition and establish a new paradigm in energy markets.

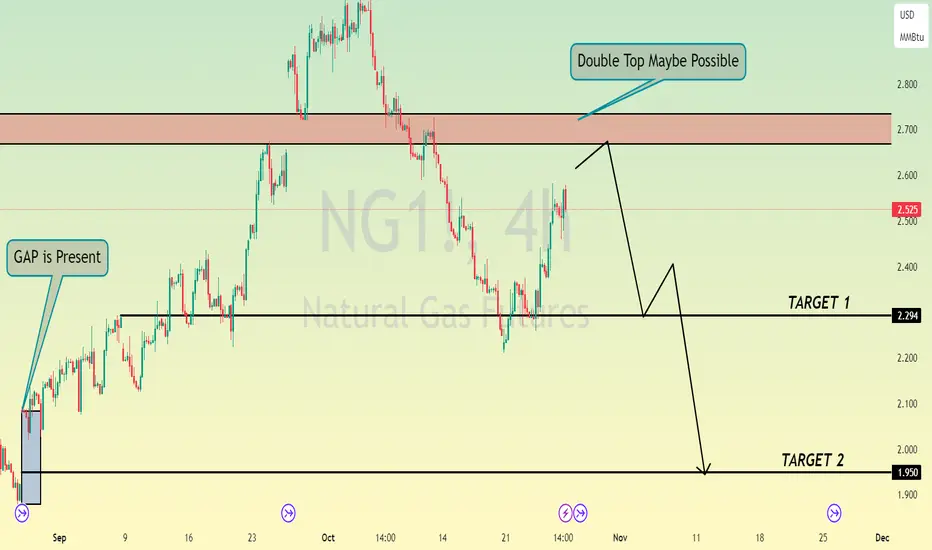
NATGAS RESISTANCE AHEAD|SHORT|
✅NATGAS is going up now
But a strong resistance level is ahead at 2.55$
Thus I am expecting a pullback
And a move down towards the target at 2.40$
SHORT🔥
✅Like and subscribe to never miss a new idea!✅

NGAS cup and handle / inverse HSForming a bullish inverse HS, or a cup and handle. If the trend line is finally broken, PT 3.50$ and 4.20$ in the horizon, NGAS usually spikes around year end due to increasing storage

NATGAS Local Risky Long! Buy!
Hello,Traders!
NATGAS has hit a horizontal
Support level of 2.20$ from
Where we are seeing a bullish
Rebound and we will be
Expecting a further move up
Buy!
Like, comment and subscribe to help us grow!
Check out other forecasts below too!

Natural Gas still coiling! breakdown or breakout?Hello Traders
In This Chart NATGAS HOURLY Forex Forecast By FOREX PLANET
today NATGAS analysis 👆
🟢This Chart includes_ (NATGAS market update)
🟢What is The Next Opportunity on NATGAS Market
🟢how to Enter to the Valid Entry With Assurance Profit
This CHART is For Trader's that Want to Improve Their Technical Analysis Skills and Their Trading By Understanding How To Analyze The Market Using Multiple Timeframes and Understanding The Bigger Picture on the Charts

Natural Gas Oil, Dollar, Silver, Gold Price ForecastNatural Gas stock Bulls PEPPERSTONE:NATGAS Support & Resistance Guide

NATGAS RISKY LONG|
✅NATGAS retested the strong support level of 2.215$
After trading in a local downtrend from some time
Which makes a bullish rebound a likely scenario
With the target being a local resistance above at 2.331$
LONG🚀
✅Like and subscribe to never miss a new idea!✅

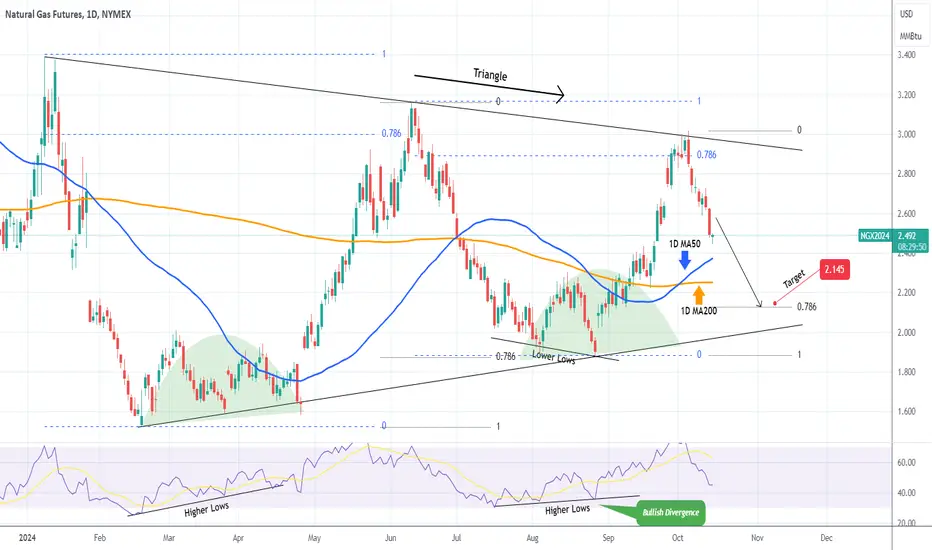
NATURAL GAS on a Bearish Leg. Still a sell signal.Natural Gas (NG1!) gave us an excellent buy opportunity last time (August 29, see chart below) and easily hit our 2.900 Target:
Once it hit the 0.786 Fibonacci retracement level (blue) it formed a Lower High at the top of the Triangle pattern and got rejected. The previous Lower High rejection that started the Bearish Leg, bottomed on the Higher Lows trend-line of the Triangle on the 0.786 Fib (black trend-line).
As a result we remain bearish on NG, targeting 2.145 (0.786 Fib).
-------------------------------------------------------------------------------
** Please LIKE 👍, FOLLOW ✅, SHARE 🙌 and COMMENT ✍ if you enjoy this idea! Also share your ideas and charts in the comments section below! This is best way to keep it relevant, support us, keep the content here free and allow the idea to reach as many people as possible. **
-------------------------------------------------------------------------------
💸💸💸💸💸💸
👇 👇 👇 👇 👇 👇
Natural Gas Oil Dollar Silver Gold Price ForecastNatural Gas stock Bulls PEPPERSTONE:NATGAS Support & Resistance Guide

NATGAS: Long Signal Explained
NATGAS
- Classic bullish setup
- Our team expects bullish continuation
SUGGESTED TRADE:
Swing Trade
Long NATGAS
Entry Point - 2.628
Stop Loss - 2.519
Take Profit - 2.824
Our Risk - 1%
Start protection of your profits from lower levels
❤️ Please, support our work with like & comment! ❤️

NG1: Will We See a Rebound or a Breakout?🔍 Analyzing NG1: We are approaching a critical support level that could determine our next move. Option 1: A rebound from this level could present a strong buying opportunity, indicating a potential uptrend. Option 2: If we break below this support, the next level could act as a key pivot point, prompting a reevaluation of our strategy. I’m closely monitoring for long entry opportunities to capitalize on any bullish reversals. Let's stay sharp!

NATGAS Sellers In Panic! BUY!
My dear followers,
I analysed this chart on NATGAS and concluded the following:
The market is trading on 2.628 pivot level.
Bias - Bullish
Technical Indicators: Both Super Trend & Pivot HL indicate a highly probable Bullish continuation.
Target - 2.778
Safe Stop Loss - 2.529
About Used Indicators:
A super-trend indicator is plotted on either above or below the closing price to signal a buy or sell. The indicator changes color, based on whether or not you should be buying. If the super-trend indicator moves below the closing price, the indicator turns green, and it signals an entry point or points to buy.
———————————
WISH YOU ALL LUCK

Natural Gas | Oil, Dollar, Silver, Gold Price ForecastNatural Gas stock Bulls PEPPERSTONE:NATGAS Support & Resistance Guide
AMEX:UNG Stock Forecast
AMEX:USO Oil Stock Forecast
TVC:DXY US dollar Stock Forecast
Gold OANDA:XAUUSD Stock Forecast
Silver OANDA:XAGUSD

NATGAS Trading Opportunity! BUY!
My dear subscribers,
NATGAS looks like it will make a good move, and here are the details:
The market is trading on 2.831 pivot level.
Bias - Bullish
Technical Indicators: Both Super Trend & Pivot HL indicate a highly probable Bullish continuation.
Target - 2.922
About Used Indicators:
The average true range (ATR) plays an important role in 'Supertrend' as the indicator uses ATR to calculate its value. The ATR indicator signals the degree of price volatility.
———————————
WISH YOU ALL LUCK

NG1! SHORT FROM RESISTANCE
Hello, Friends!
NG1! uptrend evident from the last 1W green candle makes short trades more risky, but the current set-up targeting 2.420 area still presents a good opportunity for us to sell the pair because the resistance line is nearby and the BB upper band is close which indicates the overbought state of the NG1! pair.
✅LIKE AND COMMENT MY IDEAS✅

NATGAS: Bulls Will Push
Our strategy, polished by years of trial and error has helped us identify what seems to be a great trading opportunity and we are here to share it with you as the time is ripe for us to buy NATGAS.
❤️ Please, support our work with like & comment! ❤️

Natural Gas Faces Key Resistance at 3.000 – Bearish SetupNatural Gas futures are currently at a critical juncture, with various technical indicators pointing to a potential bearish trend. Traders and analysts are closely watching the price action as it hovers near a significant resistance level, and the upcoming week could provide further clarity on the direction of the market. While technical signals suggest a downside, broader market dynamics such as supply-demand factors and geopolitical tensions could influence price movements.
Based on a comprehensive technical analysis of Natural Gas futures, the commodity is facing a significant resistance level around 3.000, aligning with a strong downward trendline. This suggests a potential bearish movement in the upcoming week, with a key target of 2.527 in sight.
A critical observation on the RSI (Relative Strength Index) front indicates further bearish pressure. The multiple RSI analysis, particularly focusing on the 7-period RSI, reveals that it is extending a large distance from other RSI levels, reinforcing a downward bias. This divergence in the RSI suggests that momentum is clearly favoring the bears, pointing to a potential price decline.
Additionally, the weekly chart provides further evidence of a bearish setup. A well-established trendline highlights continued resistance to upward movement. Furthermore, the formation of a double-top pattern on the weekly chart adds to the bearish sentiment, as this is typically a reversal pattern that indicates a shift from bullish to bearish conditions.
In conclusion, technical indicators, including the downward trendline, RSI divergence, and the double-top pattern, all suggest that Natural Gas may see further downside, with a target of 2.527 looking increasingly likely. However, supply and demand dynamics and geopolitical events, such as Middle East tensions, could influence the market and potentially alter this technical outlook. Traders should closely monitor these factors, as any disruption in supply chains or changes in demand may trigger a shift in price direction.

Really as Simple as it seems- Very simple case for NG bulls on a long (2-5 year) basis. Macro trend simplified with nothing more than trendlines
- Shorter term bear play will be described in another post
- NG appears to be making a Jesse Livermore accumulation megaphone pattern as it did in the 90s/2000s
1) red long term downtrend line broken to the upside and retested beautifully.
2) weekly chart shows higher highs and higher lows beginning to develop on a longer time frame after the nasty drop from 2021 highs to lows which bottomed in the 2$ vicinity.
3) Shorter term black trendline still providing resistance upon the 3rd test. Confirmation of a breakout here is yet to be seen (this was where the short play revolves around)
4) major resistance around the upper red horizontal line at roughly 3.19. Lesser resistance just below red horizontal line.
Conclusion: NG has been and continues to be extremely cheap historically.
As NG resolves these resistance zones it appears a 1-2-3-4-5-6-7-8 megaphone pattern will generate as NG eventually reaches the 12-14$ area within the next few years.
Natural Gas expected to tag lower trendline and upper trendline of megaphone pattern accordingly with seasonality and resistance levels along the way.
Volatility is expected as the cylinder widens and price action becomes more erratic, though long term, the trend is bullish, but the Widowmaker is not for the faint of heart. Scaling in, and buying near lower trendline tags is likely most likely to increase probability of maximum profit.
