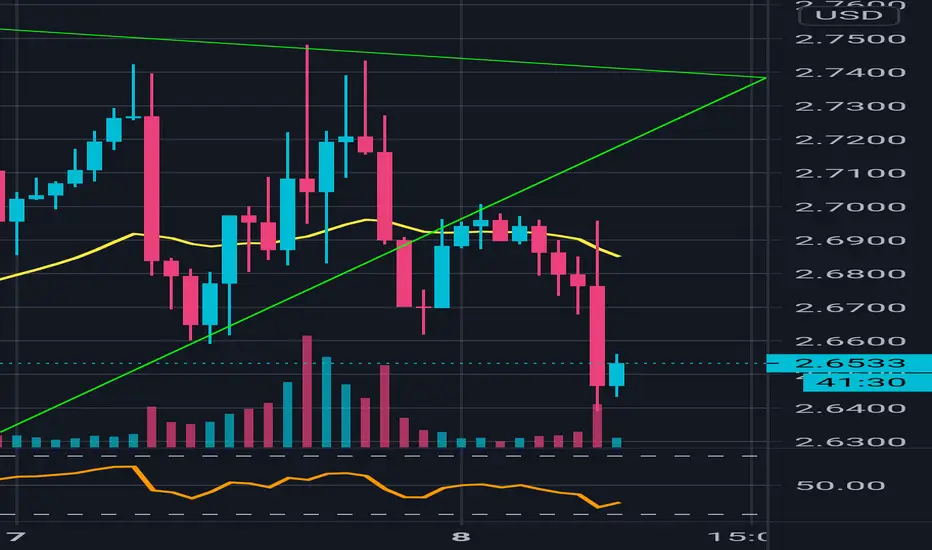
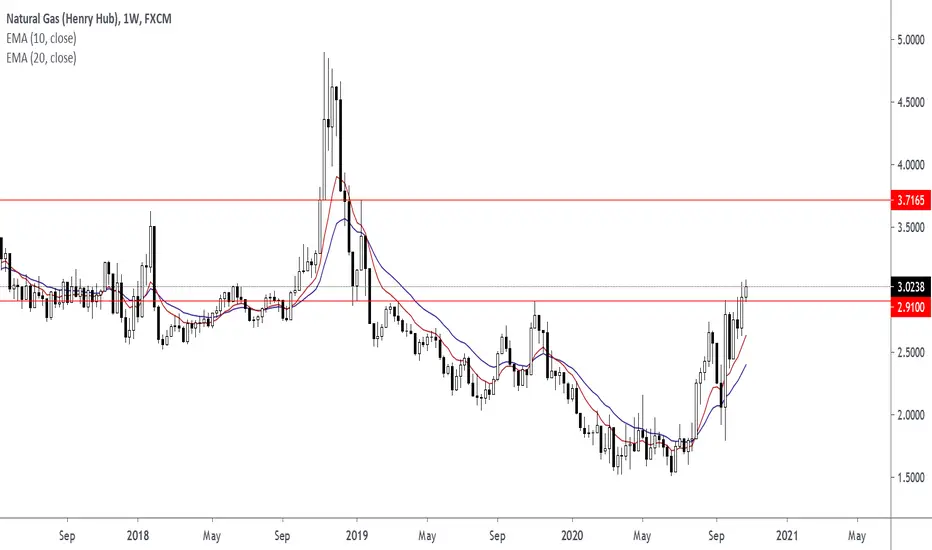
NATURAL GAS – Week 21 – Pullback started.Natgas started the trading week with a bullish gap, making a new top, but soon after it started the bearish move that we were expecting.
So far so good. The trendline has been broken, and if we get a correction around this area, then we expect this move to continue towards the support level, having a great chance to break it.
Trade with care.
Best regards,
Financial Flagship
Disclaimer: The analysis provided is purely informative and it should not be used as financial advice. Remember that you need a plan before you start trading; so, take this knowledge and use it as a guidebook that will ultimately help you understand the market and easily predict your next move.
NGAS

Wednesday: Natural Gas - Week 18I will update my idea as the trade progresses if any changes occur and my analysis is wrong, or need to be adapted to the new development of price-action.
-----------------------------------------------------------------------------------------------------------------------
-----------------------------------------------------------------------------------------------------------------------
SMASH that follow button! 👍
💡 Leave a comment and/or message me on how I can improve and provide better content, I'm open to suggestions to create a better experience for you!
RISK DISCLAIMER: Please be advised that I am not telling anyone how to spend or invest their money. Take all of my videos as my own opinion, as entertainment, and at your own risk. I assume no responsibility or liability for any errors or omissions in the content of this channel. This content is for educational purposes only and is not tax, legal, financial, or professional advice. Any action you take on the information in this video is strictly at your own risk. We, therefore, recommend that you contact a personal financial advisor before carrying out specific transactions and investments. There is a very high degree of risk involved in trading. Past results are not indicative of future returns. Inotfancy.com and all individuals affiliated with this channel assume no responsibility for your trading and investment results.

Scenarios: Natural Gas - Week 18I will update my idea as the trade progresses if any changes occur and my analysis is wrong, or need to be adapted to the new development of price-action.
-----------------------------------------------------------------------------------------------------------------------
-----------------------------------------------------------------------------------------------------------------------
SMASH that follow button! 👍
💡 Leave a comment and/or message me on how I can improve and provide better content, I'm open to suggestions to create a better experience for you!
RISK DISCLAIMER: Please be advised that I am not telling anyone how to spend or invest their money. Take all of my videos as my own opinion, as entertainment, and at your own risk. I assume no responsibility or liability for any errors or omissions in the content of this channel. This content is for educational purposes only and is not tax, legal, financial, or professional advice. Any action you take on the information in this video is strictly at your own risk. We, therefore, recommend that you contact a personal financial advisor before carrying out specific transactions and investments. There is a very high degree of risk involved in trading. Past results are not indicative of future returns. Inotfancy.com and all individuals affiliated with this channel assume no responsibility for your trading and investment results.

NGAS - Week 14 - Analysis and ThoughtsThe analysis to the down-side is working out, and price-action is confirming more down to retest lows. From a pattern perspective, breaking the lows will result in a 'regular flat' structure.
The worrying trend that I see is that volume is decreasing while the price is going lower and lower, this is not an indication of selling strength, and therefore, I will be monitoring the price closely when we retest the lows.

NGAS - Daily Analysis and ThoughtsFor now I would say the higher probability move is to go down and retest the low, based on how the volume is behaving. But have to be a bit more patient and monitor how price develops at the recent low.

NGAS - Weekly Analysis and ThoughtsIf we are to continue up the following weeks to break the top, (1) a spike in volume to indicate buyers entering the market would be confirming that the price is going further up.
(2) I want to see volume and price strength on the lower timeframes showcasing buyers entering, and continuing to push the up-trend further, so 'higher highs, lower highs'.

Natural Gas trend confirmedBull trend break confirmed with 3 day below candle, expecting to head south searching for first support.

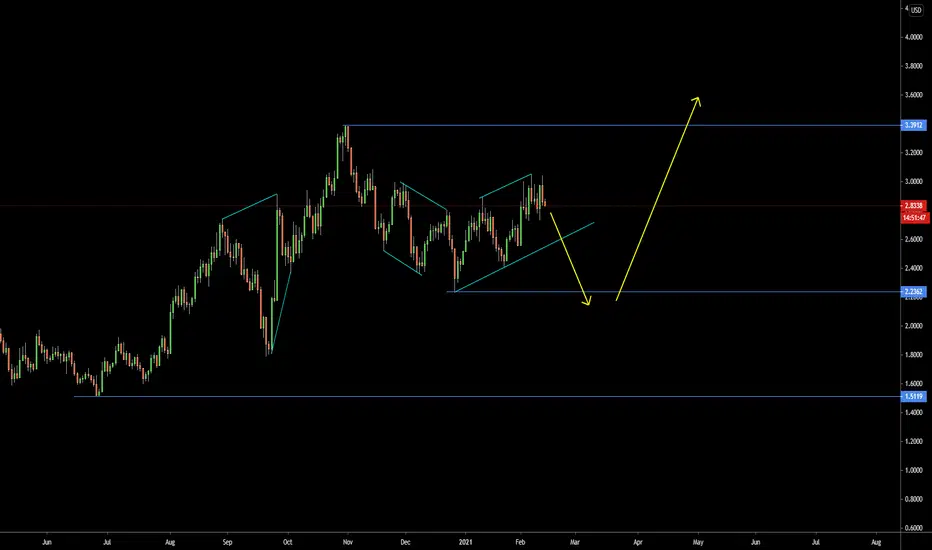
NATGAS - is this the scenario?NGAS was not able to break and hold above 3 dollars, it tested 3 times, and failed. We might be looking at a possible completed 3-wave structure - which means the next move could go down and test previous lows.
Note to self: NGAS is quite fun to trade, analyze and set up possible IF-then scenarios since it's moving very sharply and a lot, this creates lots of trade-opportunities.
Natural Gas: Sell Hi again traders
Hi I think gas price will be in free fall.
Short positions only at market
Stop: 2.89
Target: 2.47


Natural gaz just broke the uptrendline There is a high probability If Ngaz can break 2.6000 will continue to 2.4000 dollars

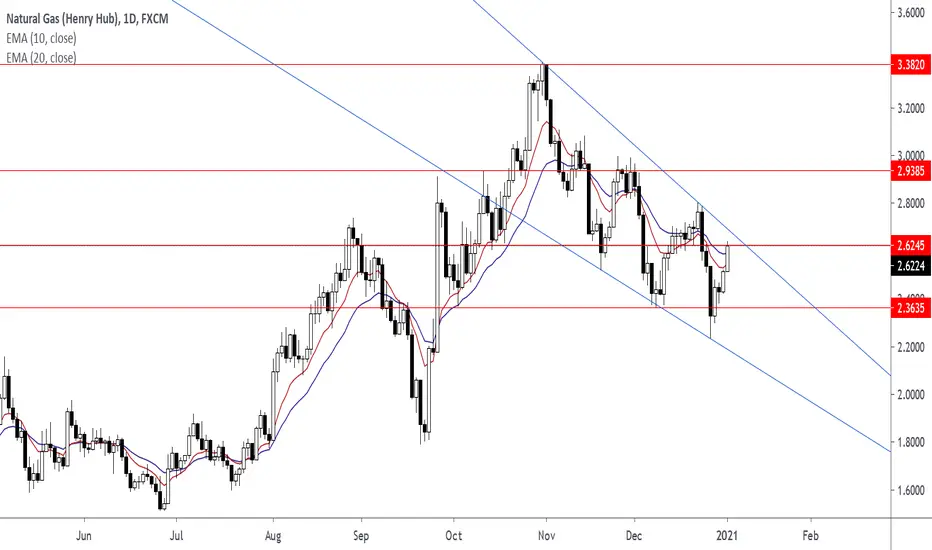


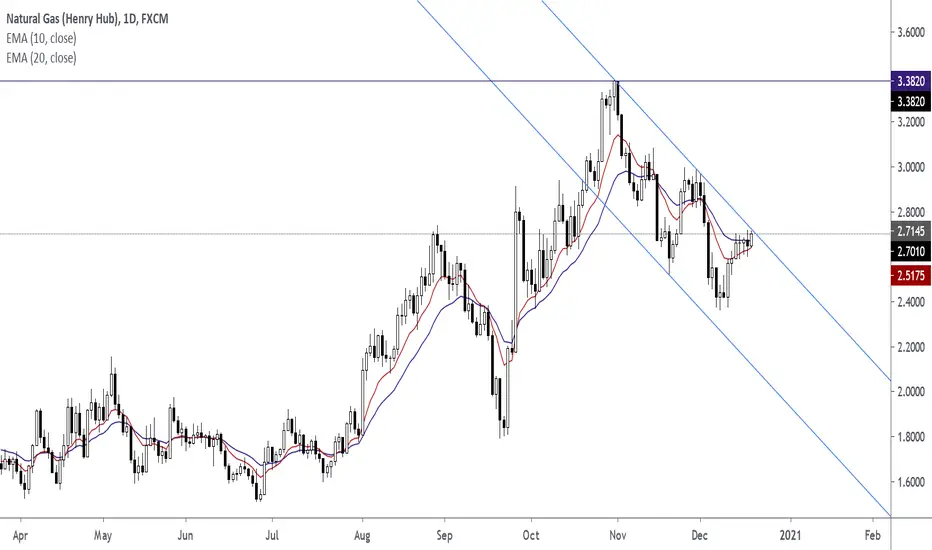


💡 NATGAS. Weekly Technical Analysis UpdateMidterm forecast:
While the price is below the resistance 3.000, beginning of downtrend is expected.
We make sure when the support at 2.250 breaks.
If the resistance at 3.000 is broken, the short-term forecast -beginning of downtrend- will be invalid.
Technical analysis:
While the RSI resistance #1 at 52 is not broken, the probability of price increase would be too low.
A trough is formed in daily chart at 2.378 on 12/08/2020, so more gains to resistance(s) 2.700 and maximum to Major Resistance (3.000) is expected.
Price is below WEMA21, if price rises more, this line can act as dynamic resistance against more gains.
Relative strength index (RSI) is 42.
❤️ If you find this helpful and want more FREE forecasts in TradingView
. . . . . Please show your support back,
. . . . . . . . Hit the 👍 LIKE button,
. . . . . . . . . . Drop some feedback below in the comment!
❤️ Your Support is very much 🙏 appreciated! ❤️
💎 Want us to help you become a better Forex trader ?
Now, It's your turn !
Be sure to leave a comment let us know how you see this opportunity and forecast.
Trade well, ❤️
ForecastCity English Support Team ❤️


Natural Gas longnatural gas long, mans ate a burrito and farted up coal it was so black nigga asked the doctor for a new hole

Perfect Falling Wedge Pattern: Bullish FormationThis is on the 2 HR chart on October Contract. Quite a bearish week. I still believe we are headed up. Very short time frame to have a full blown bearish continuation with winter right on the corner and demand expected to start rising with cooler temperatures. Also Hurricanes and storm season is upon us. Usually we see spikes in prices in September, October & November.
We’re reaching very strong support Zones. I believe this could have been a necessary correction for the bullish trend to come. I expect we go to somewhere around 2.7-2.8 where massive resistance is. We could go somewhat lower this week to where the scribbles are below the falling Wedge Pattern which gives us confirmation on a bullish run expected back to bullish trend upward lines.
