IS NATURAL GAS TOO CHEAP?expecting natural gas price to stabilize if equity markets can recover soon.
NGAS

Don't miss the great buy opportunity in NGASTrading suggestion:
. There is a possibility of temporary retracement to suggested support line (1.90). if so, traders can set orders based on Price Action and expect to reach short-term targets.
Technical analysis:
. NATURAL GAS is in a range bound and the beginning of uptrend is expected.
.The price is above the 21-Day WEMA which acts as a dynamic support.
. The RSI is at 51.
. While the RSI resistance #1 at 43 is broken, so the probability of the beginning of an uptrend is increased.
Take Profits:
TP1= @ 2.09
TP2= @ 2.21
TP3= @ 2.49
SL= Break below S2

NGAS testing the monthly supportat the moment of writing, NGAS is at the 1.845 level and is forming an accumulation level where an upside breakout will evolve.
we are closely watching for fakeouts on the top and bottom.


NGAS: Natural gas is a low risk buyI think Nat Gas is bottoming here for a while. It can swing up strongly, if it holds up. We have 4 days without going any lower, soon to be 5, the next move is going up and retesting the key level at 2.27, if holding over it, the next level is 2.88.
We have 5 months already, where price stayed higher than the lowest low which took place back in August 2019. A higher high by February would be extremely constructive for $NGAS.
A 3 times the daily Average True Range indicator value stop loss distance would give long positions enough room to breathe, in case it didn't yet bottom in the daily chart. Normally this is a good stop loss methodology, to buy into mid term positions and avoid short term noise.
Cheers,
Ivan Labrie.

Who Passed The Gas ?winter coming up, Natural Gas spot has already broken out - NGS appears to be lagging, presents a good long opportunity
low liquidity/ low market cap adds to the risk reward balance
The guys on TIP The Investor's Podcast typically have good calls, look at the BBBY returns (from $9.00)

Natural Gas Gathering Momentum To RallyNatural gas is now gathering momentum to start impulsive wave. A break below 2.036 will mean a re-test of 1.78
NB
- Let emotions and sentiments work for you
-ALWAYS Use Proper Risk Management In Your Trades
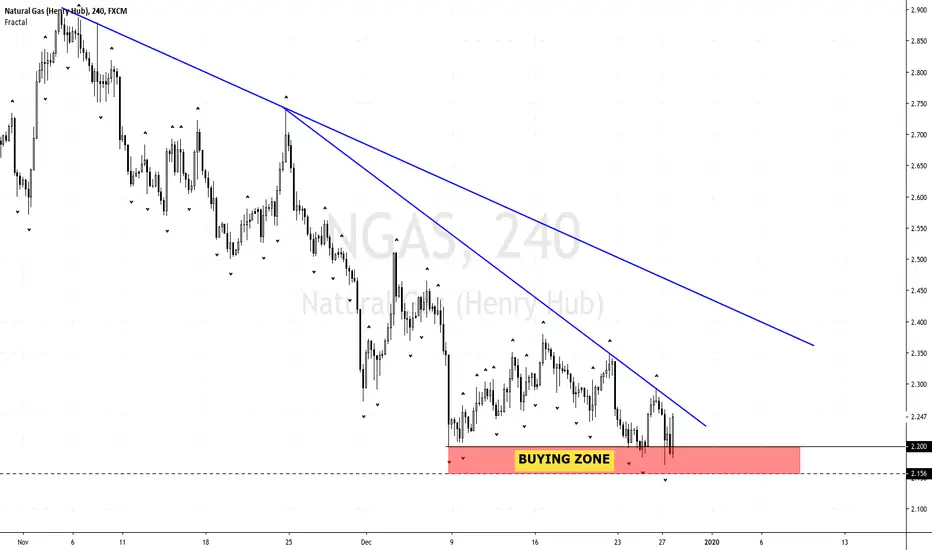
Short on Natural GasNGAS (Henry Hub) has unsuccessfully tried to break the DEMA 31 line, as highlighted in the chart in the ellipse. After the unsuccessful attempt, it broke down the channel until the 0.786 Fibonacci retracement. Our assumption is that it will continue the downfall until the support line at 2.197. After that, it will be safe to close half or more of the trade, because there is a good chance of a pullback there.
If you decide to short and willing to take the additional risk, shorting UGAZ will be better than long on DGAZ because of the lower price of UGAZ (and subsequently- lower fees).
More on our website: iam-unchained.com


NATGAS SHORT?Is natural gas going down below a 2$ mark?
If so, a great move up could appear from there.

Natural Gas sell can go away soon, good time to buyHello Traders, today's daily candle is showing us that there is a good price drop in natural gas , but the volume isn't the favoring the price action anyway which maybe an indication that this could be one of the last sells left in the current trend, yes there can be more sells we must remain open to that but currently the move isn't supported by the volume and the price is also coming to our last target of the short which we opened few days ago.
So, we will consider long for now, there are few possible scenarios i believe:
1. The price can bounce from the current blue channel in which it is, but it is very less likely less than 3-4% IMO
2. The price will come in the green box which will be our ideal buy zone for the long run, also please don't be too aggressive look for price action in that area to be specific i will look for buy around 2.18 or 2.16$ range area, but anything below 2.2 is good its a good even number for the market.
3. If it reach that red zone area it will be a surprise for me personally, ideally if i see good price action to the upside in the green area i will use this red zone as stop but if that isn't the case i.e if we don't get good buy action in the green zone i will look for buy here in the red zone, but i think this scenario will also be less likely IMO less than 10%.
So personally i am with scenario 2 and maximum chances are there for us.
Happy Thanks Giving!
May the markets be with you.


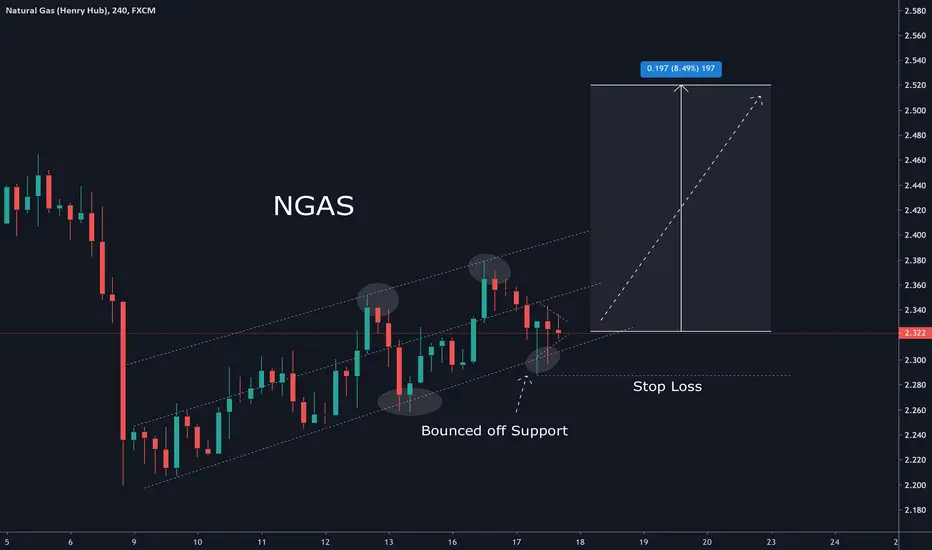
Nat Gas - Follow up - Correction before continuing higher ?We can count 5 waves up now for potential wave 3.
Following soon will be a wave 4 consolidation followed by a continuation higher as wave 5.
Because wave 2 was a ZigZag, we can assume this wave 4 to be a Flat or a triangle making just a shallow retracement of wave 3.
So, I recommend taking at least partial profits.
Because waves 4 are so tricky it's not a good idea to try and short them, so, better keep your cash on the side for when better opportunities arise.
! If price starts to fall sharply and goes below 2.38, the count gets negated.
Previous post :
