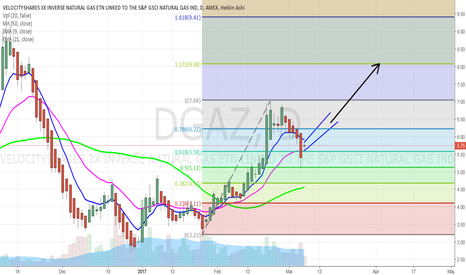
DGAZ going to $8DGAZ formed bullish reversal doji today, and NGJ2017 formed bearish reversal doji. Fib extension points us to $8 on DGAZ
NGAS
Natural Gas 2 Small Bullish Bats; Getting In On Large Bat This idea is in accordance with my larger term view of the very large Bullish Bat which completed last week @2.547 (idea linked below).
I missed that entry but patiently waited for a new pattern. Now I have found 2 bullish bat patterns to get me in to the (hopefully) longer term move. One advantage to this method is that the risk is much less than with the larger Bat...stop loss for me here is the red line @ 2.529.
I have entered at the first bat...will add a second contract if the price reaches the second Bat. Wish me luck!
Natty Gas descending wedge formationPrice bounced off of the upper boundary within the wedge and appears to be forming a head and shoulder pattern on the daily/weekly.
We should pullback to the lower boundary and support at the 2012 and 2016 major lows before turning around and breaking out to the upside.
One to watch this year!
NGAS: Keep an eye on support here$NGAS could resume the uptrend here, and might be an interesting setup if we get a bottoming pattern in the daily chart. I took a small risk aggressive long on Friday, and will monitor it to reenter if stopped, if this trade remains valid. Upside is significant, close to $5, in the long run, but it might a while to base around here firs, which would be a great thing to observe take place within the next 3 weeks.
If for some reason we are to break support, we could see rapid fall to the low volume support level outlined in green. If we do test that, that'd be a low risk long opportunity, and also a do or die situation for bulls, so, don't hesitate on going long with a tight stop if that level is retested. In this timeframe on chart, I'd like to see the bar close above support, and form a smaller range bar, and eventually break a previous bar high, before rallying again. This can take the shape of a consolidation after a rapid spike in the daily, which would be great, since it would give us further low risk long opportunities.
Cheers,
Ivan Labrie.
NGAS: LONGAll technical indicators are oversold with signs of reversal on Daily and Weekly time frames. Additionally, we touched th 200d MA and bounced off of it.
Be careful though, this might be a short lived bull run as we might fail to break 3.1 and thus create opportunity for a leg down.
Thus I will set my first target at 3.1 and wait to see if there are signs of weakness.
Possible big NG explosion upwards.Three touches on each side of the wedge, perfectly touched the uptrend line, as well as a storage report coming out after market close tomorrow. Due to falling wedge and bull price action since last march i am leaning long-side here, but do your own due diligence and watch the movement after the report. If price takes off upwards i would expect quite the move here.
NGAS: Soon there will be a possibility for a long positionBased on Daily and Weekly technical analysis as well as fundamental I think there is a possible trade to the long side for NGAS in the upcoming weeks. I will post a more in-depth analysis when I see a window to enter the trade. For now I am keeping some cash to be ready.
Can Natural Gas challenge 4.050 or 4.450Since the first of November, NGAS has had a nice run up but now appears to be pulling back for a correction. As part of my learning Renko Charts, I've created three views of NGAS:
Daily TF: source/close | style/traditional | blksz/.050
2Hr TF: source/close | style/traditional | blksz/.025
5Min TF: source/close | style/traditional | blksz/.010
With the price above the 20, 50, and 200 EMA and with the +DI of the DMI dominant, the overall trend of this market is up. However, looking at the 2Hr and 5Min charts, it looks like there is a correction in play. Once this correction concludes, NGAS can begin it's move up to challenge the 4.050 or even the 4.450 level.
On the 2Hr chart, the charcoal box is what the 5Min chart expands out to. Some key things to note and/or watch:
5Min price has moved off the 200EMA
5Min TSI has moved below 0 along with the -DI of the DMI dominant
2Hr chart is now correcting and attention should be paid to the TSI. If it breaks below 0, then wait for it to move back above 0 along with the PSAR signaling a buy
For now, on side until price and indicators signal that up move is beginning to continue