NaturalGas enters resistance zone. H4 25.11.2024⛽️ NaturalGas enters resistance zone 📉
On gas the price has entered the zone of strong resistance 3.51-3.63 from which I expect a new exit of the price down. Now on the comeback a false break above is possible, but in general the zone for selling is strong. I aim for a bounce down to 3.0 and 3.15, and there will clarify. The main support is near 3.0 and there is the boundary of the ascending channel from which they can bounce up again.
FX:NGAS
NGAS

Natural Gas , is there still potential that can be acquired or?Hi guys, let's take a look into natural gas which has been quite underwhelming for the past probably 6-12 months without any significant movement. The only recent interest shift in the price is the previous resistance line becoming a Resistance Line siting at the level of 3.20 and the formation of a new stable Support Line at the level of 2.60-2.70 level. The main drive into the prices of Natural Gas has been the Hurricane Helene disrupting the overall supply chain in the U.S. and the recent news coming from Russia and it's change to the Nuclear Weapon legislation , after Ukraine received the green light from the U.S. and the U.K. to use their current provided arsenal of weapons. As of now the main moving power of Natural Gas is Europe and its supply of NG. It has been confirmed that Europe has enough storage of Natural Gas to take care of the winter, but as we are seeing November is starting to become colder and December&January is expected to be significantly colder so there would definitely be higher demand than usual. My personal input on this opportunity is in two options.
Option 1 strong entry , from the current level of 3.50 with a target of
Target 1 : 4.00
Target 2 : 4.25
Option 2 calculated entry , wait for the price to drop down and retest the resistance line of 3.20 and then follow up with the same targets.
Target 1 : 4.00
Target 2 : 4.25

Natural Gas BULLISH REVERSAL!!!All eyes on NYMEX:NG1! !!! Macro chart's about to confirm a bullish trend as price is making lower highs and higher highs. Ideally we want a strong close above $3.6. Any retrace towards $2.5 should be a buy opportunity. HUGE FVG to the upside.

NG, prepping for a multi weekly gain come December 2023NG based on monthly data is registering very significant net buy volume at the current price range.
Seller's strength is certainly fading out based on thinning price volatility this past few days / weeks -- as shown on yellow price lines on chart.
NG is currently sitting at a strong major support at 2.0 to 2.5 area, a 1.0 FIB discount level -- this is where most buyers converge.
Initial trend shift has been spotted at the present price range.
Spotted at 2.50
TAYOR
Safeguard capital always.

Natural Gas still coiling! breakdown or breakout?Hello Traders
In This Chart NATGAS HOURLY Forex Forecast By FOREX PLANET
today NATGAS analysis 👆
🟢This Chart includes_ (NATGAS market update)
🟢What is The Next Opportunity on NATGAS Market
🟢how to Enter to the Valid Entry With Assurance Profit
This CHART is For Trader's that Want to Improve Their Technical Analysis Skills and Their Trading By Understanding How To Analyze The Market Using Multiple Timeframes and Understanding The Bigger Picture on the Charts
NGAS cup and handle / inverse HSForming a bullish inverse HS, or a cup and handle. If the trend line is finally broken, PT 3.50$ and 4.20$ in the horizon, NGAS usually spikes around year end due to increasing storage

NGAS - UniverseMetta - Signal#NGAS - UniverseMetta - Signal
D1 - Potential rebound from the level, after the impulse correction.
H4 - Formation of the 3rd wave with an exit from the descending channel. You can try to consider an entry from the current levels or wait for the formation of the pattern
Stop for the 2nd wave on H4.
Entry: 2.3492 - *2.3683
TP: 2.3953 - 2.5080 - 2.6169 - 2.8299
Stop: 2.3064

Natural Gas still coiling! breakdown or breakout?Hello Traders
In This Chart NATGAS HOURLY Forex Forecast By FOREX PLANET
today NATGAS analysis 👆
🟢This Chart includes_ (NATGAS market update)
🟢What is The Next Opportunity on NATGAS Market
🟢how to Enter to the Valid Entry With Assurance Profit
This CHART is For Trader's that Want to Improve Their Technical Analysis Skills and Their Trading By Understanding How To Analyze The Market Using Multiple Timeframes and Understanding The Bigger Picture on the Charts

NG1: Will We See a Rebound or a Breakout?🔍 Analyzing NG1: We are approaching a critical support level that could determine our next move. Option 1: A rebound from this level could present a strong buying opportunity, indicating a potential uptrend. Option 2: If we break below this support, the next level could act as a key pivot point, prompting a reevaluation of our strategy. I’m closely monitoring for long entry opportunities to capitalize on any bullish reversals. Let's stay sharp!

NGAS (Henry Hub) - NO LOSS Trade OpportunityFrom the highest of 10 mark till the lowest of 1.5.. at the moment Natural Gas is giving the golden opportunity to buy and accumulate for apparently 1-2 months of holding with a good reward of 1:4+.
This is literally a NO LOSS Trade but for those who can wait patiently for a golden reward
Good Luck!

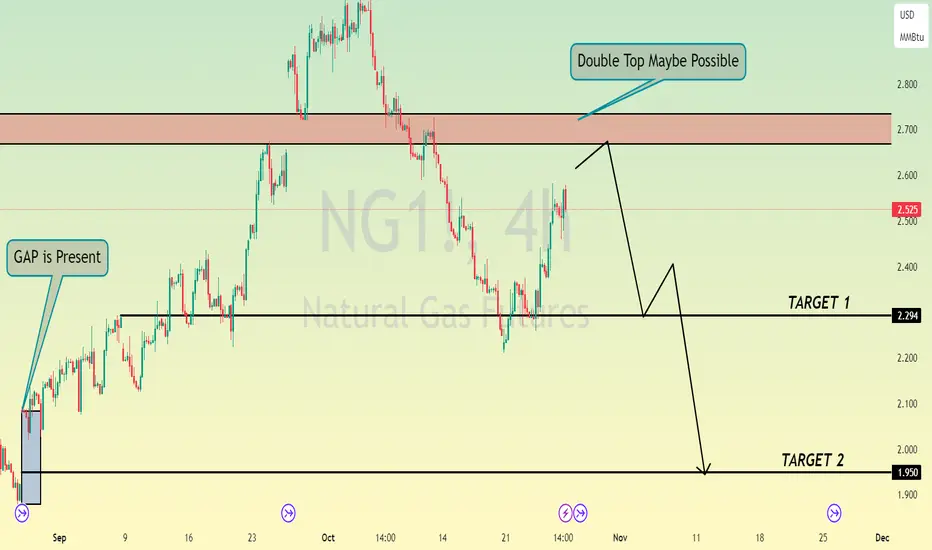
Natural Gas at Key Resistance: Rejection or Breakout?Hey traders! Natural Gas (GAZ) is currently testing a strong resistance level. There’s a chance we could see a rejection here, with the price pulling back toward the support level. If this happens, we could also see a gap fill at the support, making it a potential target zone.
Here’s the setup I’m watching:
Resistance Level: Price is testing resistance; we could see a rejection soon.
Support Level: A pullback could take us down to support, with a potential gap fill in that area.
Target Zone: Watch for price action around support as a potential entry point.
Stay sharp and trade wisely!

Natural Gas downside Target 2.500Natural Gas seen weekness on various time frame charts, as per our prediction and technical analysis Natural Gas downside Target 2.500

Waiting for NaturalGas to rise. H4 30.08.2024Waiting for NaturalGas to rise
Gas tried to break down to 2.00 twice and bought back twice.
And large volumes are now around 2.10 and defending.
If they are not pushed down, they may rise to the upper boundary of the flat to 2.30 and even 2.50.
Increased vertical volumes came in at the moments of buyback, which often coincides
with the culmination and turns the market.

XNG/USD "NATURAL GAS" Robbery plan in Long SideHola ola My Dear,
Robbers / Money Makers & Losers,
This is our master plan to Heist XNG/USD "NATURAL GAS" Mines based on Thief Trading style Technical Analysis.. kindly please follow the plan I have mentioned in the chart focus on Long entry. Our target is Red Zone that is High risk Dangerous level, market is overbought / Consolidation / Trend Reversal at the level Bearish Robbers / Traders gain the strength. Be safe and be careful and Be rich.
Note: If you've got a lot of money you can get out right away otherwise you can join with a swing trade robbers and continue the heist plan, Use Trailing SL to protect our money.
Entry : Can be taken Anywhere, What I suggest you to Place Buy Limit Orders in 15mins Timeframe Recent / Nearest Swing Low
Stop Loss : Recent Swing Low using 2h timeframe
Warning : Fundamental Analysis comes against our robbery plan. our plan will be ruined smash the Stop Loss. Don't Enter the market at the news update.
Loot and escape on the target 🎯 Swing Traders Plz Book the partial sum of money and wait for next breakout of dynamic level / Order block, Once it is cleared we can continue our heist plan to next new target.
Support our Robbery plan we can easily make money & take money 💰💵 Follow, Like & Share with your friends and Lovers. Make our Robbery Team Very Strong Join Ur hands with US. Loot Everything in this market everyday make money easily with Thief Trading Style.

Natural Gas Robbery Plan To Make and take MoneyMy Dear Robbers / Traders,
This is our master plan to Heist Natural gas based on Thief Trading style Technical Analysis.. kindly please follow the plan I have mentioned in the chart focus on Short entry. Our target is Green Zone that is High risk Dangerous level, market is oversold / Consolidation / Trend Reversal at the level Bullish Robbers / Traders gain the strength. Be safe and be careful and Be rich.
Note: If you've got a lot of money you can get out right away otherwise you can join with a swing trade robbers and continue the heist plan, Use Trailing SL to protect our money.
Stop Loss : Recent Swing High using 1h timeframe
Warning : Fundamental Analysis comes against our robbery plan. our plan will be ruined smash the Stop Loss. Don't Enter the market at the news update.
Loot and escape on the target 🎯 Swing Traders Plz Book the partial sum of money and wait for next breakout of dynamic level / Order block, Once it is cleared we can continue our heist plan to next new target.
Support our Robbery plan we can easily make money & take money 💰💵 Follow, Like & Share with your friends and Lovers. Make our Robbery Team Very Strong Join Ur hands with US. Loot Everything in this market everyday make money easily with Thief Trading Style.

Continued growth of NaturalGas H4. 23.08.2024Continued growth of NaturalGas
The price bounced perfectly from the margin zone
and confirmed the pattern Repositioning.
Further I expect an internal pullback and continuation of growth
to 2.35 and next target at 2.52.

Identifying Profit Points and Key Short Opportunities for NGNatural Gas has exhibited a bearish trend beginning on June 12, 2024, with prices opening at $3.200 per contract. Throughout July, the market saw significant profit-taking activities, with trading prices oscillating between $2.120 and $2.000 per contract. This price range was perceived as a strategic buying opportunity, particularly at the L3 pivot point level during August 2024.
Subsequently, prices encountered resistance at the R3 level, stabilizing at $2.320 for an extended period of ten days. This stagnation is likely attributed to institutional traders initiating short positions at this critical juncture, influencing the price dynamics.
Further analysis of the quarterly chart reveals a notable rejection at the L4 level; however, it is crucial to note that prices remain above this threshold. Should prices decline below the pivotal level of $2.250 per contract, a bearish stance is advisable, with potential targets set at the monthly L4 of $1.840 and the quarterly L5 of $1.820.
This analysis underscores the importance of vigilant monitoring of key resistance and support levels in the Natural Gas market to capitalize on potential trading opportunities.

NATGAS inverse H&SNATGAS creating an Inverted HS. First objective 2.80$.
Keep in mind there’s a larger inverted HS on the making, which could throw the price beyond 4$

NATURAL GASCAPITALCOM:NATURALGAS , we are forming a wolfie wave, i will wait the price in the box, or if it can give me any reversal.

Natural Gas Elliott Wave CountNatural Gas Elliott Wave Count
TRADENATION:NATURALGAS MCX:NATURALGAS1! FOREXCOM:NATURALGAS CAPITALCOM:NATURALGAS MOEX:NG1!
Elliott Wave Count!

Naturalgas Elliott wave countNG Elliott wave count
MOEX:NG1! CAPITALCOM:NATURALGAS FOREXCOM:NATURALGAS MCX:NATURALGAS1! TRADENATION:NATURALGAS
Weekly chart
Elliott wave count

Naturalgas elliott wave countnatural gas elliott wave count
MOEX:NG1! CAPITALCOM:NATURALGAS FOREXCOM:NATURALGAS MCX:NATURALGAS1! TRADENATION:NATURALGAS
Elliott wave count!!!
