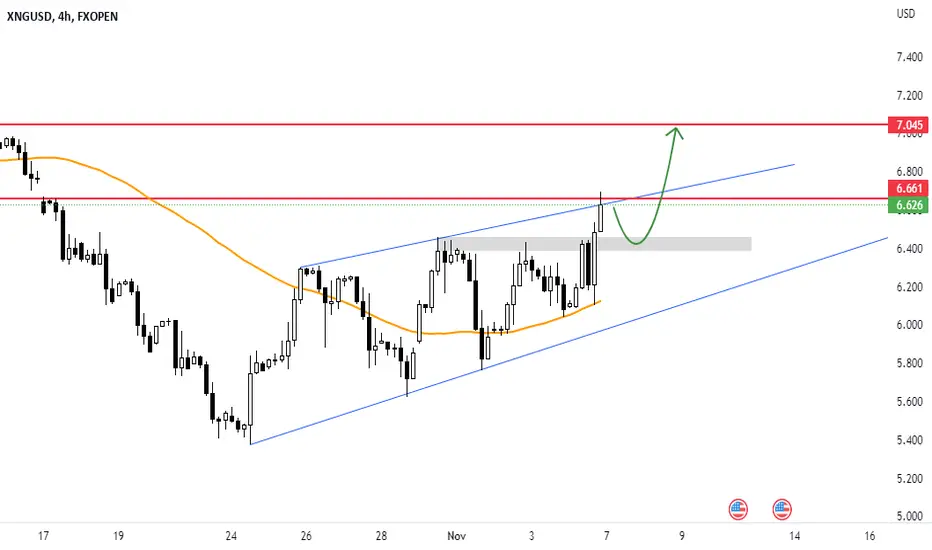
✅NATGAS LONG FROM SUPPORT🚀
✅NATGAS is approaching a demand level
So according to our strategy
We will be looking for the signs of the reversal in the trend
To jump onto the bullish bandwagon just on time to get the best
Risk reward ratio for us
LONG🚀
✅Like and subscribe to never miss a new idea!✅
NGAS

NGAS - CHANGE OF FORMATIONNatural Gas - a topic of geopolitics, war, supply, demand, and speculation at very high and unexpected volatility. Can we observe the price to go back to the triangle tracks and complete that figure or look for a new pattern? Maybe a new BULLISH triangle, speculations call for bulls to feast, especially if winter is hard and the war continues, Bears also peek behind the corner for Russia doing some damage control and pulling back from that controversial conflict. One thing is certain, we see dramatic volatility that can be traded daily and with many turnovers. Can we see once again double digits like 2005 and 2008, all factors are in place.
Risk Disclosure: Trading Foreign Exchange (Forex) and Contracts of Difference (CFD's) carries a high level of risk. By registering and signing up, any client affirms their understanding of their own personal accountability for all transactions performed within their account and recognizes the risks associated with trading on such markets and on such sites. Furthermore, one understands that the company carries zero influence over transactions, markets, and trading signals, therefore, cannot be held liable nor guarantee any profits or losses.

$NGAS - Is the Gas Crisis Over? (Short Trade)$NGAS - Is the Gas Crisis Over? (SHORT)
With the Economy slowing, a variety of commodities are showing weakness, think about $OIL and $COPPER.
$NGAS is still retesting this channel breakdown.
I'm looking for shorts in this area as the potential rewards are huge.
The war in Ukraine may be coming to an end, and this could have an impact on the price of natural gas. If the conflict ends, it may be possible to increase the supply of natural gas from Ukraine, which could lead to lower prices. Additionally, Europe already has enough natural gas to meet its needs for the entire winter, which could also help to keep prices down. However, it is important to remember that the price of natural gas is determined by many different factors, and it is impossible to predict with certainty how it will change in the future on a fundamental level. The charts look good.

Natural gas 2023 outlook: Approaching a key confluence zone The recent price action in the daily natural gas price chart updated to December 5, 2022, saw prices falling rapidly and breaking below the supports of two moving averages (50dma and 200dma) and some key Fibonacci retracement levels, such as the 50% retracement of the post-Ukraine war rally to August highs.
The two moving averages earlier created a death-cross pattern on November 10, which proved bearish after a brief rally to $8.04/MMBtu.
In the summer, natural gas completed a head-and-shoulders pattern, falling below the $5.30 price support. That technical pattern was preceded by negative RSI divergence between April and June 2022, which also led in severe bearish price action to the $5.30 support level.
The double bottom in October and July, as well as the significant technical resistance between November 2021 and March 2022, signal a very critical confluence zone for natural gas.
The $5.30 critical support line is an important test for natural gas prices, which would have dropped by a recession-like 47% from their peak in August.
If the war in Ukraine persists, it is quite improbable that prices will return to the $4.3 level, where they were trading on February 24, 2022, when Russia invaded Ukraine. Bulls may therefore reappear if the $5.3 support line and $5 psychological level are tested.
On the upside, it is unlikely that the skyrocketing price levels observed in the summer of $9.5 or more will be retested anytime soon, as they coincide to an unprecedented supply issue in Europe that triggered an increase in US domestic prices due to increased LNG exports.
In the first quarter of 2023, a sideways market trend with prices ranging from $5 to $8 appears to be the most likely scenario for US natural gas. The colder the winter. The more severe the winter in the Northern Hemisphere, the greater the possibility that prices will trade between $6.5-8 range. Rising recession risks and warmer-than-average temperatures, on the other hand, could prevent a depletion in gas reserves, keeping prices under pressure.

Financial Wave. NGA difficult situation has developed in NG.
Inventory and supply issues pushed the price to record levels. Our preferable scenario is to rally up NG to $12.78, falling below $4.77 will change our view on NG.

NGAS BULLISH OUTLOOKNGAS prices started rising on Monday after a cold wave engulfed the European continent, testing its ability to coupe with the cold weather without its main natural gas supplier Russia.
The instrument broke the resistance levels of the triangle chart pattern entering into a bullish movement. RSI indicator is above the 50 neutral line and MACD histogram is above 0, both confirming the potential bullish movement.
If the trend continues the price might try to test levels of 7.649 In the opposite scenario, the price might try its previous support of 6.554
Risk Disclosure: Trading Foreign Exchange (Forex) and Contracts of Difference (CFD's) carries a high level of risk. By registering and signing up, any client affirms their understanding of their own personal accountability for all transactions performed within their account and recognizes the risks associated with trading on such markets and on such sites. Furthermore, one understands that the company carries zero influence over transactions, markets, and trading signals, therefore, cannot be held liable nor guarantee any profits or losses.

✅NATGAS RISKY LONG🚀
✅NATGAS has been falling recently
And the pair seems locally oversold
So as the pair is approaching a horizontal support
Price growth is to be expected
LONG🚀
✅Like and subscribe to never miss a new idea!✅

natty after making low highsi deffinitely will bet on the most simplest way. not much to coment here.

XNGUSD - NGAS NEXT WEEK MOVEGas this week had a strong bullish movement, and I expect it to complete this movement next week, with a correction that may target 6.40 levels, from which it may launch towards 7.0 levels.The gas has been in an ascending channel for 11 days, but will it breach it and rise towards the 7.0 levels? We wait next week to see what it has in store.
🔥💥 Like, Shared and subscription 💥🔥
Note: If you are a beginner trader, you should be aware of these rules:
1: Do not covet
2: Don't trade too much
3: Secure your positions after entering the profit
4: Enter contracts that fit your portfolio
5: Adhere to all recommendations
NGAS: Will Demand for Natural Gas Increase With Climate Change?Natural Gas's all-time price action/chart suggest that it is due for a sizeable, generational bull run, to start within the next 3 years. One could blame it on war or climate change or politics but I am not smart enough to determine which may be the actual cause, if any. I can instead deduct from NGAS' wavemap that we are unlikely to enjoy the low prices we've seen during the early 90s or at late as Spring 2020.
I've never looked at an inflation chart or have been able to determine what's next for us in that regard but I think this commodity alone can give us some decent expectations. What happens if/when it costs 20x more to keep your home cool in the summer (or warm in the winter)?
With an extended diagonal wave in primary Wave 1 of NGAS, we can expect that primary Wave 3 will be likely extended beyond the 1.618 level. We cannot say that this will occur for sure but it is as likely as it ever is. After finding possible support below $5 in 2024, this commodity could make citizens want to hit the rewind button irl. By 2037-2040, Natural Gas could and should be more than the price of Oil.
At this point and time, I genuinely believe that NGAS will go 40X within the next 15 years. This is indication that I've found through continued analysis of price action. I have no reason to doubt this perspective but am well aware that it could be invalidated upon any given day. For continued analysis of this worldwide commodity and help with taking advantage of a possibly upcoming generational swings, come surf with me and the Digital Surf Trading Community.

BUY NGRecently, the price of natural gas has been under pressure due to measures to reduce consumption and prices in Europe ahead of winter. Officials expect another supply crunch due to restricted access to Russian pipelines and a possible jump in demand for heating goods. Today, the price of natural gas NATGAS / USD is stable between the level of $5.81 and the level of $6.03 per million British thermal units. On another note. An inventory report from the US Department of Energy can determine if the floor can hold or not. Analysts expect a smaller increase in inventories of 103 billion cubic feet compared to the previous increase of 125 billion cubic feet, indicating an increase in purchases.
LNG exports to other countries and storage activity leading to colder months may be responsible for the slowdown in the increase in storage. However, a larger-than-expected increase could mean more downside for natural gas as this may indicate that demand remains weak.
On the gas crisis front following the ongoing Russo-Ukrainian war:
German Chancellor Olaf Scholz has warned that a proposal to cap gas prices at the EU level could backfire as the region seeks to offset significant supply cuts from Russia. “Price capping always involves the risk that producers will sell their gas elsewhere – and we Europeans will end up having less gas instead of more,” Schulz said Thursday in a speech to the German parliament in Berlin.
The German chancellor was speaking ahead of a two-day summit of European Union leaders in Brussels. The bloc's member states will discuss ways to keep energy prices under control and ensure security of supplies, as well as the recent situation in Russia's war in Ukraine. Rather than setting a price cap, Schulze supported the idea of cooperating closely with buyers such as Japan and South Korea to avoid competition for limited supplies, while also attracting like-minded producers. "I am convinced that countries like the United States, Canada or Norway, who stand with us in solidarity with Ukraine, have an interest that energy in Europe will not become too expensive," he said.
According to gas technical analysis: Natural gas price NATGAS/USD has retreated to the main area of interest shown on the longer-term time frames, and a break below could pave the way for a move to the next major support area at $3,635. Technical indicators favor a bounce, as the 100 SMA is above the 200 SMA to reflect bullish pressure. However, the gap between the indicators is narrowing to hint at a possible bearish crossover soon. The commodity is also trading below its two moving averages as an early indication of selling momentum.
If that materializes, the price of natural gas could drop below $5,585 and make its way to the next main floor. The stochastic has been indicating oversold conditions for some time, which means that sellers can use a breakout period and let the buyers take control. Similarly, the RSI is in the oversold territory to indicate exhaustion among the bears. A turn higher means that bullish momentum could pick up and take the commodity back to the next upside barrier around $8,000.

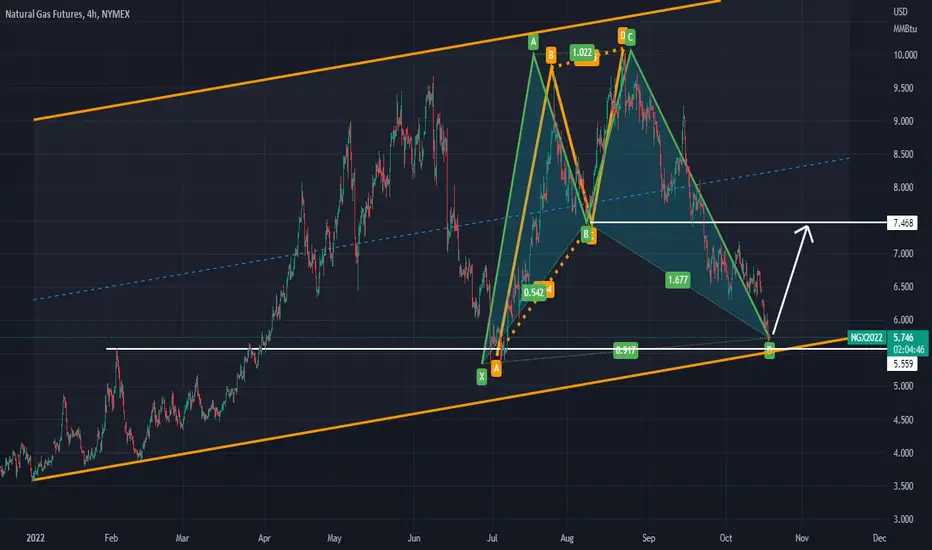
looking for bullish cypher set upPrevious Resistances of $5.559 acting as support for this current D leg.. I initially spotted the ABCD pattern in orange, then I looked for the Bullish Cypher on D leg to kick off. The AD Will confirm
WILL SEE SOME BUYING in NATURAL GASBuy It Around 5.42 Will See 5.50 and 5.60 in Todays Trading and may be Above 6.00

Natural gas trading idea.NATGAS has a lot of big fundamental factors currently, with Russia controlling I believe 75% of the worlds NATGAS reserves we are seeing the tampering of supply alter the market price alot.
Coming into the winter months we could see the price rise considerably as everyone tries to store as much gas as possible we could see supply side issues.
Ideally TWAP turning green gives a good indication of any further imbalance.

$UNG: Next leg up in Nat Gas pricesI think we may see a rapid advance in Nat Gas here, the technical setup in $UNG paves the way for a 18.4:1 reward to risk potential trade. I'm long equity here, but you could trade this with options, or an equivalent fund in the EU or UK (if you're EU based). Futures or options on futures are also an option, but more complicated to execute with maximum efficiency. I suggest you explore this if you're more experienced, and able to determine which strategy to use to maximize RR and performance vs capital allocated to this idea.
Best of luck,
Ivan Labrie.

NATURALGASThe price break nickline head and shoulders.
We will see downtrend in the price.
Profits At 432.7.
Don´t forget like and support for more ideas.
Any Quetions contact me.

💶 EUR; Lowest Rate in 19 Years ( Risk of Energy Crisis )🆖As the risks of an energy crisis increase, the euro is nearing its lowest level in 19 years
Today, the price of natural gas has increased by 9%, and the price of electricity for one year in Germany is 14 times higher than the level of one year ago. The numbers are crippling for heavy industries, with Germany's DAX down 2.3 percent today, the steepest drop in the global index.
The euro has strengthened over the past six weeks as the US dollar weakened against a less accommodative Federal Reserve, but that rally appears to have come to an end. Meanwhile, Europe's economic outlook is rapidly deteriorating. The EUR/USD low was at0.9952 in July and is now about 20 pips away. If this rate breaks, the euro will hit its lowest level since late 2002.What is surprising is that the people of Europe have not yet realized how bad the economic situation will be. There is a lag in energy price increases that has not yet been felt and depends on different countries and contract structures, but there is a lot of difficulty ahead.
✌️ Good luck with your trading and investing and remember: Trade smart…OR JUST DON’T TRADE!
--------------------------------------------------------------------------------------------------------------------
👉This analysis is my personal opinion ,not a financial advice ,so do your own research.
💚 if you're fan of my analyses please follow me , give a big thumbs 👍 OR drop a comment 🗯

Natural gas drop?Natural gas trading volume is huge and it has been a very volatile market, price has printed a new HH but now it looks like the uptrend is exhausted after forming this H&S pattern.
After Nord stream's maintenance success, we expect $NG to retest $8 level.

NATURAL GAS FUTURESThe gas currently faces a very strong resistance zone and has formed us DOUBLE TOP and start to come down very, very strong

NATURAL GAS - 240 MINS CHARTThe Structure looks good to us, waiting for this instrument to correct and then give us these opportunities as shown on this instrument (Price Chart).
Note: its my view only and its for educational purpose only. only who has got knowledge in this strategy will understand what to be done on this setup. its purely based on my technical analysis only (strategies). we don't focus on the short term moves, we look for only for Bullish or Bearish Impulsive moves on the setups after a good price action is formed as per the strategy. we never get into corrective moves. because it will test our patience and also it will be a bullish or a bearish trap. and try trade the big moves.
we do not get into bullish or bearish traps. we anticipate and get into only big bullish or bearish moves (Impulsive moves).
Just ride the bullish or bearish impulsive move. Learn & Know the Complete Market Cycle.
buy low and sell high concept. buy at cheaper price and sell at expensive price.
Keep it simple, keep it Unique.
please keep your comments useful & respectful.
Thanks for your support....


NGAS.F LongNGAS.F Buy. Dont risk more than 3% of ur account. Dont forget to riskfree ur order after TP1. * High risk

natural gas bear tradebear flag and its target for downside.before that as per wave it should go slight up hen fall like a knife...
