NGAS:H2Important levels are drawn on the chart
.The price is at a resistance level
.We are looking for a SELL position
.As each trend breaks, the target will be the next trend
.📢 Please follow your strategy, , this is just my idea
.🙌Please do not forget the ' like' button & Share it with your friends
.✍ I will be glad to see your ideas in this post
.🧲Follow me to see more analysis
NGAS

EUR/USD analysis: Euro to fall below parity on EU gas crisis?Europe's wholesale natural gas price (Dutch Title Transfer Facility TTF ) rose to levels not seen since the aftermath of Russia's invasion of Ukraine, bolstered by a mixture of continuing supply disruptions from Russia and soaring demand for power generation in the midst of persistent heatwaves across Europe.
Gazprom ( GAZP ) announced that European gas prices could increase by 60% this winter, as the company's exports and production continue to fall as a result of Western sanctions.
From a macro standpoint, the European gas crisis is wreaking havoc on the economy of the Eurozone and this effect has already been quite visible on the EUR/USD trend in 2022. European and American natural gas price differentials have been widening to their all-time highs, and the EUR/USD currency pair is just 1.7% far from hitting parity again.
EUR/USD fundamental analysis: EU/US gas price spread plays a key role
According to the most recent NYMEX/CME Group data, US Henry Hub spot prices are currently trading at a $57/MMbtu discount ( THD ) relative to Europe's Dutch TTF benchmark as of mid-August 2022.
The link between EUR/USD and Henry Hub-TTF spread has increased significantly over the course of the summer, with the rolling 90-day correlation coefficient rising to 0.82. This is basically telling us that the lower US natural gas prices trade compared to the European Dutch TFF prices, the stronger the downward pressure on the EUR/USD pair.
Along with the economic growth and interest rate disparities between the two regions, the more severe natural gas crisis that Europe is experiencing compared to the United States is now a key macro factor affecting the EUR/USD exchange rate.
EUR/USD forecasts: The pair could fall below parity if EU/US gas spread widens further
If the European gas crisis worsens in the coming months, the price differential between EU Dutch TTF and US Henry Hub natural gas could widen further, which would likely cause the EUR/USD pair to break decisively below the parity threshold.
A de-escalation in the Russia-Ukraine conflict, coupled with a decline in the price of Dutch TTF gas, will be a key factor in preventing a further depreciation of the single currency. However, this second scenario appears much less likely.
Idea written by Piero Cingari, forex and commodity analyst at Capital.com

XNGUSD/ NGAS Long UpdateGood day traders,
Following all our NGAS signals hitting massive Take profit points, we have one current trade running on the monthly timeframe. After a successfull retest an ABCD bearish harmonic trend hike is currently beign formed, we are almost at the end of that trend hike. We now expect the XNGUSD/ #NGAS/ Natural Gas to reach 11.3 before retracing to meet our final take profit point 14.
Disclaimer
NASDAQ Guru offers general trading signals that does not take into consideration your own trading experiences, personal objectives and goals, financial means, or risk tolerance.

$NGAS: Natural gas can go 90% higher from hereIt's clear Nat Gas can gain traction fast here, I'm long since yesterday, via $UNG shares. Looking to add an options position here, since weekly charts are now bullish, I pre-emptively took a trade based on a daily signal, speculating on the weekly and eventually monthly kicking off. I commented about it in the Key Hidden Levels chatroom here and offered it to my clients as a signal as well.
With last night's shelling of a nuclear plant, escalation seemed likely, and the next step could be to enact sanctions on natural gas exports, which could deal a blow to supply and create a dramatic move to the upside as a side effect. Fundamentals aside, reward to risk and probability are on our side, so it's a good idea to get some decent exposure here.
Cheers,
Ivan Labrie.

Natural Gas: Long at 7.80 NG should find support at 7.80 - 7.85.. It is a good entry point for a counter trend rally to 9

NGAS - Gas is rising Gas is looking very good
Pros:
Technically strong
High volume
Winter demand for Europe
Cons:
Wheat like deal with Russia can result in price drop
Risk management:
Use stop loss and manage your risk
ETF:
NGAS
BOIL (3x exposure with high risk)

US natural gas: Bearish clouds ahead?Henry Hub ( US natural gas ) prices have fallen 25% from their peak of $9.64 per million British thermal units (MMBtu) hit in June, as the fire at Freeport LNG’s natural gas liquefaction plant reduced U.S. export capacity by an estimated 2.0 billion cubic feet per day (Bcf/d) or approximately 15% of annual volumes.
The major driver behind the spectacular rise in US natural gas prices had been a rise in price-premium gas shipments to Europe, which was suffering from a drop in Russian supply.
As a complete cutoff of Russian gas supply to Europe looms, this should theoretically put upward pressure on US natural gas prices. In practise, however, the US Freeport LNG’s facility is not scheduled to resume at full capacity until 2023, thus pricing pressures owing to greater exports to Europe can no longer occur as they did previously. And the market has already factored this in. On top of this, there is also the risk of recession in the US looming on gas prices.
US Natural Gas Technical analysis
From a technical perspective, US natural gas prices may have entered a trend reversal phase following the RSI bearish divergence in June, when oscillator values fell from overbought levels as prices reached new highs.
This suggested that the bulls’ strength had progressively diminished, allowing the bears to take over.
In the last three trading sessions, the 50-day moving average level of $7.5 has acted as a strong resistance for US gas prices. This might pave the way for a price pullback towards the $6.5 support level.
A bullish breakout over $7.5 would invalidate the thesis and trigger a test of the psychological $8 mark.

Natural Gas: Due for New 13-Year High During WinterBased on my all-time Natural Gas wavemap (which is not shared in this video) and also based on more recent price action, I believe that Natural Gas is due for a 13-year high just in time for the upcoming winter season. Will price sustain this anticipated regional high between $10.87 and $13.00 or will it plummet in the season(s) to follow?
Check out my TradingView profile or shoot me a PM to discuss Natural Gas in further long term perspective.
If you find this post potentially helpful, feel free to like, share and/or comment as well.
Until next time, surf carefully and don't drown.

BUY Ngas!Natural Gas is a very important energy nowadays especiall in EU zone, Germany fears coming winter as Ngas supply is so tight because of Russia-Ukraine & Russia-Nato conflict.
Most of Europe countries can't survive winter without Ngas which makes it very demanded, NG price is expected to skyrocket starting from now as you can see in the chart, we just flipped bullish after a trend reversal, now price is in a correction phase which is the wave we want to get our entry from.

Buy Natural GasNG is oversold and now setting at a good support zone! price action looks exhausting with weak selling pressure, now preparing for a bounce back up!
Always bullish on energies in this global economic crisis.

NG up trendit seems the bearish is done and we are in uptrend for Natural Gas and the first Tp will 8.1 for end of this week or soon. keep in touch for more connections send me a message in pv and welcome.


Natural Gas At Risk Of Decline At Sellers LevelNatural Gas rally now facing selling pressure from bears in the market. A rejection at current level can possibly drag price to its mean below 6.610
N.B
- Let emotions and sentiments work for you
-ALWAYS Use Proper Risk Management In Your Trades

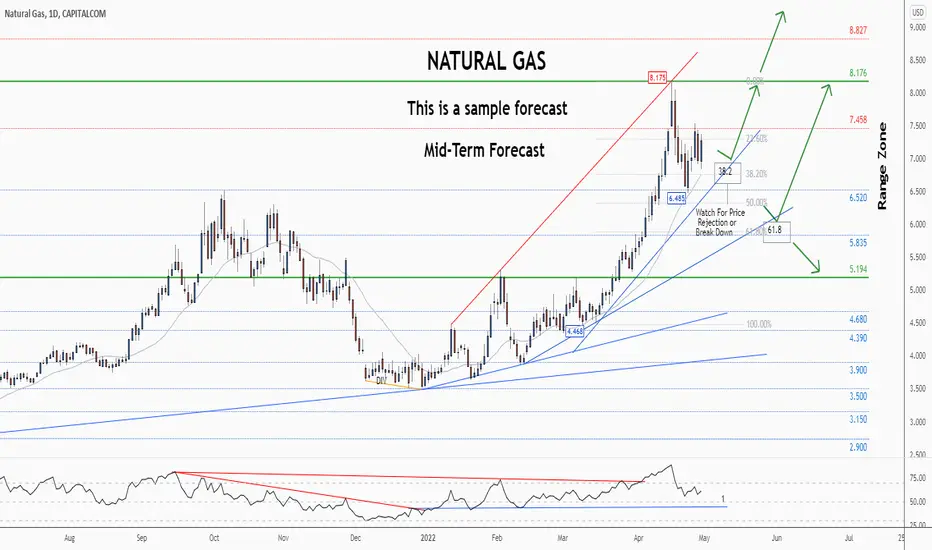
💡NGAS (NAT.GAS) - Weekly Technical Analysis UpdateMidterm forecast:
While the price is above the support 5.194, resumption of uptrend is expected.
We make sure when the resistance at 8.176 breaks.
If the support at 5.194 is broken, the short-term forecast -resumption of uptrend- will be invalid.
Technical analysis:
While the RSI support #1 at 43 is not broken, the probability of price decrease would be too low.
A trough is formed in daily chart at 6.485 on 04/25/2022, so more gains to resistance(s) 7.458 and maximum to Major Resistance (8.176) is expected.
Price is above WEMA21, if price drops more, this line can act as dynamic support against more losses.
Relative strength index ( RSI ) is 61.
Supports and Resistances:
8.827
8.176
7.458
6.520
5.835
5.194
❤️ If you find this helpful and want more FREE forecasts in TradingView
. . . . . Please show your support back,
. . . . . . . . Hit the 👍 LIKE button,
. . . . . . . . . . Drop some feedback below in the comment!
❤️ Your support is very much 🙏 appreciated!❤️
💎 Want us to help you become a better Forex / Crypto trader?
Now, It's your turn!
Be sure to leave a comment; let us know how you see this opportunity and forecast.
Trade well, ❤️
ForecastCity English Support Team ❤️
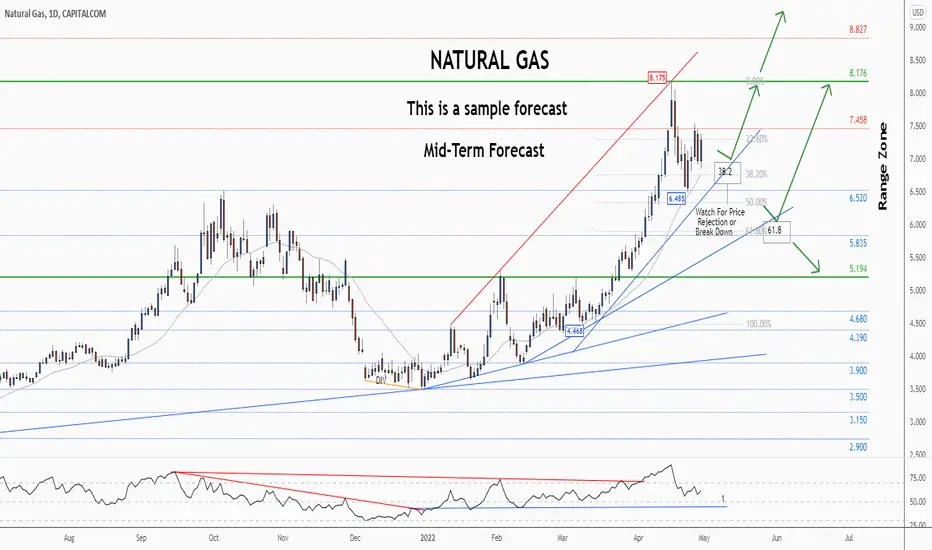
💡NGAS (NAT.GAS) - Weekly Technical Analysis UpdateMidterm forecast:
While the price is above the support 5.194, resumption of uptrend is expected.
We make sure when the resistance at 8.176 breaks.
If the support at 5.194 is broken, the short-term forecast -resumption of uptrend- will be invalid.
Technical analysis:
While the RSI support #1 at 43 is not broken, the probability of price decrease would be too low.
A trough is formed in daily chart at 6.485 on 04/25/2022, so more gains to resistance(s) 7.458 and maximum to Major Resistance (8.176) is expected.
Price is above WEMA21, if price drops more, this line can act as dynamic support against more losses.
Relative strength index (RSI) is 61.
Supports and Resistances:
8.827
8.176
7.458
6.520
5.835
5.194
❤️ If you find this helpful and want more FREE forecasts in TradingView
. . . . . Please show your support back,
. . . . . . . . Hit the 👍 LIKE button,
. . . . . . . . . . Drop some feedback below in the comment!
❤️ Your support is very much 🙏 appreciated!❤️
💎 Want us to help you become a better Forex / Crypto trader?
Now, It's your turn!
Be sure to leave a comment; let us know how you see this opportunity and forecast.
Trade well, ❤️
ForecastCity English Support Team ❤️
NGas LongHi traders,
Following our last NGAS signal that hit our massive take profit I noticed an ABCD trendhike on the weekly timeframe and will hold my remaining positions to new take profit point $8

Trouble for NGAS. NGAS LongGood day traders,
Following all my NGAS analysis meeting take profit levels, I'm now able to confirm the bigger picture. Please note that all my analysis are done from a swing point of view but you could see the targets being met sooner than anticipated.
Building up to the Russia/Ukraine war we noticed the Natural Gas prices consolidate and only saw it surge after the sanctions were handed. With the sanctions in place, I believe that the market will keep surging until something is done about the high demand that was created by the sanctions.
What we currently know: The Russia/Ukraine most recent peace talks failed thus we saw the market surge to $8.1 last week. We are are close our support and I now anticipate Natural gas to retest our key level and eventually meet our Take profit level on our long term resistance.
What are your thoughts on this commodity? Do you agree with my observation?
Please join in the converstion to share your thoughts.
Disclaimer
NASDAQ Guru offers general trading signals that does not take into consideration your own trading experiences, personal objectives and goals, financial means, or risk tolerance.

NG Downside PressureAlthough price is in an uptrend and is bouncing on the ascending trend line, we can see bearish strong candles formations which indicate downside signals.
Currently, price is facing bearish pressure and has made a bearish reversal pattern.
There is a yellow support level around 6.100, and if price breaks this level, I expect a drop at least to retest the trend line around 5.870


Major lows hit in Natural GasNatural gas hit the demand curve four times in the last 14 year. The average percentage gain from the lows of the curve to the highs exceeds 200%. This is the fifth time hitting the curve.
If the lows hold, we could see a similar violent reversal off the curve.

NGAS: Huge monthly uptrend startingI think Nat Gas prices are going to soar here, for the coming 9 months. We have a daily entry here, that can evolve into a massive monthly trend.
Try not to miss out on this play!
Cheers,
Ivan Labrie.

Ngas soaredNgas soared as well went the market opened. I held a trade from last week to gain these profits. Taking tp and waiting for further confirmations

NGas still on the bearish side but looks to be bullish by NFPNGAS formed a double bottom and gave us a breakout on neckline, I'm a bit indecisive even though we have a bullish impulse on the NGAS it still isn't give aa clear direction. I will place a buy limit and patiently wait for it to trigger.
Remember that all positions aren't worth taking. Always wait for at least 5-7 confirmations. In this case I only have 3 which isn't good enough to take the buy. I will wait for more fundamentals to give me more reasons to buy.
What are your thoughts on Ngas?
