NI225: Move Down Expected! Short!
My dear friends,
Today we will analyse NI225 together☺️
The recent price action suggests a shift in mid-term momentum. A break below the current local range around 41,456.23 will confirm the new direction downwards with the target being the next key level of 40,954.70 and a reconvened placement of a stop-loss beyond the range.
❤️Sending you lots of Love and Hugs❤️
Japan 225

Nikkei 225 D1 | Strong upward momentumThe Nikkei 225 (JPN225) is falling towards a pullback support and could potentially bounce off this level to climb higher.
Buy entry is at 40,670.02 which is a pullback support that aligns with the 23.6% Fibonacci retracement.
Stop loss is at 39,100.00 which is a level that lies underneath an overlap support and the 23.6% and 50% Fibonacci retracements.
Take profit is at 42,550.16 which is a swing-high resistance.
High Risk Investment Warning
Trading Forex/CFDs on margin carries a high level of risk and may not be suitable for all investors. Leverage can work against you.
Stratos Markets Limited (tradu.com ):
CFDs are complex instruments and come with a high risk of losing money rapidly due to leverage. 66% of retail investor accounts lose money when trading CFDs with this provider. You should consider whether you understand how CFDs work and whether you can afford to take the high risk of losing your money.
Stratos Europe Ltd (tradu.com ):
CFDs are complex instruments and come with a high risk of losing money rapidly due to leverage. 66% of retail investor accounts lose money when trading CFDs with this provider. You should consider whether you understand how CFDs work and whether you can afford to take the high risk of losing your money.
Stratos Global LLC (tradu.com ):
Losses can exceed deposits.
Please be advised that the information presented on TradingView is provided to Tradu (‘Company’, ‘we’) by a third-party provider (‘TFA Global Pte Ltd’). Please be reminded that you are solely responsible for the trading decisions on your account. There is a very high degree of risk involved in trading. Any information and/or content is intended entirely for research, educational and informational purposes only and does not constitute investment or consultation advice or investment strategy. The information is not tailored to the investment needs of any specific person and therefore does not involve a consideration of any of the investment objectives, financial situation or needs of any viewer that may receive it. Kindly also note that past performance is not a reliable indicator of future results. Actual results may differ materially from those anticipated in forward-looking or past performance statements. We assume no liability as to the accuracy or completeness of any of the information and/or content provided herein and the Company cannot be held responsible for any omission, mistake nor for any loss or damage including without limitation to any loss of profit which may arise from reliance on any information supplied by TFA Global Pte Ltd.
The speaker(s) is neither an employee, agent nor representative of Tradu and is therefore acting independently. The opinions given are their own, constitute general market commentary, and do not constitute the opinion or advice of Tradu or any form of personal or investment advice. Tradu neither endorses nor guarantees offerings of third-party speakers, nor is Tradu responsible for the content, veracity or opinions of third-party speakers, presenters or participants.

Nikkei 225 Index Surges Above 41,000 PointsNikkei 225 Index Surges Above 41,000 Points
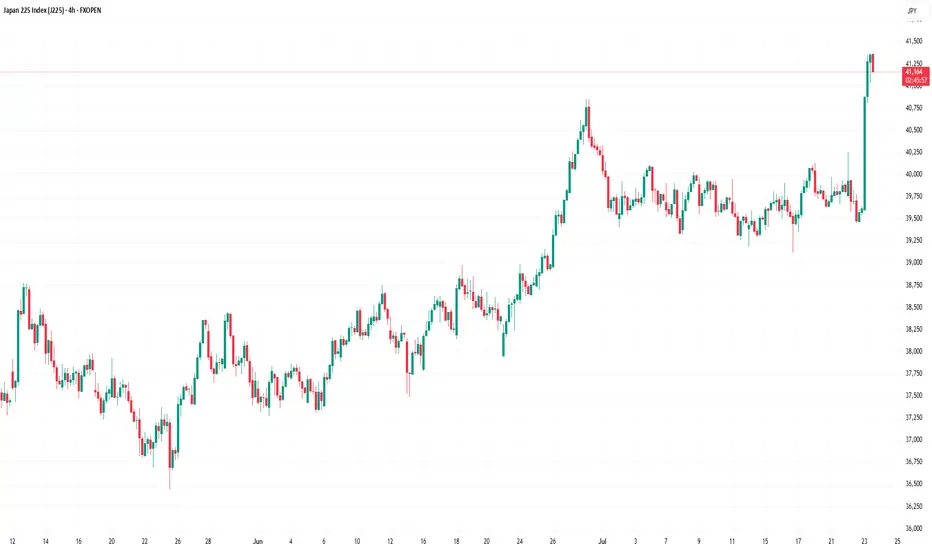
As the chart indicates, the value of the Nikkei 225 stock index has risen above the 41,000-point level — its highest mark since July 2024.
The primary bullish driver is the conclusion of a trade agreement between the United States and Japan. According to media reports, the deal will involve Japan paying a 15% duty on exports to the US, down from the previous 25% tariff. Shares of automotive companies are among the top gainers on the Japanese stock market.
European stock indices have also risen, as EU officials are scheduled to visit Washington on Wednesday, raising hopes for a potential US-EU trade agreement.
Technical Analysis of the Nikkei 225 Chart
Approximately a month ago, we outlined an ascending channel based on the price fluctuations observed in 2025. This formation remains relevant, and:
→ The price has moved into the upper half of the channel, suggesting that the median line may act as a support level going forward.
→ The nature of the latest price action is worth noting: as an immediate reaction to the news of the deal, two long bullish candles formed on the chart. However, once the price reached its 2025 high, upward momentum slowed sharply.
→ The RSI indicator signals overbought conditions.
Thus, it is reasonable to assume that, following an approximate 3.6% surge over an eight-hour period, the bullish momentum may have largely been exhausted. Nikkei 225 (Japan 225 on FXOpen) could now be vulnerable to a pullback, potentially towards the median line. Nonetheless, the ultimate direction will be shaped primarily by fundamental news.
This article represents the opinion of the Companies operating under the FXOpen brand only. It is not to be construed as an offer, solicitation, or recommendation with respect to products and services provided by the Companies operating under the FXOpen brand, nor is it to be considered financial advice.
Nikkei Futures Try for ATHsWith US President Trump finalizing an agreement with Japan by imposing a 15% tariff on US businesses for Japanese products, Japanese stocks are flying due to the new found competitive advantage they have
JAPAN as a HERO? UP! GOKU Last Fight! JAPAN is the last one to join the party! The final fight for the #BlowoffTop.
Why is this so important? If you look at correlations with BTC, global liquidity, China, the Fed’s interest rates, and more, Japan plays a key role. After China, Japan is the next to wake up and give the final push to this Bull Market.
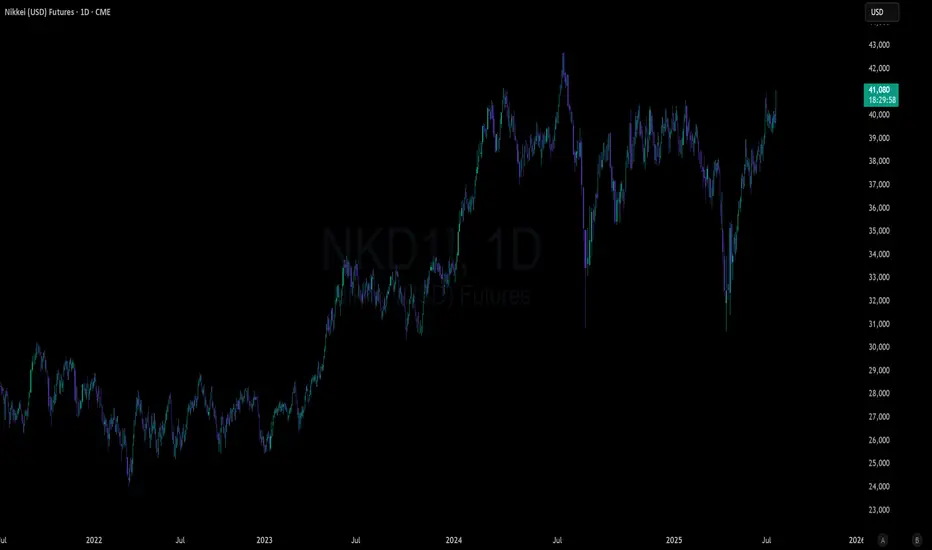
The last time the Nikkei dropped more than 25% was during the COVID crash. What happened next? It rallied 26% in the first 52 days and extended its Bull Market to over 88% from the bottom.
With the current Carry Trade crisis (still unresolved), the TVC:NI225 has dropped more than 25% again, and guess what? It’s up 26% in the first 52 days... History doesn’t repeat, but it often rhymes.
It’s feeling like 2017 all over again... What do you think? 🚀📈

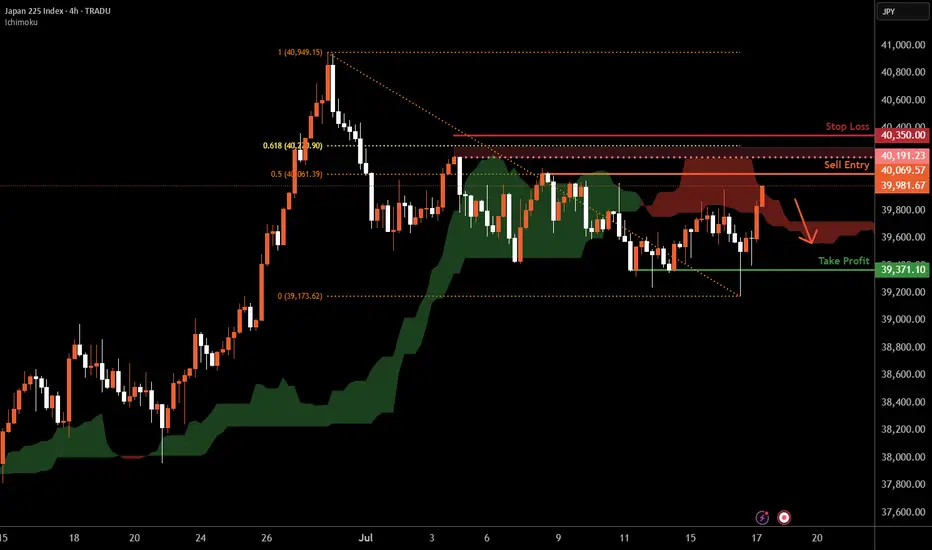
Nikkei 225 H4 | Swing-high resistance at 50% Fibo retracementThe Nikkei 225 (JPN225) is rising towards a swing-high resistance and could potentially reverse off this level to drop lower.
Sell entry is at 40,069.57 which is a swing-high resistance that aligns with the 50% Fibonacci retracement.
Stop loss is at 40,350.00 which is a level that sits above the 61.8% Fibonacci retracement and a swing-high resistance.
Take profit is at 39,371.10 which is a multi-swing-low support.
High Risk Investment Warning
Trading Forex/CFDs on margin carries a high level of risk and may not be suitable for all investors. Leverage can work against you.
Stratos Markets Limited (tradu.com ):
CFDs are complex instruments and come with a high risk of losing money rapidly due to leverage. 66% of retail investor accounts lose money when trading CFDs with this provider. You should consider whether you understand how CFDs work and whether you can afford to take the high risk of losing your money.
Stratos Europe Ltd (tradu.com ):
CFDs are complex instruments and come with a high risk of losing money rapidly due to leverage. 66% of retail investor accounts lose money when trading CFDs with this provider. You should consider whether you understand how CFDs work and whether you can afford to take the high risk of losing your money.
Stratos Global LLC (tradu.com ):
Losses can exceed deposits.
Please be advised that the information presented on TradingView is provided to Tradu (‘Company’, ‘we’) by a third-party provider (‘TFA Global Pte Ltd’). Please be reminded that you are solely responsible for the trading decisions on your account. There is a very high degree of risk involved in trading. Any information and/or content is intended entirely for research, educational and informational purposes only and does not constitute investment or consultation advice or investment strategy. The information is not tailored to the investment needs of any specific person and therefore does not involve a consideration of any of the investment objectives, financial situation or needs of any viewer that may receive it. Kindly also note that past performance is not a reliable indicator of future results. Actual results may differ materially from those anticipated in forward-looking or past performance statements. We assume no liability as to the accuracy or completeness of any of the information and/or content provided herein and the Company cannot be held responsible for any omission, mistake nor for any loss or damage including without limitation to any loss of profit which may arise from reliance on any information supplied by TFA Global Pte Ltd.
The speaker(s) is neither an employee, agent nor representative of Tradu and is therefore acting independently. The opinions given are their own, constitute general market commentary, and do not constitute the opinion or advice of Tradu or any form of personal or investment advice. Tradu neither endorses nor guarantees offerings of third-party speakers, nor is Tradu responsible for the content, veracity or opinions of third-party speakers, presenters or participants.
NI225: Will Go Up! Long!
My dear friends,
Today we will analyse NI225 together☺️
The recent price action suggests a shift in mid-term momentum. A break above the current local range around 39,581.12 will confirm the new direction upwards with the target being the next key level of 39,719.48 and a reconvened placement of a stop-loss beyond the range.
❤️Sending you lots of Love and Hugs❤️

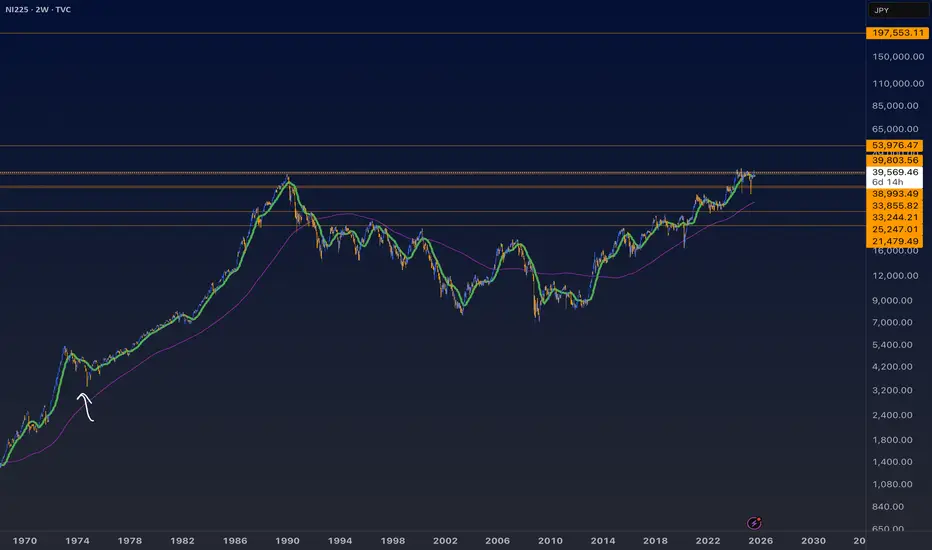
NI225 NIKKEI 225 25-7-11Japan stocks remind me the most of this time in 1975, which marked a bottom. It’s not identical at all. Just the closest I could compare it to. It’s at all time highs and after a year or so of consolidation. The thing is now looks even better for a textbook W reversal up now. It’s a striking pattern really you can clearly see it. I wouldn’t be surprised if it makes more spikes back down though also before resuming an upward trend.
Nikkei 225 H1 | Swing-high resistance at a Fibo confluence zoneThe Nikkei 225 (JPN225) is rising towards a swing-high resistance and could potentially reverse off this level to drop lower.
Sell entry is at 40,196.22 which is a swing-high resistance that aligns with a confluence of Fibonacci levels i.e. the 78.6% projection and the 127.2% extension.
Stop loss is at 40,480.00 which is a level that sits above the 161.8% Fibonacci extension and an overlap resistance.
Take profit is at 39,712.53 which is a swing-low support.
High Risk Investment Warning
Trading Forex/CFDs on margin carries a high level of risk and may not be suitable for all investors. Leverage can work against you.
Stratos Markets Limited (tradu.com ):
CFDs are complex instruments and come with a high risk of losing money rapidly due to leverage. 63% of retail investor accounts lose money when trading CFDs with this provider. You should consider whether you understand how CFDs work and whether you can afford to take the high risk of losing your money.
Stratos Europe Ltd (tradu.com ):
CFDs are complex instruments and come with a high risk of losing money rapidly due to leverage. 63% of retail investor accounts lose money when trading CFDs with this provider. You should consider whether you understand how CFDs work and whether you can afford to take the high risk of losing your money.
Stratos Global LLC (tradu.com ):
Losses can exceed deposits.
Please be advised that the information presented on TradingView is provided to Tradu (‘Company’, ‘we’) by a third-party provider (‘TFA Global Pte Ltd’). Please be reminded that you are solely responsible for the trading decisions on your account. There is a very high degree of risk involved in trading. Any information and/or content is intended entirely for research, educational and informational purposes only and does not constitute investment or consultation advice or investment strategy. The information is not tailored to the investment needs of any specific person and therefore does not involve a consideration of any of the investment objectives, financial situation or needs of any viewer that may receive it. Kindly also note that past performance is not a reliable indicator of future results. Actual results may differ materially from those anticipated in forward-looking or past performance statements. We assume no liability as to the accuracy or completeness of any of the information and/or content provided herein and the Company cannot be held responsible for any omission, mistake nor for any loss or damage including without limitation to any loss of profit which may arise from reliance on any information supplied by TFA Global Pte Ltd.
The speaker(s) is neither an employee, agent nor representative of Tradu and is therefore acting independently. The opinions given are their own, constitute general market commentary, and do not constitute the opinion or advice of Tradu or any form of personal or investment advice. Tradu neither endorses nor guarantees offerings of third-party speakers, nor is Tradu responsible for the content, veracity or opinions of third-party speakers, presenters or participants.

NI225: Strong Growth Ahead! Long!
My dear friends,
Today we will analyse NI225 together☺️
The in-trend continuation seems likely as the current long-term trend appears to be strong, and price is holding above a key level of 39,810.33 So a bullish continuation seems plausible, targeting the next high. We should enter on confirmation, and place a stop-loss beyond the recent swing level.
❤️Sending you lots of Love and Hugs❤️

Nikkei 225 H1 | Potential bullish bounceThe Nikkei 225 (JPN225) is falling towards an overlap support and could potentially bounce off this level to climb higher.
Buy entry is at 39,552.68 which is an overlap support that aligns with the 50% Fibonacci retracement.
Stop loss is at 38,850.00 which is a level that lies underneath an overlap support and the 61.8% Fibonacci retracement.
Take profit is at 40,453.12 which is an overlap resistance that aligns with the 61.8% Fibonacci retracement.
High Risk Investment Warning
Trading Forex/CFDs on margin carries a high level of risk and may not be suitable for all investors. Leverage can work against you.
Stratos Markets Limited (tradu.com ):
CFDs are complex instruments and come with a high risk of losing money rapidly due to leverage. 63% of retail investor accounts lose money when trading CFDs with this provider. You should consider whether you understand how CFDs work and whether you can afford to take the high risk of losing your money.
Stratos Europe Ltd (tradu.com ):
CFDs are complex instruments and come with a high risk of losing money rapidly due to leverage. 63% of retail investor accounts lose money when trading CFDs with this provider. You should consider whether you understand how CFDs work and whether you can afford to take the high risk of losing your money.
Stratos Global LLC (tradu.com ):
Losses can exceed deposits.
Please be advised that the information presented on TradingView is provided to Tradu (‘Company’, ‘we’) by a third-party provider (‘TFA Global Pte Ltd’). Please be reminded that you are solely responsible for the trading decisions on your account. There is a very high degree of risk involved in trading. Any information and/or content is intended entirely for research, educational and informational purposes only and does not constitute investment or consultation advice or investment strategy. The information is not tailored to the investment needs of any specific person and therefore does not involve a consideration of any of the investment objectives, financial situation or needs of any viewer that may receive it. Kindly also note that past performance is not a reliable indicator of future results. Actual results may differ materially from those anticipated in forward-looking or past performance statements. We assume no liability as to the accuracy or completeness of any of the information and/or content provided herein and the Company cannot be held responsible for any omission, mistake nor for any loss or damage including without limitation to any loss of profit which may arise from reliance on any information supplied by TFA Global Pte Ltd.
The speaker(s) is neither an employee, agent nor representative of Tradu and is therefore acting independently. The opinions given are their own, constitute general market commentary, and do not constitute the opinion or advice of Tradu or any form of personal or investment advice. Tradu neither endorses nor guarantees offerings of third-party speakers, nor is Tradu responsible for the content, veracity or opinions of third-party speakers, presenters or participants.

NI225: Move Down Expected! Short!
My dear friends,
Today we will analyse NI225 together☺️
The market is at an inflection zone and price has now reached an area around 40,150.79 where previous reversals or breakouts have occurred.And a price reaction that we are seeing on multiple timeframes here could signal the next move down so we can enter on confirmation, and target the next key level of 39,753.50..Stop-loss is recommended beyond the inflection zone.
❤️Sending you lots of Love and Hugs❤️

Nikkei 225 Index Rises Above 40,000 PointsNikkei 225 Index Rises Above 40,000 Points
As the chart shows, the Nikkei 225 stock index (Japan 225 on FXOpen) has risen above the psychological level of 40,000 points — for the first time in five months.
Bullish drivers include:
→ Reduced geopolitical risks. A ceasefire between Iran and Israel has boosted market sentiment, with stock indices rising both on Wall Street (yesterday the Nasdaq 100 hit a new all-time high) and in Japan.
→ Easing fears of a prolonged trade war. White House Press Secretary Karoline Leavitt noted that the timeline for implementing tariffs is flexible and could be extended.
→ Economic news. Recent data shows that inflation in Japan has slowed for the first time in four months: the core consumer price index fell to 3.1% from 3.6% in May.
Technical Analysis of the Nikkei 225 Chart
Price movements are forming an upward channel (highlighted in blue), but the market appears vulnerable to a pullback, as suggested by:
→ proximity to the upper boundary of the channel;
→ overbought conditions indicated by the RSI.
If a pullback develops, it will provide yet another example of how the price failed to hold above the psychological level of 40,000 — something we've seen repeatedly since October 2024, and we've been pointing out this pattern for quite some time.
Therefore, we might witness another false breakout above the 40K level on the Nikkei 225 (Japan 225 on FXOpen), followed by a retreat deeper into the blue channel — potentially towards its median line.
This article represents the opinion of the Companies operating under the FXOpen brand only. It is not to be construed as an offer, solicitation, or recommendation with respect to products and services provided by the Companies operating under the FXOpen brand, nor is it to be considered financial advice.

Nikkei to continue in the upward move?NIK225 - 24h expiry
Short term RSI has turned positive. Further upside is expected.
Risk/Reward would be poor to call a buy from current levels.
A move through 38750 will confirm the bullish momentum.
The measured move target is 39500.
We look to Buy at 38500 (stop at 38200)
Our profit targets will be 39250 and 39500
Resistance: 39000 / 39250 / 39500
Support: 38500 / 38250 / 38000
Risk Disclaimer
The trade ideas beyond this page are for informational purposes only and do not constitute investment advice or a solicitation to trade. This information is provided by Signal Centre, a third-party unaffiliated with OANDA, and is intended for general circulation only. OANDA does not guarantee the accuracy of this information and assumes no responsibilities for the information provided by the third party. The information does not take into account the specific investment objectives, financial situation, or particular needs of any particular person. You should take into account your specific investment objectives, financial situation, and particular needs before making a commitment to trade, including seeking advice from an independent financial adviser regarding the suitability of the investment, under a separate engagement, as you deem fit.
You accept that you assume all risks in independently viewing the contents and selecting a chosen strategy.
Where the research is distributed in Singapore to a person who is not an Accredited Investor, Expert Investor or an Institutional Investor, Oanda Asia Pacific Pte Ltd (“OAP“) accepts legal responsibility for the contents of the report to such persons only to the extent required by law. Singapore customers should contact OAP at 6579 8289 for matters arising from, or in connection with, the information/research distributed.

Nikkei 225 H4 | Rising toward a 61.8% Fibonacci retracementThe Nikkei 225 (JPN225) is rising towards a pullback resistance and could potentially reverse off this level to drop lower.
Sell entry is at 38,651.50 which is a pullback resistance that aligns closely with the 61.8% Fibonacci retracement.
Stop loss is at 39,000.00 which is a level that sits above a multi-swing-high resistance.
Take profit is at 37,840.09 which is a pullback support that aligns closely with the 78.6% Fibonacci retracement.
High Risk Investment Warning
Trading Forex/CFDs on margin carries a high level of risk and may not be suitable for all investors. Leverage can work against you.
Stratos Markets Limited (tradu.com ):
CFDs are complex instruments and come with a high risk of losing money rapidly due to leverage. 63% of retail investor accounts lose money when trading CFDs with this provider. You should consider whether you understand how CFDs work and whether you can afford to take the high risk of losing your money.
Stratos Europe Ltd (tradu.com ):
CFDs are complex instruments and come with a high risk of losing money rapidly due to leverage. 63% of retail investor accounts lose money when trading CFDs with this provider. You should consider whether you understand how CFDs work and whether you can afford to take the high risk of losing your money.
Stratos Global LLC (tradu.com ):
Losses can exceed deposits.
Please be advised that the information presented on TradingView is provided to Tradu (‘Company’, ‘we’) by a third-party provider (‘TFA Global Pte Ltd’). Please be reminded that you are solely responsible for the trading decisions on your account. There is a very high degree of risk involved in trading. Any information and/or content is intended entirely for research, educational and informational purposes only and does not constitute investment or consultation advice or investment strategy. The information is not tailored to the investment needs of any specific person and therefore does not involve a consideration of any of the investment objectives, financial situation or needs of any viewer that may receive it. Kindly also note that past performance is not a reliable indicator of future results. Actual results may differ materially from those anticipated in forward-looking or past performance statements. We assume no liability as to the accuracy or completeness of any of the information and/or content provided herein and the Company cannot be held responsible for any omission, mistake nor for any loss or damage including without limitation to any loss of profit which may arise from reliance on any information supplied by TFA Global Pte Ltd.
The speaker(s) is neither an employee, agent nor representative of Tradu and is therefore acting independently. The opinions given are their own, constitute general market commentary, and do not constitute the opinion or advice of Tradu or any form of personal or investment advice. Tradu neither endorses nor guarantees offerings of third-party speakers, nor is Tradu responsible for the content, veracity or opinions of third-party speakers, presenters or participants.

Nikkei 225 stays bullish as Japan embraces AIWhile most traders have been focused on AI's impact on Western economies, Japan has been quietly chipping away at its own AI revolution. Not by building the flashiest tools, but by embedding AI into the guts of its economy.
Let's start with the obvious. Japan is an industrial giant. Toyota, Fanuc, Sony. These companies aren’t chasing fads. They’re integrating AI into factories, supply chains, and robotics. Not hype but rather real productivity.
The government gets it too. “Society 5.0” isn’t just a slogan. It’s a structural policy push. R&D spending is north of 3% of GDP. That’s capital well spent.
Now the deeper point, demographics. Japan’s working-age population is shrinking. That’s no longer a headwind. It’s fuel. AI offsets labour shortages. Healthcare, logistics, transport. These sectors are being rewired, not disrupted. They’re evolving, and profits will follow.
Then there’s valuation. The Nikkei 225 is still attractive with a forward P/E of around 14x, while the S&P trades above 22x. Yet Japanese firms are global leaders in high-value, AI-relevant sectors. That gap will close.
This is structural, it’s not about today’s trade. It’s about where capital flows over the next five years.
Japan’s quiet, calculated AI pivot is the most underpriced transformation in global markets.
Stay long Nikkei, we expect the 200-day moving average to hold. The re-rating is only beginning.
The forecasts provided herein are intended for informational purposes only and should not be construed as guarantees of future performance. This is an example only to enhance a consumer's understanding of the strategy being described above and is not to be taken as Blueberry Markets providing personal advice.

NI225: Next Move Is Up! Long!
My dear friends,
Today we will analyse NI225 together☺️
The price is near a wide key level
and the pair is approaching a significant decision level of 38,501.82 Therefore, a strong bullish reaction here could determine the next move up.We will watch for a confirmation candle, and then target the next key level of 38,689.93.Recommend Stop-loss is beyond the current level.
❤️Sending you lots of Love and Hugs❤️

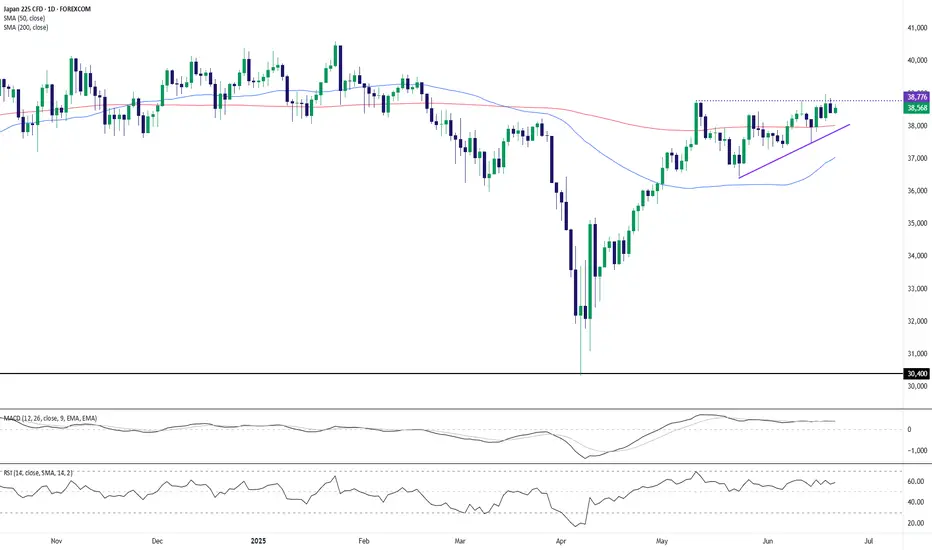
Nikkei 225 Coiling in Ascending Triangle – Breakout Imminent?The Japan 225 (Nikkei) is consolidating just beneath a major resistance level around 38,776, forming a classic ascending triangle pattern. Price has been compressing into higher lows while repeatedly testing the horizontal ceiling, hinting at a potential bullish breakout.
Key Technical Observations:
Pattern Structure: The ascending triangle, defined by rising trendline support and horizontal resistance, suggests bullish pressure is building.
Moving Averages: Price trades above both the 50-day and 200-day SMAs, reinforcing the medium-term bullish trend.
MACD: Remains flat but in positive territory, indicating underlying strength even amid consolidation.
RSI: At 58.7, RSI is neutral to bullish, showing room for further upside before entering overbought territory.
A confirmed breakout above the 38,776 resistance would validate the ascending triangle and potentially trigger a fresh bullish leg. Conversely, a break below the rising trendline would invalidate the pattern and suggest deeper consolidation or correction.
This setup favors bulls as long as the higher lows remain intact. A decisive daily close above resistance could accelerate momentum toward new highs.
-MW
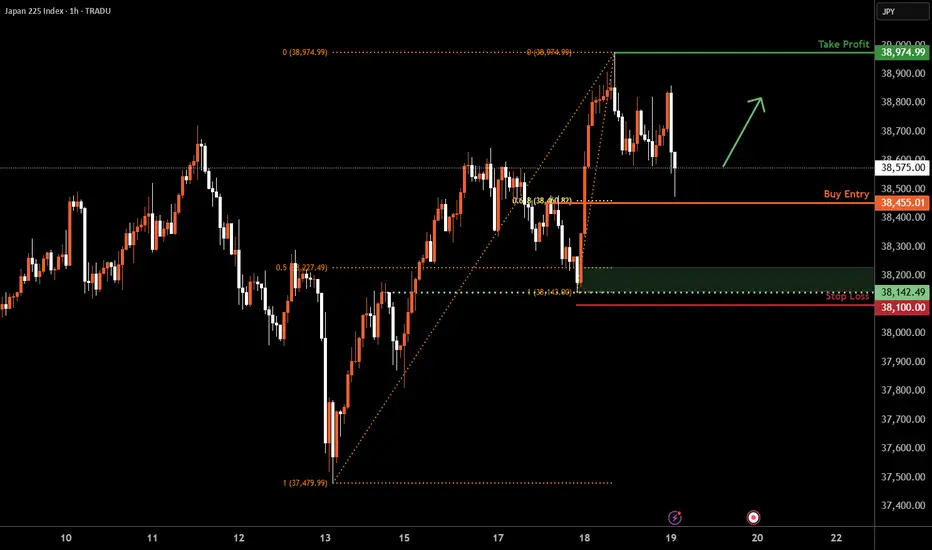
Nikkei 225 H1 | Pullback support at 61.8% Fibonacci retracementThe Nikkei 225 (JPN225) is falling towards a pullback support and could potentially bounce off this level to climb higher.
Buy entry is at 38,455.01 which is a pullback support that aligns with the 61.8% Fibonacci retracement.
Stop loss is at 38,100.00 which is a level that lies underneath an overlap support and the 50% Fibonacci retracement.
Take profit is at 38,974.99 which is a swing-high resistance.
High Risk Investment Warning
Trading Forex/CFDs on margin carries a high level of risk and may not be suitable for all investors. Leverage can work against you.
Stratos Markets Limited (tradu.com ):
CFDs are complex instruments and come with a high risk of losing money rapidly due to leverage. 63% of retail investor accounts lose money when trading CFDs with this provider. You should consider whether you understand how CFDs work and whether you can afford to take the high risk of losing your money.
Stratos Europe Ltd (tradu.com ):
CFDs are complex instruments and come with a high risk of losing money rapidly due to leverage. 63% of retail investor accounts lose money when trading CFDs with this provider. You should consider whether you understand how CFDs work and whether you can afford to take the high risk of losing your money.
Stratos Global LLC (tradu.com ):
Losses can exceed deposits.
Please be advised that the information presented on TradingView is provided to Tradu (‘Company’, ‘we’) by a third-party provider (‘TFA Global Pte Ltd’). Please be reminded that you are solely responsible for the trading decisions on your account. There is a very high degree of risk involved in trading. Any information and/or content is intended entirely for research, educational and informational purposes only and does not constitute investment or consultation advice or investment strategy. The information is not tailored to the investment needs of any specific person and therefore does not involve a consideration of any of the investment objectives, financial situation or needs of any viewer that may receive it. Kindly also note that past performance is not a reliable indicator of future results. Actual results may differ materially from those anticipated in forward-looking or past performance statements. We assume no liability as to the accuracy or completeness of any of the information and/or content provided herein and the Company cannot be held responsible for any omission, mistake nor for any loss or damage including without limitation to any loss of profit which may arise from reliance on any information supplied by TFA Global Pte Ltd.
The speaker(s) is neither an employee, agent nor representative of Tradu and is therefore acting independently. The opinions given are their own, constitute general market commentary, and do not constitute the opinion or advice of Tradu or any form of personal or investment advice. Tradu neither endorses nor guarantees offerings of third-party speakers, nor is Tradu responsible for the content, veracity or opinions of third-party speakers, presenters or participants.
Markets rally as missiles fly | how long can risk be ignored? Markets may be underpricing Israel and Iran risk.
Despite continued fighting—including high-impact strikes and rising casualties—global equities moved higher to start the week.
U.S. indices led the advance, with the Nasdaq gaining 1.5%, followed by the S&P 500 and Dow. Earlier in the session, European and Asian markets also closed higher, with Germany’s DAX up 0.8% and Japan’s Nikkei rising 1.3%. Now Asian markets are set to open for the second trading day of the week.
Tensions escalated further on Monday as Israel launched drone strikes on Iran’s state-run IRINN television headquarters in Tehran, interrupting a live broadcast. Additional Israeli attacks hit the South Pars gas field. In retaliation, Iran launched a fresh wave of missile attacks into Israel, killing at least five people.

Nikkei 225 H1 | Swing-high resistance at 61.8% Fibo retracementThe Nikkei 225 (JPN225) is rising towards a swing-high resistance and could potentially reverse off this level to drop lower.
Sell entry is at 38,245.01 which is a swing-high resistance that aligns with the 61.8% Fibonacci retracement.
Stop loss is at 38,500.00 which is a level that sits above the 78.6% Fibonacci retracement and a pullback resistance.
Take profit is at 37,855.58 which is an overlap support.
High Risk Investment Warning
Trading Forex/CFDs on margin carries a high level of risk and may not be suitable for all investors. Leverage can work against you.
Stratos Markets Limited (tradu.com ):
CFDs are complex instruments and come with a high risk of losing money rapidly due to leverage. 63% of retail investor accounts lose money when trading CFDs with this provider. You should consider whether you understand how CFDs work and whether you can afford to take the high risk of losing your money.
Stratos Europe Ltd (tradu.com ):
CFDs are complex instruments and come with a high risk of losing money rapidly due to leverage. 63% of retail investor accounts lose money when trading CFDs with this provider. You should consider whether you understand how CFDs work and whether you can afford to take the high risk of losing your money.
Stratos Global LLC (tradu.com ):
Losses can exceed deposits.
Please be advised that the information presented on TradingView is provided to Tradu (‘Company’, ‘we’) by a third-party provider (‘TFA Global Pte Ltd’). Please be reminded that you are solely responsible for the trading decisions on your account. There is a very high degree of risk involved in trading. Any information and/or content is intended entirely for research, educational and informational purposes only and does not constitute investment or consultation advice or investment strategy. The information is not tailored to the investment needs of any specific person and therefore does not involve a consideration of any of the investment objectives, financial situation or needs of any viewer that may receive it. Kindly also note that past performance is not a reliable indicator of future results. Actual results may differ materially from those anticipated in forward-looking or past performance statements. We assume no liability as to the accuracy or completeness of any of the information and/or content provided herein and the Company cannot be held responsible for any omission, mistake nor for any loss or damage including without limitation to any loss of profit which may arise from reliance on any information supplied by TFA Global Pte Ltd.
The speaker(s) is neither an employee, agent nor representative of Tradu and is therefore acting independently. The opinions given are their own, constitute general market commentary, and do not constitute the opinion or advice of Tradu or any form of personal or investment advice. Tradu neither endorses nor guarantees offerings of third-party speakers, nor is Tradu responsible for the content, veracity or opinions of third-party speakers, presenters or participants.

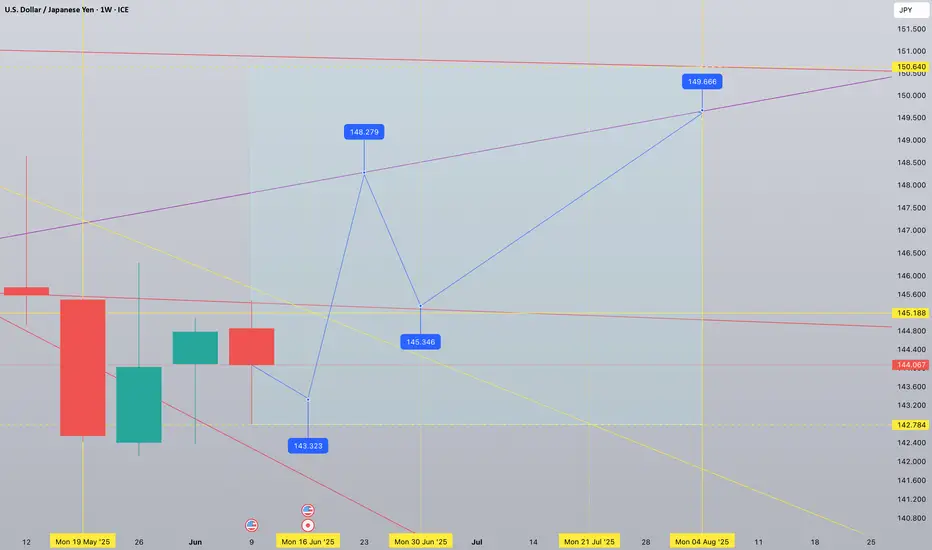
USDJPY 1W tf forecast until August 2025 Current midterm bias is bullish. 150,64 and 142,78 are extreme levels to be respected by the price action. One more week of red week of sideways movement will actually form a reversal pattern followed by a strong upward spike. A powerful breakout to 148,27 is to be retested at 145,34 - healthy retest. July will show an organic growth topping at 149.66 in the beginning of August 2025
NI225: Will Go Up! Long!
My dear friends,
Today we will analyse NI225 together☺️
The in-trend continuation seems likely as the current long-term trend appears to be strong, and price is holding above a key level of 37,817.93 So a bullish continuation seems plausible, targeting the next high. We should enter on confirmation, and place a stop-loss beyond the recent swing level.
❤️Sending you lots of Love and Hugs❤️
