Nikkei soon 5,10,20,25y long correction?Why i posted this chart, because i want to compare it with the BTCUSD 1M chart. I think BTC is similar as Nikkei in the early days, than 25y of corrections and sideways. I am asking myself can this also happen to Bitcoin?
Second thing is, it looks like Stocks - Nikkei will also enter into the bearmarket soon, like BTC. How long will last until uptrend again? What does that mean for Bitcoin? Will they put profits into Bitcoin?
Japan 225

NIKKEI Headed to a double top?I thought Japan was done, but apparently not. Looks like it's headed towards a double top, gonna go parabolic, lol.

NI225 Breakout anticipation I see ascending triangle so have placed buy stop above resistance because I'm anticipating the resistance level to be broken, I have a hedge order to reduce drawdown and a buy limit to scale in if it goes against me too.
USD/JPY correlation also supports this breakout idea as its showing a descending triangle

Nikkei225 - Great trade Opportunity! Nikkei 225 - Great Trade Opportunity!
What a great set up, right? I've been shorting NI225 for while. If you're subscriber of our weekly newsletter, you probably got in earlier at a better risk/reward! If you are subscriber - Thanks I appreciate it and if you aren't you're missing out! I post my analysis late on Trading View for great trade ideas...Subscribe now - Link will be down in the comment section (It's FREE & always will be) We will be changing the privacy settings soon for ONLY subscribers to see our content!
Now let's dive into the exciting Technical aspects:
Longer Term pattern: Triangle
Shorter Term Pattern: Bear Flag / Wedge
Key Support & Resistance Areas: 28000 - 28400
Key Tip: You could go to towards lower time frames to get a better price.
All the best,
Trade Journal
(Just a trade idea, not a recommendation)

NIKKEI225 SellPrice has broken out of the weekly uptrend and is descending towards the weekly support zone.
Comment Like Follow Share Inbox


Nikkei: Contrarian LongAt first glance, I was excited that the Nikkei futures were forming a 3 hump pattern similar to the one formed in February 2020 before the big dump.
then, I started noticing difference in volume / flow (CMF). Back then, the bearish divergence was quite clear, and now it's not all that clear. In fact, that sudden CMF increase looks a bit like bullish divergence similar to what we saw on the Nasdaq a few weeks ago.
Targeting a long from the 28000 area. If we don't get that low, I probably won't enter the trade.


Traditional market analysis 12/05/2020 #1Going through several FX pairs, the importance of the USD, all the important commodities (Gold, Copper, Oil) and finally some indices like the Nasdaq 100, S&P 500, Nikkei etc.

NIKKEI225 going longTVC:NI225 is in a descending channel, but in a bigger timeframe it looks like a bullish flag to me. Besides that, it hit key Fibonacci levels rebounded from there. I am bullish until above 30000.
The fundamentals are still bullish for me as the opening-up party just begun. However expect wild swings, as the speculators tried to "price-in" the opening up with leveraged positions, so both long and short squeezes are ahead of us, so try this idea with small positions.

NI225 Range Swing BuyNikkei has come to bottom of range, bounced of support and so I'm expecting it carry on to the other side of the range. I've layered my stoploss for some insulation also

First meaningful correctionNIKKEI will have its first meaningful correction in the coming weeks
###NOT FINANCIAL ADVICE###

NI225 Market ProjectionsG'day Guys
Nikkei been moving up and down since Feb 2021.
Am expecting this month movement will be bearish to complete the movement cycles and high probability bouncing on the Demand zone.
Which is showing the Support level strong. This indicate they progressive recovering to pre-covid environment.
Let's see what happen next. Remember, Nikkei Movement relatively effect JPY currency.
Thank you.

NI225 Range BuyPrice has come down to bottom of the range activating my buy limit, I'm anticipating it will return to the top of the range with assisted volume from US markets open. I also have a stoploss below range low

Nasdaq Diaries May Market Review In this video, I share some of our sentiments on the direction we speculate the indices to take for the month of May.
Nasdaq100
Ftse100
Nikkei225
Dax30
If you wish to learn how to trade stocks or indices you may DM me for more information.
Comment, like and follow.
Thanks for the support
Namaste

NIKKEI 28508.45 - 2.03 % * OVERVIEW OF PRICE ACTION, STRUCTURE &HELLO EVERYONE
HOPE EVERYONE IS DOING GOOD HAVING A GOOD ONE IN THE MARKET THIS WEEK, HERE'S A LOOK AT THE NIKKEI .
* follow your entry rules on entries
* significant moves with the bears change the plan.
lets see how it goes.
many stars must align with the plan before executing the trade, kindly follow your rules.
HAPPY TRADING EVERYONE & LET YOUR WINS RUN...
_________________________________________________________________________________________________________________________
ENTRY & SL - FOLLOW YOUR RULES
RISK-MANAGEMENT
PERIOD - SWING TRADE
__________________________________________________________________________________________________________________________
If this idea helps with your trading plan kindly leave a like definitely appreciate it.

NIKKEI 225: Next Move Weekly 12 - 16 AprWeekly Analysis for XAUUSD , you can start entry on breakout.
-AMD-

VDJP Daily - Another bullish set up in the makingThere is a large confirmed bullish inverse H&S (see prior charts) - and I was buying the dips around the 26.00 level into my ISAs and SIPPs. We have seen healthy consolidation over the past month and the etf now appears to be in the process of building a bull flag. This will be confirmed with a daily close above 26.70 and has a full target of 28.00. Given the already very bullish set-up, I will continue to keep adding to my position in anticipation of a further break higher. I will be rotating some of my funds out of UKX (which today successfully reached my full target) - as I believe VDJP offers better RR levels.

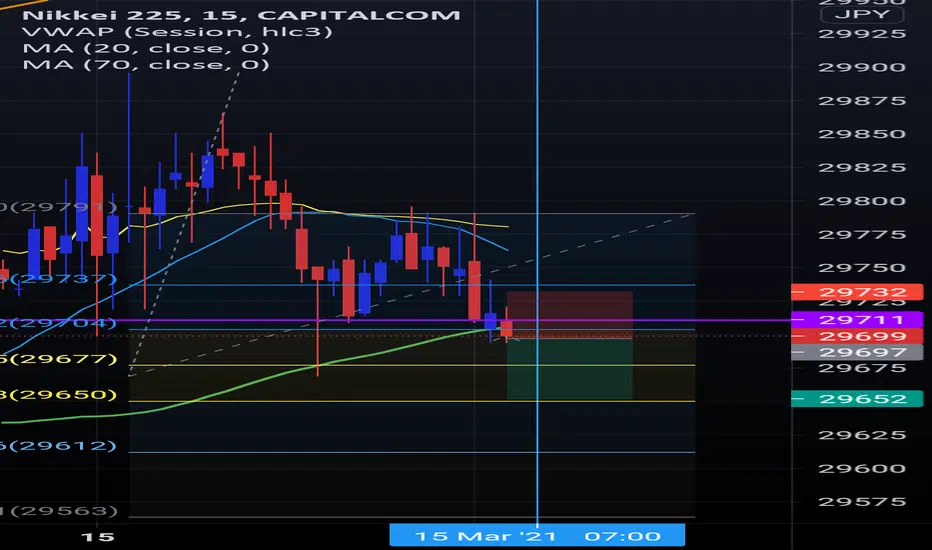
Nk long ideaBullish bounce from vwap, no trend - market is ranging. Targets at around day high/ top of range

Nk sell ideaCandles are closing below support, price has trended downwards. I think it can fall a bit further
nikke 225the leading index of japan is rising from the last bottom its looking for anew high after last pullback macd is positive on daily and 4H frame which is encourage me to take more long position spically when i keep in my mind the inflation effect right now these days on most of the market .
take this on your own responsibility

What's in my shopping list today !Here's a list of stocks, ETFs, commodities, currencies that I have went long recently :
Stocks :
Wilmar
Meituan
Geely
Beijing Airport
ZA Online
Baozun
NIO
Tencent
Yeahka
Lemonade
Amazon
Moderna
Tesla
Xiaomi
Stone Co
Baidu
Commodities :
Platinum
Gold
USOIL
Currencies :
EURUSD
NZDUSD
GBPJPY
Indices :
Nikkei 225
HSI
SPX500 (see chart)
Please note that this is not a recommendation to follow my trades as I would prefer readers to take time to understand their own trading/investment temperament, objectives , capital allocation, risk tolerance, etc before punching in the orders. Placing orders is a couple of minutes affair but what happened thereafter is crucial.
For example, you can see that for GBPJPY and NZDUSD, I have longed both pairs for quite a while, adding only occasionally though there were many opportunities to do so coz I need to allocate capital to other instruments that I am vested in. Again, how much to allocate in one product, I leave it to you to do your own research. Putting a % would be meaningless in this instance.
From this sample above, you can see that I am quite diversified in terms of sectors, countries, products,etc. So yes, you can say I am greedy in some sense, haha but in a good way, I assume.
Also, I am not able to filter find my commodities like copper , wheat, soy bean, etc in the search box as it comes up empty but if you go through the pages you would find them and I have also added some of those as well.
Once more, I apologised to those who are new to my trade posts and have enquired about certain stocks but I have yet to provide you the answers.
Have a great Friday , everyone and may abundance, peace and prosperity with all of you !!!!
