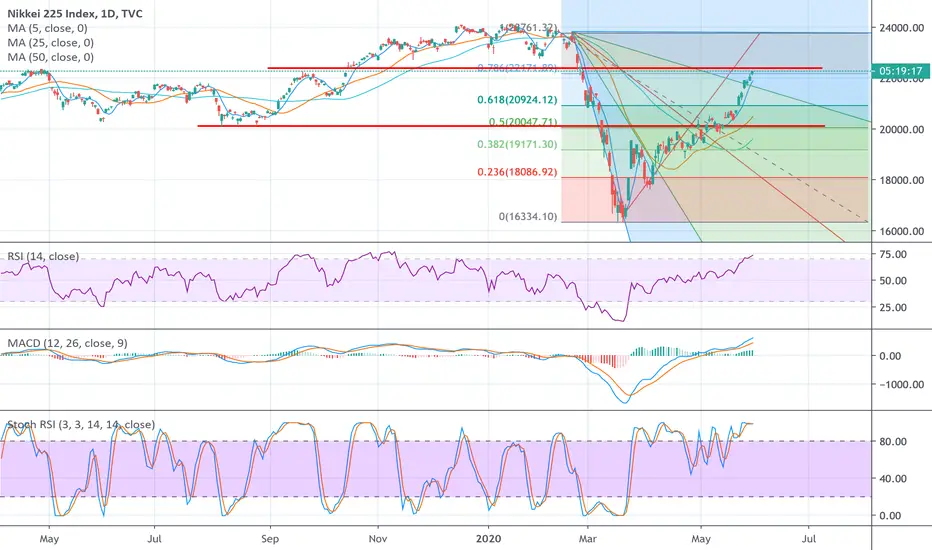
Is Tokyo (NI225) alarming?Can the Tokyo Index retreat to its long-term trend after strong sales that may follow the rising wedge formation?
So if this index is so negative, what would Europe, UK and the USA be?
Only personal opinions and ideas. Does not Include Legal Investment advice...
Japan 225

Land of the Rising SunIt is normal that we tend to look at our neighbours garden and think how pretty the lawn is and the neat rows of flowers they have. Sometimes, we over focus on outside of our own markets and neglect what's nearer to us.
In this case, we made the assumption that just because US is a big market, we should give it more attention and in doing so, we blind ourselves to the opportunities that are nearer to us. Japan has moved way ahead of the US markets as evidenced on the charts.
The amount of economic stimulus that Prime Minister Abe is injecting into Japan is simply staggering. Read article here
It has breaks out of the resistance level at 20,603 and is moving higher towards 24,000 mark. Wait for pullback, goto smaller time frame for better price entry.
Now, there might be little or no co-relation between Nikkei 225 and DJIA but can we say, both countries are injecting trillions of dollars into their economies ?
US may be affected in the short term due to the HK saga with China and the President may have something on his sleeves that nobody knows. I am of the opinion that bringing the market down is not to his favour in view of the upcoming election.
Let's see how this week the market performs.

Bottoms UPSometimes, when your life is too routine and the things you are exposed to are more or less the same, you become complacent. Go to work, come home, cook dinner, play games, sleep. Repeat and rinse.
In trading/investment, it can be the same as well. If you stick to your own local markets, the companies that are very familiar with (strong brand name, you are the customers for years, good review, etc), then you might missed out good opportunities.
Good opportunities such as markets in Thailand, Korea, Japan and Malaysia. For STI (SG market), it has only rebound from the bottom of 23 March around 22%. If you do some research, reading the news, etc you would know that these markets are faring better than STI.
They went up on average 43% from the bottom. Why wouldn't one want to make more money given the same time frame? Risks?
Unless you are venturing into the stocks in these countries which your broker might charge for a higher commission and custody fee, you are better off looking at the ETFs in these countries.
KLSE index (Malaysia) is EWM ETF
Japan index is Nikkei 225 index (futures) which most platforms will have or EWJ ETF
SET index (Thailand) is THD ETF
KOSPI index (Korea) is EWF ETF
Please do your own due diligence as the above is an example only. There are many ETFs that invest in these countries that offer different components mix and expenses. You want to look for one that offers the lowest .
I remain cautiously bullish on Asia markets now that the various countries are slowly reopening their economies and businesses are coming back as well. The consumers would still have to accept some inconvenience like putting on masks, keeping a social distance, no dine in at food outlets,etc. Other than that, being able to resume back to their pre-Covid 19 days is liberating for many who find staying at home stressful and suffocating.
Again, this chart is not exhaustive as comparing all available tradeable Asian countries would make the charts looks confusing. So , feel free to make your own index and/or ETFs comparison and decide if investing outside of your country is worthwhile, offering you a better ROI, etc.

NIKKEI225| BUY TRADE📈| TREND CONTINUATION🌟Hypothetical scenario:
(1) Entry @ 22955.0 (Buy LMT )
(2) Stop Loss @ 22928.0 | 27 points
(3) Target @ 23046.0 | 91 points
(4) R:R = 1:3.37
Stay tuned for the updates.
Follow and leave a like if you liked this idea and want to see more!
*DISCLAIMER*
This post is solely for educational purposes and does not constitute any form of investment / trading advice.

Possible scenario if America adopts NIR policy It was in February 2016 when Japan adopts negative interest rate policy. For the next 6 months or so, the stock market barely moves, consolidating between 15000 to 17000 range.
In Sept 2019, President Trump tweeted about his support for zero or negative interest rates policy and pressured FEDs to do it asap.In May 2020, he renewed his calls once more,claiming other countries are already enjoying the gift.
This is what the Fed's chairman, Jerome Powell said :
“When you have negative rates, you wind up creating downward pressure on bank profitability, which limits credit expansion,” Powell said in a congressional testimony.
President Trump is running out of time, with his reelection coming up in November 2020 and he needs to prop up the stock market to a new level. Could this NIR policy be his saviour ?
If the bear camps are right about this recovery as too sudden and premature, then we could see a retest of the March low again. (yellow)
Alternatively, this V-shape recovery could already be playing out and shooting for a new high. (blue)

NI225 - potential of more than 15% returnsNI225 had a very small correction afgter the end of leading diagonal wave 1 and it its now tracing the eraly stages of intermediate wave 3. If this is the case, the price should continue to trend to the most probable target at 26,576. If price crosses down 20,530 this analysis should be reviewed. FOLLOW SKYLINEPRO TO GET UPDATES.

NIKKEI possible correction aheadNI225 seems to have finished the intermediate wave 1 leading diagonal. The next move should be a correction to around 19,000, before the uptrend continues. If prices crosses up 22,000 this analysis should be reviewed. FOLLOW SKYLINEPRO TO GET UPDATES.

Nikkei - rally after a triangle patternThe Japanese main stock index - Nikkei 225 - has rallied after the completion of the ABCDE triangle pattern. The market jumped strongly towards the recent strong resistance which could be located near the recent tops (23980 pts).
If this area is broken we would expect another rally maybe even to 30000 pts. The technicians could also look at the stochastic oscillator how the price would react if it reached the overbought area.
________
Daniel Kostecki, Chief Analyst Conotoxia Ltd.
Materials, analysis and opinions contained, referenced or provided herein are intended solely for informational and educational purposes. Personal opinion of the author does not represent and should not be constructed as a statement or an investment advice made by Conotoxia Ltd. All indiscriminate reliance on illustrative or informational materials may lead to losses. Past performance is not a reliable indicator of future results.
66% of retail investor accounts lose money when trading CFDs with this provider. You should consider whether you understand how CFDs work and whether you can afford to take the high risk of losing your money.

Nikkei 225 Index price chart analysisNikkei 225 Index closed Friday's session at 21877.89 -38.42 down 0.18%. The Index held on above 21600.00 two consecutive sessions, but still to break at 22068.00. The critical support price point to watch in future sessions is at 21600.00. The Index could fall if it slips under 21600.00. Major events to watch today is at 09:50 Japan's capital spending YoY reports.

Elliott Wave View: Further Upside in NikkeiShort term Elliott Wave view of Nikkei (NKD_F) suggests that the rally from 5.14.2020 low is unfolding as a 5 waves impulsive Elliott Wave structure. Up from 5.14.2020 low, wave (1) ended at 20830 and pullback in wave (2) ended at 20247 as chart below shows. Internal of wave (2) unfolded as a double three (double zigzag). Down from wave (1) at 20830, Wave W ended at 20515 as a zigzag, wave X ended at 20685, and wave Y lower ended at 20245 as a zigzag.
Index then resumed higher in wave 3 which ended at 21730. Subdivision of wave 3 unfolded as another 5 waves in lesser degree. Up from wave (2) at 20247, wave 1 ended at 20550 and wave 2 ended at 20465. Wave 3 ended at 21370, wave 4 ended at 21150, and wave 5 of (3) ended at 21730. Pullback in wave (4) is proposed complete at 21410 and Index has resumed higher by breaking above wave (3) again. Near term, while pullback stays above wave (4) low at 21410, but more importantly above wave (2) low at 20247, expect Index to extend higher. As far as pivot at 20247 low stays intact, dips should find buyers in 3, 7, or 11 swing for further upside.

USD/JPY: Nikkei hints at more strengthCorrelations: The Nikkei index keeps recovering from the sharp losses and continued to form fresh higher highs and higher lows. The USD/JPY pair shows some divergence with the index, but the 108.00 level is a key hurdle to the upside.

NIKKEI INDEX, Confirmed Tripple Top, Further Continuation Ahead!Hello Traders Investors And Community, welcome to this analysis about the current stock-market and its situation, we are looking at the weekly timeframe of nikkei index and there are some meaningful signs which I discovered that will affect the price further next time. As the nikkei index is one of the major leading indexes representing the global economic spectrum it has its value in the current situation, the corona fears on the markets had hit the index similar to other major indexes as the spx 500 but the formation before is different and the ongoing price-action can be different to other indexes. I highly recommend that you watch the analysis where I point out the overall distributional events hitting the stock-market as an example in spx 500 to have a full-depth-overview about the current situation.
What is from high significant importance in the nikkei index price action that was built the weeks and months before the crash that it is actually a triple top which is a rare formation in global markets and signals the heavy reversal of the before established uptrend. As you can see in marked in my chart with the blue circles the third top confirmed the overall high in the structure before the corona-breakdowns happened and the market crashed down below support. The snap-back movement from 16470 to the actual price condition was neutral and normal after such a volatile move to the downside, there was also a breakaway gap that was filled but as we are approaching resistance here in the structure the continuum of the before established downtrend may come faster as expected.
At the moment we see the index exactly confirming the neckline of the Tripple top which you see marked in orange in my chart, this level at 20500 is actually also building a coherent and logical bearish resistance-cluster because it is corresponding with the 200-EMA which you see marked in black, this is an important EMA because it was support in the uptrend before and now it is resistance, mixing these significant signs all together we currently trade at an important resistance which will be realized when we get a sudden pull-back in the lower direction again as marked in my chart. The targets which you see in my chart will be realized when the index confirms below the lower boundary light blue-trend line, this will add to the bearish shape we actually have in the market. When considering the local support to behold at 18600 it is possible that the market moves one leg more to the upside but the question is if this move will be strong enough because there is a bunch of resistance which shouldn't be ignored.
This formation is playing into the overall stock-market situation which has a bearish shape. Some people believe that the bear market in stocks is over now and that we will see new all-time-highs in the major global markets but the percentage possibility for this scenario is at the moment pretty marginal because the real economy is still struggling with global corona restrictions and otherwise the economic landscapes still do not look worthful. When the little possibility fulfills and stocks see new highs the further bear-market which is coming will just be more dramatic and heavier, therefore, we need to concentrate on the anticyclical truffles within the markets which are going against the trend and profiting from the crisis.
In this manner, thank you for watching the analysis, support for more market insight and all the best ;)
Prosperity is the blessing of the old market, adversity is the blessing of the new.
Information provided is only educational and should not be used to take action in the markets.

NIKKEI where will it bounce? #tradingHave a look at this chart and let me know your thoughts - two minds better than one.

JP225USD - 1H SHORT Trend Trade Entry Setup - See Targets & StopJP225USD 1-Hour Chart
Price action pullback with pinbar at a confluence area: resistance zone, trendline, and ema.
Expecting to drop to first target price @ 20350
Enter SHORT @ 20560
Stop Loss @ 20725
Target 1 @ 20350
Target 2 @ 20250
Target 3 @ 20100

NI225 - possible correction aheadNIL 25 seems to have finished a leading diagonal that ended intermediate wave (1). In this scenario prices should correct to around 18,000 before going up again. FOLLOW SKYLINEPRO TO GET UPDATES. A move above 21,350 would void this analysis.

JPN225 M30 short opportunity (wedge+fibo)JPN225 broke a rising wedge and went back to the 50% to 61.8% Fibonacci zone, for a nice short opportunity

Nikkei 225 Index (JPN225) Short Trade Explained
Short trade went active on Nikkei!
Reason:
the price reached a resistance line of a rising wedge pattern on daily
+ double top formation on 1H with a confirmed breakout of minor support.
I entered short based on retest (382 retracement of a small bull leg)
stop - 20585
t1 - 20050
t2 - 19770
risk: 1%

SPX vs other markets since 2020Hi Guys,
following my post dated Apr.14th (red arrow before n.3), the Index continued to climb up towards the SMA with a four legs movement made by 4,5,6 and 7.
So far the pullback from A or, in my view, the "Bear Rally" retraced 0,618 Fib.
1) from X to A represents the fall caused by pandemic;
2) A was made when the FED used its "bazooka" (2200 same level when Trump was elected US President);
3) a pullback or "bear rally" is happening from A into Fibonacci Retrecement levels or 200SMA or even beyond.
The idea remains the formation of a W-Shaped recovery as favoured by many FED Members incl.Powell. However a V-Shaped recovery cannot be excluded as the letter B is yet to be confirmed as the "Bear Rally" may not be over yet.
As the pandemic event originated by Covid19 triggered an enormous amount of "FEAR", please keep an eye on the VIX ("Fear Gouge" or "Fear Index").
Here below I will post snapshots of other markets for comparison.
Thank you for your support and for sharing your ideas.
Disclaimer:
Please note that I am not a professional trader and these are my personal ideas only. The information contained in this presentation is solely for educational purposes and does not constitute investment advice. The risk of trading in securities markets can be substantial. You should carefully consider if engaging in such activity is suitable to your own financial situation. Cozzamara is not responsible for any liabilities arising from the result of your market involvement or individual trade activities.
IMHO: The point of trading is to make money. To make money you must have money. Depending on the money at your disposal, you can decide what to do and how to do it. By having stops you decide how much you are willing to lose. By having targets you decide how much you want to earn. Be disciplined with your protocol and with your strategies for trading. Sometime you win, sometime you lose. Don't be greedy. Be realistic. Be wary but not afraid. Be curious. Use your brain. As long as your working process make sense and your spirit is calm, everything will be fine. Be patient and be prepared for any circumtances.


All Major Indexes ComparisonAfter some major Correction/Crash on the major Indexes such as SPY and Gold and Bitcoin, now all of the worlds are bearish on the markets.
But as you can see chart says nothing about Financial Crysis, Depression, ... .
Because of that, I think these Indexes probably have seen their lows. although there could be a correction in the way I don't think they will see new lows.
This chart is open:
www.tradingview.com


Drawing Parallels to 1990s Nikkei 225 CrashToday I'm comparing the structure of the 1990 infamous Japanese Bubble to today's SPY.
