NIKKEI 225 - possibility of 40% of gains in couple of yearsNI225 finished primary wave 4 and is now tracing primary wave 5 up that should elevate the index to themost probable target of 28,000 in around 2 years. If the index crosses down 16,300, this analysis should be revised. FOLLOW SKYLINEPRO TO GET UPDATES.
Japan 225

Short-term Nikkei225 ShortFrom the 20000 levels is a good shorting opportunity on Nikkei down to 19000 levels or perhaps below.
With a proper SL you can make good profit. Calculate the risk and manage your margin levels and you could make it.

Is a Bearish Movement coming on NIKKEI? By ThinkingAntsOkMain items we can see on the Daily Chart:
a) Currently, the price is on a corrective formation (circle)
b) We can see an exact formation like the current one on the past
c) Also, it is important to say that both are happening in the same zone
d) If we take the previous one as a model of what can happen with the current one, we can expect a bearish movement to come
e) The bearish Target we will be aiming for is 15.000

Trend change at NI225?Trend change at NI225?
It depends on MACD and Moving Average. Some will sell by risk hedge before Golden week.

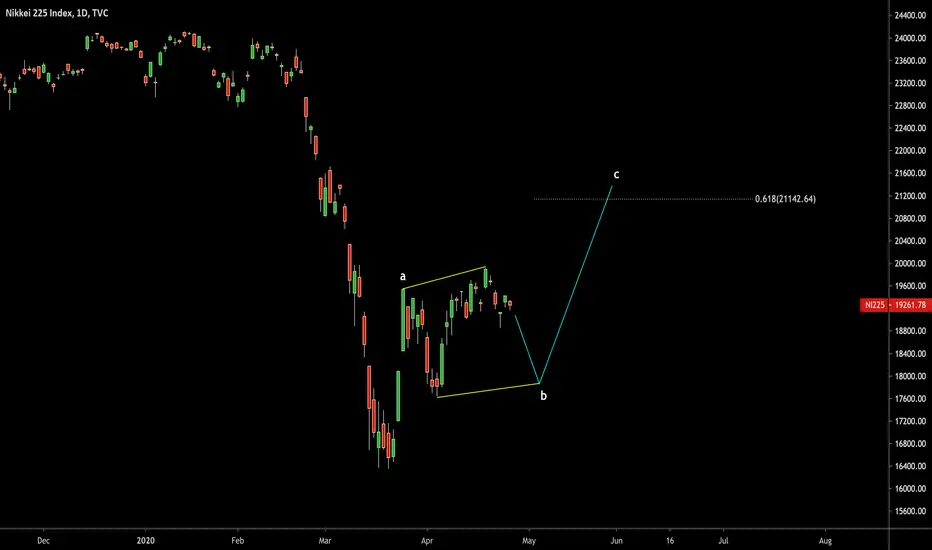
Nikkei: possible map for zigzag correctionABC zigzag could be built here to reach 61.8% Fibonacci retracement
the wave B is in progress now
Short movement on Nikkei by ThinkingAntsOk Use this as a guide to develop your view.
Main items we can see on the 4HS chart:
a) The price made a huge bearish movement and now is making a correction
b) If we take a look into the past, we can see a similar situation (circles)
c) Currently the price is on the same resistance zona that in the past where the new bearish motive wave started
d) We think that a similar scenario may happen, with a target on 15000.00


NI225 (JPN225)Hi Traders !
This monthly chart analysis shows that the NI225 is on a downtrend. However, since March 2009, the trend kept on a bullish trail, starting from 7021, and reached its highest level since april 2000, e.i. 20946.
After a correction that lasted 10 months, it reached its peak of 24448 on Nov 2018.
The year of 2019 was strongly bullish. By the start of 2020, the price plunged due to Corona virus.
If the latter never occurred, I assume that we would have witnessed the opposite scenario. Now that things began to change, let's wait and see how strong the trend will break the top of the pitchfork.

NI225 technicaly based forecast
📌Short intro:
I am full time trader - analyst * High accuracy of ideas * Technicaly and Fudnamentaly side in analysis * Comment if have any questions or want to send support * Price action - FIBO - Candl pattern * FX - STOCK - CRYPTO * Simple ideas
💡 NI225 technicaly indicators showing we can expect higher bulish market continuation, FIBO 0.382 which is in some cases stong supp is breaked, good bulish candels foramtion, expecting to see push in price till FIBO 0.6 on same place i and supp trend line.
📌Have on mind, trading involves risk, check idea on your own tactic, if have questions pls comment!
Thanks on supporting!
All best, good luck!

NIKKEI 225 - new highs aheadNikkeI index has shown indication that it had finished primary wave 4 and it's beginning primary 5 up, which is a nice impulse wave to be in. Primary wave 5 should push the index to levels higher than the previous primary wave 3 during the next couple of years. In the short-term, NikkeI is beginning minute wave 3 up in a good point of entry. An alternative scenario can command if the index fall below the low of primary wave 4. FOLLOW SKYLINEPRO TO GET UPDATES.

NIKKEI 225 - more than 10% gains in next 10 daysIn our previous post of April 5, we anticipated a rebound in NI225 after the completion of primary wave 4 that would led to a steady growth ahead. Since then the index increased more than 7% and the odds increased that intermediate wave 1 is under way up. The index completed minor wave 2 and it is now tracing the longest and strongest wave of this degree. The next target should be around 22,000 (12% gains) and take up to 10 days to reach it. FOLLOW SKYLINEPRO TO GET UPDATES.

Some evidence drop in NIKKEI 225 MACD dealt killer blow to SPXSome evidence that drop in NIKKEI 225 MACD to <0 followed by SPX close below monthly 50 MA dealt killer blow to SPX. Caveat small sample size. NOT ADVICE. DYOR.


NIKKEI 225 is going back to near all time highInverse H&S pattern formed awaiting confirmation on breakout, verified by diminishing volume into the breakout and the recent strong price action.
If breakout succeeded will send it to 23,200 -ish. Aligns with my prediction on SPX to 2,900
###This is not an investment advice, trade with care with your own risk!###

NIKKEI 225 prediction on 2020 year by Powerful TraderHello everyone!
Traders we do not like to write more.
The prediction of the price you can find on a chart!
Regards, Team Traders "Powerful Traders"

Yen Appreciates for Third DayDespite a drop in the Nikkei 225, Japan’s stock index, the Japanese Yen has seen 3 straight days of gains now against the US Dollar. In contrast, the Nikkei dropped back below 18,000 points, a one week low.
Traditionally a very stable currency pair due to both currencies being strong safe havens, USD/JPY was steadily rising in the months leading up to March. However just like every other market, it was not safe from the extreme volatility brought on by the global coronavirus outbreak in March. After dropping all the way below 103, the Dollar eventually rebounded against the Yen to trade at ¥111 to the Dollar, influenced by the rise in strength of the greenback following a pullout from investors from assets back to liquid cash in order to minimise risk. It is currently trading at ¥107 against the greenback.
Investors are also looking towards the Yen once again as a safe haven, as it remains a strong currency in times of economic uncertainty, and this is certainly one of them.
However, the Yen’s current status may be short-lived, amid growing sentiment that Tokyo may soon come under lockdown due to the sharp increase in coronavirus cases in the city. This new rise comes shortly after the 2020 Tokyo Olympic Games were announced to be postponed until Summer 2021, leading some to question whether or not the Japanese government had been suppressing figures in order to keep the Olympics going ahead.
The governor of Tokyo has urged citizens to avoid karaoke- the popular Japanese pastime- in order to maintain social distancing, despite warnings from senior health officials to put the city under lockdown before it is too late. Japan’s economy minister has warned that a lockdown of the country’s biggest cities would have disastrous effects on the Japanese economy. Prime Minister Shinzo Abe has also stated that a state of emergency is not yet needed, but that Japan could enter a situation like Europe very soon.
The Dollar also weakened once again following White House officials projecting that around 100,000 to 240,000 more deaths would occur in the United States due to the coronavirus. US President Donald Trump also gave warnings that the coronavirus would continue to worsen, backtracking on his statements from the previous week that he had expected to see the States reopen by Easter. However, he is still resisting calls to issue a nationwide warning to tell Americans to stay home. The Trump Administration’s lack of action has led to State governors to take action of their own. California and New York are continuing to be under lockdown, and an increasing number of states are also extending or adding their own stay at home orders.

The Mother of All Bubbles - Bitcoin vs StocksHe everyone,
Been a long time since I posted a chart/comparison.
All major stocks are represented here and compared with Bitcoin. Bitcoin is in its own merits an index for the whole cryptocurrency market, and every crypto-trader/enthusiast knows that when Bitcoin moves up or down, the whole market usually moves with it.
The whole economy, including the crypto-economy, had been going up since 2008, and the rise was steeper and higher than anything seen before. Everything built on leveraged trading and loans. The clock was ticking on the bomb, but it also required a button to be pushed to initiate the detonation sequence... enter COVID-19.
A quarter of the world population is in lockdown right now. This essentially means only the work which is essential, is being carried out. Forget about ambitions or new ideas to be brought to life, this is now about survival.
As per Maslow's hierarchy of needs, the basic need of health and security is being threatened. The ones of the top do not take priority at this time. And this need is going to be under threat for months, and may be challenged in waves. (www.thoughtco.com)
There is no demand and will be no demand for anything else for months now. I don't need to point out that the supply of products is usually done prior to the demand in anticipation, hence there are stocks load of products which may go past their expiry date and may not be of use. That will lead to other waste of resources.
Economy is going to face the biggest challenge yet, and will rival the great depression of the 1920s.
Stay safe and make decisions which you can stand by and do not regret later.
All the best!

USDJPY - SHORT REVERSAL HARMONIC PATTERN *sellstop @108.00 and target @101 | buystop @113.500 and target @118.500
*A well suited Bear Harmonic pattern formed in USDJPY.
*111.500 acts as strong resistance,which may reverse price to 100 in long term (JPY may get stronger in future weeks).
*On failure of sell trigger @108.00,we can expect a buy trigger @113.500.

Nikkei 225 the First to Recover, Gold Facing Historical Shortage The Nikkei 225, or Japanese Stock Index had an 8% gain for the day, following on from its 7% gain from the previous day. Less than a week ago the Nikkei had just hit lows not seen since 2017, falling below 20,000 points. However in just 2 days it has made back its losses and is now rapidly on the rebound back to the 20,000 mark.
As well as this, other Asian stocks are on the recovery as well, with the Hong Kong Hang Seng Index, Korean KOSPI, and Shanghai Composite all on the upside.
In Europe, the UK FTSE 100 is following suit, with a 2.5% increase for the day.
Following on from this, it is reasonable to expect the US stock indices to produce a similar pattern in the upcoming days. US stocks have already started to recover, with the Dow Jones posting its best single day session since 1933, rising 11.4%.
This market optimism comes after the US Senate finally agreed on passing the $2 trillion coronavirus bill. The bill, which had been in dispute over the last 2 days due to being blocked by the Democrats, has now been settled with a deal being reached, although the final vote still needs to be made. Although details still need to be agreed upon as well, the gist of the bill is that $250 billion is to go towards directly paying individuals and families, $350 billion on small business loans, and $500 for other companies, amongst others. This is expected to be the largest ever economic stimulus package ever passed.
The 2020 Tokyo Olympics have also been officially postponed, after several weeks of discussions. While Japan was originally adamant about the Olympics going ahead despite the alarming growth of the coronavirus pandemic, today they were finally forced to postpone the games until 2021. Japan was initially extremely reluctant to make this move, as it would’ve been the first time in the 124 year history of the modern games that they had to be postponed. Olympic officials said that the games would be postponed to a date before Summer 2021, but no later than that, and that the flame would continue to stay in Japan for the time being.
In other news, gold is facing a historic short squeeze, as New York is currently under lockdown. The movement of gold has been severely impeded by the coronavirus, as metal refineries have been forced to close, and all travel has been severely restricted. Normally, in the case of such a shortage in New York, suppliers would ship from overseas locations. But the travel restrictions mean that there is the possibility that the supplies could become trapped, making banks and traders reluctant to do so. Even in other times of economic hardship such as war, gold refineries have not had to close.
The price of gold, which had been on the recovery as well this week, has now fallen again, down 1.8% back towards the $1,600 mark after looking like it would reach $1,650. This move could also be attributed to investors discarding the safe haven asset after the announcement of the $2 trillion stimulus package, as risk appetite improved.

Equity Markets showing Reversal on the 4 Hour?First off is the Nikkei 225. We had a break out earlier today which also confirmed a head and shoulders bottoming pattern. The lower high and lower lows began to exhaust. We are now awaiting for our first higher low swing here to confirm this uptrend.
Second is the German Dax. We had our breakout, and are now approaching the major 10,000 level. From here, would like to see 10,000 tested before a pullback and then a breakout creating a head and shoulders pattern and giving us a higher low to confirm an uptrend.
The Russell 2000 is close to the Dax set up. We are watching for this breakout. Similar to the Dax in a way that we would like to see a move higher before a pullback and then a head and shoulders confirmation breakout. The Russell may also be a leading indicator on what we will see with the larger US equities.

Nikkei 225 Index finishing primary wave a, chances for a reboundThe Japan index has been in a super-cycle corrective pattern since the beginning of 1990 and it is currently finishing primary wave A of a possible triangle pattern . If the end of wave a is confirmed, prices will move up in a counter-trend path, before continue downwards in wave C.

NIKKEI LONG TRADENIKKEI rejected from demand zone at level 16222 with strong bullish movement
Price rejected now from angle 120 (GANN cycle line) which represents as a resistance level at 18009
It's expected to retest key level and 50% Fibonacci level of preceding bullish wave at 17497
then rebound from lower edge of price channel to target the supply zone at level 18915 which represents angle 180 in (GANN cycle line)
