Nikkei 225 index formed bullish Shark | A good long opportunityPriceline of Nikkei 225 index has formed a bullish shark and entered in potential reversal zone.
I have defined the targets using Fibonacci sequence as below:
Buy between: 20094.62 to 20460.02
Sell between: 20779.31 to 21503.43
Regards,
Atif Akbar (moon333)
Japan 225

Nikkei Break Out Nearing?Our Dax and ESP 35 trades are continuing as mentioned in previous posts. It seems cheap money and easing will keep stocks propped as there will be nowhere to go for yield. Of course, a geopolitical issue or black swan event can nullify this...and I believe there will be a confidence crisis approaching.
However, we will deal with that when it appears and the bond market will give us the signal for this.
I like what I see here on the Nikkei. A nice downtrend with basing/range. You can say a cup and handle pattern too. Let us await for a break above this resistance one.
Other confluences fake out candles and engulfing candles at the major support below, indicating that we may have shown 2/3 market moves (downtrend and range).

Nikkei Soars Boosted by Conciliatory Tone on Trade War (02)This chart corresponds to the Nikkei daily chart from our article "Nikkei Soars Boosted by Conciliatory Tone on Trade War#

Nikkei Soars Boosted by Conciliatory Tone on Trade WarAsian stocks markets it's traded mostly bullish this Friday aided by a conciliatory tone between China and the United States. This week, the Nikkei 225 (CME:NKD) index futures soars 2.38%, but in the long-term, the Japanese index could see more drops.

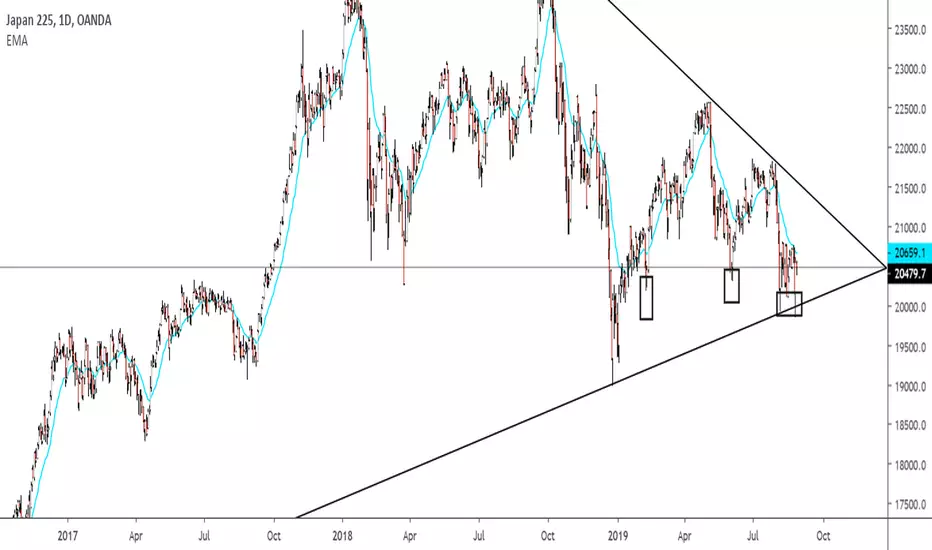
Nikkei Demand Wearing ThinA significant level of support (20500) is again being tested... The biggest test the level has had so far.
Up to now every test of the 20500 level has seen a quick 'touch and go' reaction, where supply has very quickly hit demand (waiting buy orders) and price has bounced away with strong momentum.
This time looks very different and suggests that the demand in this area is wearing thin, with sellers having their best chance so far of breaking through this level... If a breakdown in demand does come through and we see a daily close below the current congestion, then expect a swift retest as resistance before dropping to the low of December around 19000.
If the level is able to hold and we start to see some strength in the OBV, pushing positively away from its 20ema then price will meet some heavy resistance at the top of this current triangle.
I expect this to all play out over the next few days and will be heavily influenced by any Trump Tweets and US-Sino trade talk headlines.
Elliott Wave View: Nikkei Looking for More DownsideShort Term Elliott Wave View in Nikkei suggests the decline to 19900 on August 6 ended wave (3). The Index is currently in wave (4) bounce and the internal subdivision is unfolding as a double three Elliott Wave structure. Up from 19900, wave W ended at 20795 as a zigzag. Wave ((a)) of W ended at 20650 and wave ((b)) of W ended at 20220. Then the move higher to 20795 completed wave ((c)) of W.
The Index then pullback to 20075 which ended wave X with internal subdivision as a zigzag. Wave ((a)) of X ended at 20300, wave ((b)) of X ended at 20765, and wave ((c)) of X ended at 20075. Wave Y is in progress with the internal subdivision of a double three in lesser degree. Up from 20075, wave ((w)) ended at 20685 and wave ((x)) ended at 20450. Near term, while above 20075, Index has scope to extend higher towards 20974 – 21530 area to end wave Y of (4). Expect sellers to appear from the above area and Index to either resume lower or pullback in 3 waves at least. We don’t like buying the Index.

Cold it be a Cup & Handle formation?Cold it be a Cup & Handle formation?
It may be developing into one, possibly, no?

NIKKEI Potential Bearish Gartley PatternAs described on the chart!
NOTE: "POTENTIAL" Gartley Pattern

Nikkei 225 Could See a New LowThe futures of Japanese index Nikkei 225 (NKD) it's been traded mostly bearish. During this month, NKD eases 4.98%. In this post, we'll review the short-term Elliott Wave structure and what to expect from this index for the coming days.


Head/Shoulders at $JPN225 $NIKKEI open tonightIn pre-market we are backtesting the neckline. Get ready for some follow through after today's rebound.

Hit volume support Price hit kumo cloud on 4 hrs and also volume (AD) support. We should see a bounce to the next swing high.

CADJPY | Trade No.2Cad has been showing weakness across all pairs, so this may be a turning point for price. Volume was strong at the beginning of today (July 21st), and price as fallen past the area of opportunity triggering an entry.Taking 50% of profits by 100 pips and letting the trade run.
Trade at your own risk under your own terms. I'm not responsible for anyone's decision to follow MY idea.

Elliott Wave & Intermarket Analysis For NIKKEI And USDJPYHello traders!
Today we will talk about stocks, specifically Nikkei and why USDJPY can see higher prices.
Well, as you may already know, in EW theory after a three-wave corrective decline, the trend should remain to the upside. This is what we see in the stock market all the time. However, Nikkei got our attention, because we can see a nice five-wave rally after that three-wave a-b-c correction, which means that Nikkei remains in uptrend, but after another three-wave correction in the lower degree, where ideal support would be here around 21450 - 21250 levels, just keep in mind that bullish confirmed can be only if it manages to turn back above 21770 region!
In the right picture you can see tight positive correlation between NIKKEI and USDJPY, which means that if NIKKEI points higher, then even USDJPY can see higher prices, so don't be surprised if USDJPY remains bullish towards 109 area or higher!
So, seems like risk-on sentiment may continue and when we are in risk-on, we usually see bullish stocks, which are followed by recovery on XXX/JPY crosses. That being said, be aware of a bullish continuation on stocks, while XXX/JPY cross pairs may see a bigger recovery!
Be humble, trade smart and wait for the right sentiment to enter the market!
Disclosure: Please be informed that information we provide is NOT a trading recommendation or investment advice. All of our work is for educational purposes only.

Australia Equities Index Back to 2007 HighsAustralia's primary equity index (ASX) is seen here through the S&P/ASX index (XJO). Here we can see that ASX is retesting its prior highs from 2007 before the great recession hit. Will be watching for a good-sized pullback soon given the vertical run that the ASX has been on this year. Will that have any impact on the U.S. or other major stock markets? Not sure, but I don't think that would be out of the cards either.

Nikkei Potential Head and Shoulders?The Nikkei is showing a potential head and shoulders pattern on the 2 hour chart. If we do break below the support at 21620,
then we would await for a lower high which would be a retest of the break.
However, ideally, would like to see a bounce and then a lower high which would make the head and shoulders pattern.
Price is turning at a resistance zone (21800) zone which adds further confluence.
This is a trade that can possibly play out next week. Keep it on your radar!


AUDJPY | Trade No.1AUDJPY is on it's way up. My area of opportunity highlights the area of my entry. Being so close to a high volume price and low volatility will provide a violent move to the upside. Taking 50% of profits by 100 pips and letting the trade run.
Trade at your own risk under your own terms. I'm not responsible for anyone's decision to follow MY idea.

NI225 uptrend continuation Next target for NI225 is around 22300 resistance and may break or see a downward movement...

JP225 analysis for next 7-10 daysConsidering many positive factors in the worlds politics and economy JP225 has a great chance to rise in next week.
Also, other indexes can rise, but JP225 has the greatest technical levels to minimize possible risk.
If something important happens, I will update the post.


Global Financial Engineering Swing Trading Strategy for Nikkei We have decided to take a bullish trade at 21309 with a Global Stop Loss(GSL) at 21100 and a Global Profit Target at 22498
The Primary Trend (PT) given by the Monthly TIME BAR (MTB) is currently Bearish
The Secondary Trend (ST), given by the Weekly TIME BAR (WTB) is currently Bullish
The Medium Term Trend (MTT), given by the Daily TIME BAR (DTB) is currently Bullish
The Short Term Trend (STT), given by the Four Hour TIME BAR (FHTB) is currently Bullish
This is a high risk trade since the Primary and Secondary Trend are still bearish. We are taking this trade in the direction of the Medium Term Trend which is given by the Global Daily Time Bars(GDTB).
In light of the above trend analysis we will start a bullish trade using Global Trading Strategy #4 on the Global Automated Trading System #4 which trade in the direction of the Global Daily TIME BARS (GDTB).
Global Entry Signal: Buy @21309
Global Stop Loss: 21100
Global Target Profit: 22498
Global Trade Management Strategy: We will applied the Global Trailing Stop System for Global Trading Strategy #4
--------------------------
The analysis in this material is provided for information only and is not and should not be construed as an offer to sell or the solicitation of an offer to buy any security.
To the extent that this material discusses general market activity, industry or sector trends or other broad-based economic or political conditions, it should not be construed as research or investment advice.
To the extent that it includes references to specific securities, commodities, currencies, or other instruments, those references do not constitute a recommendation by Global Financial Engineering,Inc. to buy, sell or hold such investments.
This material does not and is not intended to take into account the particular financial conditions, investment objectives or requirements of individual customers.
Before acting on this material, you should consider whether it is suitable for your particular circumstances and, as necessary, seek professional advice.

JP225 Sharp Decline UnderwayPrice have broken below cyclical support, making new lows.
Failure to close back above the cycle line would suggest a further decline in price.
