USDJPY and Nikkei: Potential reversalWe have a nice short opportunity in these charts.
It's more evident in the case of USDJPY which offers a clear target and invalidation level.
In the case of the Nikkei, it's at the level of a long term resistance, and showing a painful advance, not something I'd consider bullish in my view, and to make things worse, the highest low has been taken out by a down bar.
We can enter short positions with confidence, keeping a reasonable stop, based on 3 ATR(11) in the case of the Nikkei, and slightly above my purple invalidation level in the case of USDJPY.
Target would be the horizontal line below initially, where I'd suggest covering half of the position and moving the stop loss to break even in case it continues to fall.
Japan 225

Nikkei: UpdateCorrection started, as expected.
We now have a bearish target in sight: 19184 by April 27th.
This level and date will be a potential retracement area, or reversal, depending on how price action evolves.
Considering the scale of the uptrend, I don't think this correction will end there, but we'll see.
Better expand as we move forward.
I am short GBPJPY, and monitoring SPX, EURJPY, AUDJPY and USDJPY for important clues about this large development.
Will post updates here.

FXY: How long can the Yen carry trade last?There's a monthly time at mode expiration in this instrument coming next month.
It's possible to see a reaction as carry trades get unwound, but it's not clear at what price yet.
The extreme target is not reached, but the time at mode one has been exceeded, and heading for 2x the projected range soon.
I think the dollar rally is about to hit its expiration date, regarding the Euro and the Yen at least, but it can last at least one more month.
Looking at usdjpy closely, and also monitoring the S&P500, TLT, Dax, Nikkei and gold.
These are very interesting times to be a trader!
Will update with more insights and potential trade setups as they come.
Good luck,
Ivan.

Nikkei: Downtrend signal after today's closeIf price closes without retesting the mode, we might see a steep decline ensue.
Entry is at market (below the previous daily low), and the stop loss at the mode.
Good luck!
Ivan.

Interesting zone right now for Yen crosses this weekWatch this current zone. An over-and-under pattern and fib 261.8 lurks below and the Weekly pivot is the magnet above.
Either way PA choose it sets a the path for the Yen crosses this week.

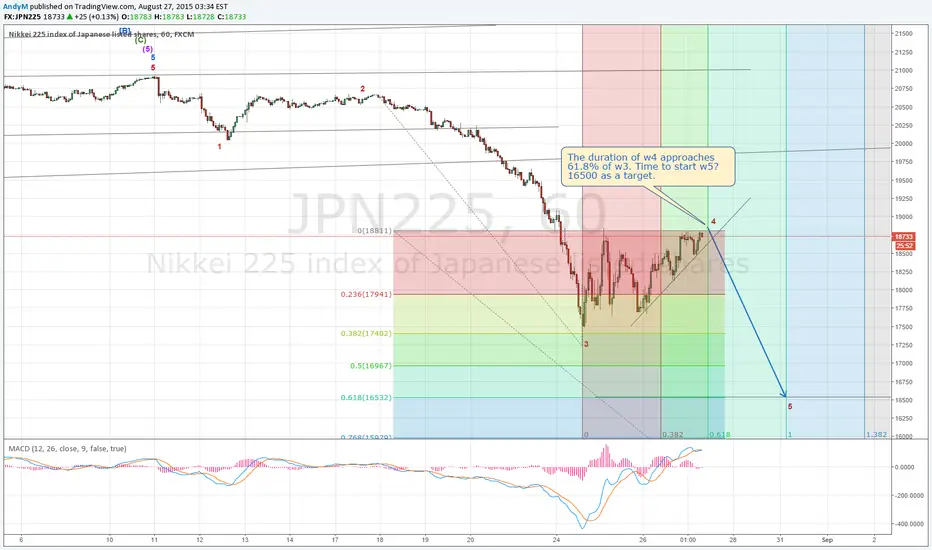
Experimenting with Trend-based fib time tool - short NIKKEII just discovered that TrView has a very neat tool for applying fibo ratios to trend duration.
Called "Trend-based Fib Time".
Since the duration of the correction often lasts 61.8% of the trend, there we have it - NIKKEI (and others) seem to be approaching this very milestone. It looks like a shorting opportunity to me.
NIKKEI is a high beta index, offering larger swings than SPX, so why not give it a try?
NIKKEI one more upswing pendingSo NIKKEI has almost made it to the new high and went into sell-off mode. Because we are running a motive wave up - it needs to contain five waves. We've seen three: up, down, up, now running forth down, so there's still one upswing left in the present ascending wave. Same for other indices. All point to the start of a major sell-off end Aug, but not yet there.

Nikkei: Tight stop long tradeThe Nikkei is offering a nice tight entry on the long side.
Risk 1/2 position on this one, entry is market now, stop at 20462, tp at 26720.
Will trail the stop on a daily basis.
The quarterly chart shows a valid uptrend in place, with time left until July 2016.
We are also above the biggest time spent at price level in the whole chart's history, with the next significant resistance at 21244 and the next at 26720. If we manage to survive in this long and cross the first level, it might continue up and hit the second one, making this a very attractive entry. The horizontal ray on the daily chart is a vixfix 75% retrace level, caused by smart money buying into a strong decline, one of the key levels demonstrated by Tim West in his publications. (he uses Vix though, for S&P500)
It's possible that we see a crash this year though, since this is so overextended, specially if S&P500 crashes like I expect.
Good luck,
Ivan.

$NIKKEI - Extended Third WaveI'm still bullish on the Japan. QE /made in #Kuroda/ pushes indexes higher and higher. Rumor has it the new QE in October /after FED #ratehike??/.
thepatternsite.com

Nikkei expanded the correction pattern. Nikkei was under huge pressure today. Regardless the reason behind the move, I identify it as the 4th wave correction(Purple). I expect the price action of this 4th wave to be confined by the black pitchfork. It could possibly spike lower and test May 2007 high at 18306. I think buy dip into that area and sell the first rally into the medium line is good play here.

GBPJPY: Worth a small entry hereAnalysis on chart, GBPJPY dropped into a previous uptrend mode support.
Might give us a good entry on the back of news releases today.
Risking 1% on this entry. Won't have a take profit level, but it might stall at the one on chart.
The Nikkei might correct today, it's fairly probable.
Good luck,
Ivan.

NIKKEI is approaching the reversal point in a couple of daysS&P reversed in May, and re-confirmed its reversal this week. Nikkei is approaching the reversal point just now. There is just one tiny subwave 5 left, in which the market may try to set a new high or match the previous one. After that we are going to observe a quick (1-2 months) retracement of the ending diagonal, travelling to 16500-17000.
I think the first trading day of the month, 1st July, as usual will be a good starting point for a sell-off.

Nikkei: Short term short setupThe Nikkei is correcting the last upward leg in the daily chart after signaling a 3 bar daily uptrend, time expires today, and the 4h chart paints a clearly bearish picture.
The minimal target is on chart, and to enter the trade I'd look into selling a range expansion down bar out of the mode at 20785.
You would have to use my indicator and wait for a bar to turn red to market sell, or sell now if your strategy allows it.
Mine doesn't, as price sits in a triangle right now, with conflicting shorter term trends colliding, I'd advice against jumping the gun. The linear regression is another cue, a breakout and 1 bar close without touching the mode is the go signal.
Good luck!
Ivan.
PS: you can also use this chart as the opposite, a cue to go long Nikkei and/or USDJPY after confirming the selloff (which would take price into my buy area in the case of the Yen)

USDJPY: Longer term perspective is still bullishI've been watching this chart closely, and I think we might see a great buy setup in the near short term.
Eyeing the area between 121.43 and 122.34, with invalidation for this signal below 118.968, potential upside is 137.94 in 6 months or less.
We don't get significant trends in FX very often, and this is one of them. I'll be monitoring the Yen to enter a longer term position in it, since I consider the risk/reward and probabilities to be on the bullish side here.
The fundamental odds favor this position as well, I included The Working Trader's idea in the related ideas field since I consider his input valuable. It's good when both technicals and fundamentals agree, just have to be patient for the right setup to pop.
Good luck,
Ivan.

USDJPY: Top spottedSimple setup, initiate a short when the support is breached.
We have a very strong decline after completing what looks like an expanding ending diagonal triangle in the 4h/daily charts.
If price moves below the support level outlined in the chart, it will accelerate down, probably moving 430+ pips to the downside.
As a bonus, crude oil seems to be moving up, while Nikkei falls, effectively boosting this trade, correlation wise.
Will update with my entry and scale ins.
Good luck,
Ivan.

USDJPY Head & ShoulderFundamentals:
- BOJ has not express additional stimulus despite pressure from other central banks
- A weaker USD due to economic data
Technically:
- Yen and Nikkei at 2015 high so pullback is healthy
- 4 hour is showing potential H&S formation
- RSI has rooms to fall
- From the breakout level, Fib of 38.2% is a healthy and viable target
If Head & Shoulder play out this is the target which coincide with the minor support and 38.2% retracement at 122.45 - 122.70 levels.
Entry@ 123.70
Stop@ 124.20 (-50)
Target@ 122.70 (100)
RR of 1:2
After the pullback-usdyen is still a bullish market-consider switch to long
