NIFTY-NSE
Nifty Positional (1-Hour Timeframe) Trading IndicatorPeriod: 04/02/2009 to 20/05/2020.
No. of Points: 33,150.
No. of Trades: 724.
% Profitable: 50.83%.
Profit Factor: 1.759
Points per trades: 45
No. of lots: 2 (1 lot is partially booked after 225 points which can be customized and remaining 1 lot is in trade until the trend is reversed).
Bank Nifty Positional (1-Hour Timeframe) Trading IndicatorPeriod: 06/02/2009 to 21/07/2020.
No. of Points: 83263.
No. of Trades: 579.
% Profitable: 47%.
Profit Factor: 1.723
Points per trades: 143.
No. of lots: 2 (1 lot is partially booked after 750 points which can be customized and remaining 1 lot is in trade until the trend is reversed).
Give me Green my Lord !Well a lord will help when you set your theory practice right. In the above analysis the pink box was support cum resistance which seems to have become a weak resistance point and can be a point of breakout spurt. Do check the volume for confirmation with price action
Follow us on twitter and te l e g r a m
PVR looking brightPlease be take caution investing or speculating in stock markets. Stock trading is a risky business and one should always trade with appropriate stop loss and manage risk accordingly.
This is a quick review of PVR and giving a fair idea of what levels it can testing in short term. Keep a watch!
Hero motocorp : Lets understand in multiple time frameHello Guys,
Let's understand Heromoto cop in bigger and multiple time frame
Monthly time frame: Look bullish toward control price Volume increases, Touches lower value in the monthly chart
Weekly Time Frame
I am seen totally bullish in all time frame toward 2200-2400 level soon.......
I know many of you just seen and leave it bt likes give me more potential to do work hard more and more it only takes second to click on like
Genuine if you like my ideas then please like it, I need your support.
Thanks
ORIENT PAPER : IN MULTI TIME FRAME WHAT NEXT ?Hey, guys welcome back again with some new idea sorry I am stuck in some work so I am not uploading any idea from few days.
I am just finding out some cheap stocks nowadays for holding and gives some good return within a week. orient paper is One of them you can buy around 20-21 for good profit I can expect it to reach 32-35 level within a month or week
Weekly time frame
Thanks
NIFTY Where are we Headed#NIFTY breached 2017 lows and support at 7900 areas, until we get above that we are looking to test 6400 areas and below that the next major support is at 4500.
the 2008 Nifty PE low was about 11.5, that 5000 spot equivalent in current valuations (just studies and LT Reference)
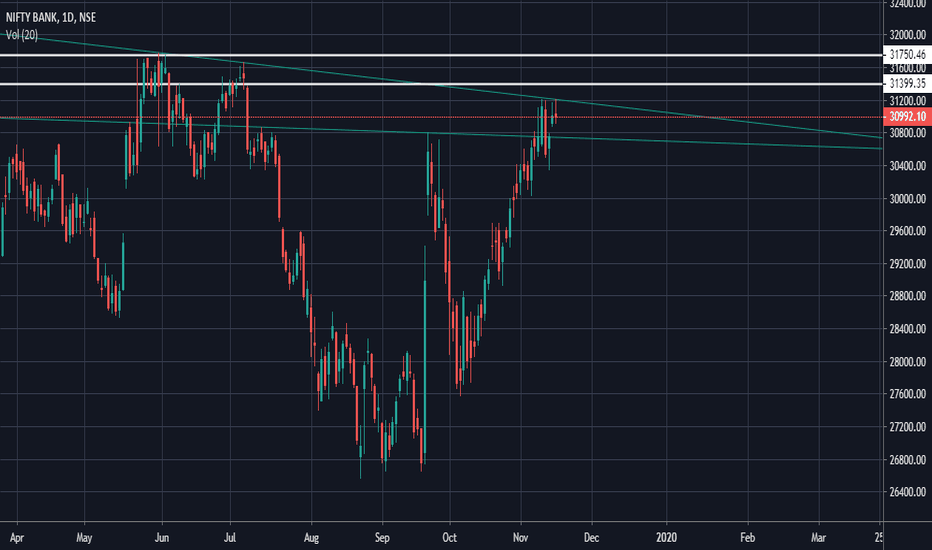
View On NSE:BANKNIFTY- NIFTY BANK NSE:BANKNIFTY- NIFTY BANK After making a good rally till 31205 Index looks like taken a pause. My personal view in NIFTYBANK Index is its going to be trade in range for coming days or even for few weeks before making any move in ether direction. The level of 31205 will act as a good resistance for BN while 30346.9 will act as a support. If BN manage to break above the level of 31205 then may see good uptrend move till 31400-31750. And if NIFTYBANK breaks below the level of 30346 then next stop for BN should be at 29815 and then 29386.
This is my personal view on BANKNIFTY index if you find this useful to you please give it a like and also share.Your like and shares will motivate me to share more and more studies like this.
Indian stock market acting strong...The indian stock market index is at the brink of breaking out massively here, in this currency adjusted chart. If it manages to move over this trendline resistance it can confirm a quarterly timeframe trend pointing to a large advance in the coming 12 quarters, as shown on chart. Emerging market stocks become interesting with potential weakness in the dollar going forward, and rising oil prices. The big slump in energy prices certainly helps equities going forward, with a delated effect, as explained by @timwest in his publications, since transportation and energy are one of the key inputs of the economy.
I'd keep an eye on it and look for good valuation indian companies, if there's a breakout in this chart.
Cheers,
Ivan Labrie.


