My view on nifty 50 is bearish for december 5th expirymy view is on nifty 50 is bearish because it has rejected several times crossing upward at 24350
it might become strong if it crosses 24500 strongly in 1hour time frame othertwise i can see nifty bearish towards 24000.
NIFTY

2 hurdles of Mother, Father line cleared, what next?Two major hurdles of Mother and Father line are cleared by Nifty. Now the major hurdle remaining is the trendline resistance at 24277. If we get a closing above this resistance Nifty can go to 24345. If and when we get a closing above 24345 Nifty will then be ready to fly and next stop can be near 24510 or even 24665. More Bullish levels await after we get a closing above 24665. These levels can be 24890, 25048 and 25277. If the trendline support at 24277 is not crossed for some reason the supports for Nifty to fall back on will be at the zone between 24097 and 24070. (24070 being the mother line of hourly chart and strong support). If 24070 is broken then the next supports will be at 23898, 23756, 23588 and finally 23292. Its looking bullish but two hurdles crossed two more (24277 and 24345) to go.

nifty | 3rd Dec'202415m: Watch for a buy-side liquidity sweep, then await bearish confirmation to short.
Note: The overall 15m trend is bullish, but price is at a strong resistance and supply zone. If above case fails, expect an aggressive sell-side liquidity grab followed by a bullish move.

NIFTY Intraday Trade Setup (02-Dec-2024)NSE:NIFTY
Institutional Framework : Expansion Phase
Institutional Bias : Bullish (Nifty Futures)
Institutional Price Delivery : IRL to ERL (MMXM Buy model)
Institutional Reference Points :
Sell Side Liquidity (MT1)
Inverse FVG(D1)
Bullish Mitigation(H4)
Bullish Breaker (M15)
Sell Side Liquidity(M15)

Review and plan for 3rd December 2024 Nifty future and banknifty future analysis and intraday plan.
This video is for information/education purpose only. you are 100% responsible for any actions you take by reading/viewing this post.
please consult your financial advisor before taking any action.
----Vinaykumar hiremath, CMT

Vijaya Diagnostics: Rukega Nahi SaalaPrice is at ATH. You can tell this in strong bullish trend even at first glance.
Trend is very strong even if you buy at current ATH 1250 and hold, it can be decent swing trade.
Of course price will make a higher swing low. Maybe best range will be around 1070-1085.
Trend direction - Bullish Confirmed.
Trade direction - Bullish confirmed aligned with long term trend.
Entry : 1070-1085.
SL : 1035 (book half here)
Final SL: 1000 (Exit completely)
Target: Current ATH 1250.
Risk Reward: 1:5
If you can just wait for optimal entry, you reduce your SL risk significantly.
These are types of trades where chart actually invites you to enter, should be never avoided. At least enter with 10qty. You never know compounding effect.
This is what I call high quality trade.
- Clear Trend established with no confusion, even in bearish market
- No sign of exhaustion

nifty forecast for 2nd Dec'2024Market may grab sell-side liquidity, create an inducement, target buy-side liquidity, and then turn bearish.

Long Term Nifty Outlook with Macro and Micro Economic commentaryNifty after making a new high is in volatile consolidation and correction mode. FIIs are selling big on every rally and DIIs and Retail are seeing this opportunity to consolidate their position in Indian market. Amidst all the volatility Nifty managed to close the month at 24131.
Every investor is seeking answer to one question which when will FII return to Indian market. There are too answers to this. Simple answer is they will return eventually sooner rather than later.
A more based answer is that when opportunity to earn more return elsewhere will diminish and there will be sort of global stability. Right now Ukraine and Russia conflict has opened another chapter of uncertainties. Stimulus package from China to stabilize its economy is also in an ongoing phase. Iran and Israel conflict is also contributed to environment of global uncertainties. On the other hand Maharashtra Election result has tried or is trying its best to comfort DII and retail investors.
Bond yield in US and surge in crypto post US election and China stimulus has provided a temporary oppenturnity for FIIs to make big money elsewhere. These are the Macro and Micro economic changes which led to FIIs searching better greener pastures elsewhere. Thus when the dust settles a bit and Indian companies again start giving attractive Q on Q results, FIIs will come back.
Results this quarter from India Inc in a traditionally weaker Quarter were a little below par. GDP growth was seen at 5.4% which is again slightly below par which can send Nifty into further consolidation mode. So there will be recovery from here but pointing out the timeline is a tough call even for seasoned economists.
Now coming to the Technical chart, Support and resistance levels. We can not say for sure if the bottom has already been made when earlier this month which was 23263 was the exact bottom or not but it will be an important level going below which we can see free fall in Nifty. So that will be a level to watch. On Daily candlestick chart there is currently a Cup shaped recovery in progress. There are clear trend lines suggesting that top of the channel is somewhere between 28K or 30K in the long run. Base support of the trend line includes 23263 hence that level is of prime importance. Mother line major resistance going forward will be 24367. Father Line major support will be at 23572.
Supports for Nifty remain at: 23890, 23263 to 23230 zone, 22783, 22369, 21845 and 21310.
Resistances for Nifty Remain at: Zone between 24367 to 24570, 25214, 25653 and 26277.
Disclaimer: The above information is provided for educational purpose, analysis and paper trading only. Please don't treat this as a buy or sell recommendation for the stock. We do not guarantee any success in highly volatile market or otherwise. Stock market investment is subject to market risks which include global and regional risks. We will not be responsible for any Profit or loss that may occur due to any financial decision taken based on any data provided in this message.

Paradeep Phosphate : Looking Good with nice rewardThis stock is looking good for attractive risk reward.
Here you can enter at current levels also but if want you can wait for entry at 100 lelvel. But it does not look like it will touch 100 support level. If it does then buy with small SL of Rs.5
What can be better trade when SL is Rs. 5 but first target is Rs.20. That is 1:4 RR.
That is one good trade looking at past stock behaviour.
Entry : Rs. 100 or current levels
SL : Rs. 95
Target 1: Rs. 120

Reverse H&S formation in 15 minute chart of Nifty on cards.Usually we do not look at chart with less than 1 hour candles but an interesting pattern is forming which can yield us a fresh bullish move in Nifty so I am presenting it today. If Nifty manages to stay above 24109 and can close above 24189 we can have a fresh bullish rally in Nifty which can see it pivot very fast as high as 24538. with resistances at 24270, 24348, 24423 and finally 24538.
The important levels will be the support at 24109 and resistance at 24189. Other than 24109 (which is the mother lie for 15 minute chart) important supports will be at 24124, 24063, 24024 (which is father line of 15 minute chart). Below 24024 Nifty will become weak again and Bears can then drag it to 23962 or even 23874 again.
Again the important levels to watch for the next week on resistance side will be 24189 and on support side will be 24109 and 24024 (Mother and Father lines on 15 minute chart). This is what we can read from ultra short term chart of Nifty on 15 minute candle. To know more about the Mother, Father and Small child theory, trend lines, supports and resistances read my book The Happy Candles Way to Wealth creation. In this book you will get to learn about Techno-Funda investment. Many reviewer who have read the book consider it as a hand book of investment. You can check the reviews on Amazon and google Play book. The book is available on amazon in Paperback and kindle version. E-version of the book also available on Google Play books too.
Disclaimer: The above information is provided for educational purpose, analysis and paper trading only. Please don't treat this as a buy or sell recommendation for the stock. We do not guarantee any success in highly volatile market or otherwise. Stock market investment is subject to market risks which include global and regional risks. We will not be responsible for any Profit or loss that may occur due to any financial decision taken based on any data provided in this message.

Optiemus India Soon Will be 1000 Rs!Optiemus India will going to hit 1000 Rs, in this script shwoing bulish momentum in this choppy market, it will so0n going upto 1000 Rs in 1 to 2 month

Nifty Intraday Support & Resistance Levels for 29.11.2024On Thursday, Nifty opened flat, hit a high of 24345.75, and then saw a sharp decline below 24000, making a low of 23873.35 as it tested the 15m demand zone. It closed at 23914.15, losing 360 points from the previous close.
Breaking below the key 24100 support (3-day low) triggered a strong downward move, dragging Nifty over 200 points. Both the Weekly Trend (50 SMA) and Daily Trend (50 SMA) remain sideways, signaling caution.
Demand/Support Zones
Near Demand/Support Zone (15m): 23856.15 - 23940.30 (tested yesterday)
Near Demand/Support Zone (15m): 23661.75 - 23731.25
Far Demand/Support Zone (75m): 23447.15 - 23578.60
Near Support: 23189.88 (61.8% FIBO)
Far Demand/Support Zone (Daily): 22642.60 - 22910.15
Supply/Resistance Zones
Near Supply/Resistance Zone (125m): 24257.65 - 24354.55
Near Supply/Resistance Zone (75m): 24447.65 - 24537.60
Far Supply/Resistance Zone (Daily): 24567.65 - 24978.30 (inside weekly supply)
Far Supply/Resistance Zone (75m): 24636.75 - 24741.45 (inside Daily supply)
Far Supply/Resistance Zone (Weekly): 24567.65 - 25234.05

NIFTYHi guys,
In this chart i Found a Demand Zone in NIFTY CHART for Positional entry,
Observed these Levels based on price action and Demand & Supply.
*Don't Take any trades based on this Picture.
... because this chart is for educational purpose only not for Buy or Sell Recommendation..
Thank you

Resistance zone of Trendline Mother Line on stopping BullsOn the Daily candles chart of Nifty we can clearly see that Mother line and the trend line resistances are acting upon the Nifty and restricting it's further flight. Today we saw creation of another Doji like Monday. The Gap theory probably is also adding pressure on the Nifty. (Gap Theory is a very interesting subject about which we will sometimes do a special video.) Most of the gaps when a stock or index takes a leap should be filled in future as per the theory (in short). There was a gap up on Monday due to Maharashtra election results. In my opinion not all gaps are supposed to be filled there are some substantial gaps which never get filled. However we will do a webinar on this subject in future some day.
Right now the major resistance zone is here for Bulls this zone starts from 24354 and ends at 24396. Nifty might need some consolidation or strong FII+DII buying to fly above this zone. If this zone is conquered further resistances will be at 24530, 24673, 24893 and 25253. Above 25253 there is pure Bull territory.
Supports on the lower side are at 24135 major support (Higher Cradle of The Gap on Monday), 23948 (Lower cradle of the Gap), 23563 Major support from the 200 days EMA or the Father line, 23362 and finally 23254. Below 23254 we have a strong Bear territory.
To know more about stop losses, trailing stop losses, Profit booking and investment, financial awareness in general, process of investment in Equity or Mother, Father and small child theory read my book The Happy Candles Way to wealth creation . Many People who have read it consider it as hand book and perfect guide to equity investment. You can read reviews of the book or purchase the same from Amazon. The book is available on Amazon in Kindle and paperback version. I am sure you are going to find it of massive use. Once you have read the book, I assure you that you will become a next level investor.
Disclaimer: The above information is provided for educational purpose, analysis and paper trading only. Please don't treat this as a buy or sell recommendation for the stock. We do not guarantee any success in highly volatile market or otherwise. Stock market investment is subject to market risks which include global and regional risks. We will not be responsible for any Profit or loss that may occur due to any financial decision taken based on any data provided in this message.

Nifty 28 Nov 2024 zonesBullish zone is above 24330
Bearish zone is below 24220
Note: This is not a buy/sell call. Use stop loss whenever trade.

Review and plan for 27th November 2024Nifty future and banknifty future analysis and intraday plan.
This video is for information/education purpose only. you are 100% responsible for any actions you take by reading/viewing this post.
please consult your financial advisor before taking any action.
----Vinaykumar hiremath, CMT

Father Line not allowing Nifty but gap up support holding.Father line of 200 Hours EMA at 24212 has not yet allowed Nifty to fly freely up and above. today again like yesterday we got a closing below at 24194. Overall it was a flat day with positive movements mainly in IT, FMCG, media and Small Cap index.
Once we get a closing above 24212 the next resistance will be at 24360, 24530, 24673 and 24893. After closing above 24893 Nifty has a chance to be in proper Bullish grip. Supports for Nifty on the lower side remain at 24135, 23948 and 23912 (Major Mother line Support of 50 Hours EMA). Below 23912 bears can drag Nifty to 23616, 23362 and finally 23250. Below 23250 Nifty can have a free fall into strong bearish territory.
Disclaimer: The above information is provided for educational purpose, analysis and paper trading only. Please don't treat this as a buy or sell recommendation for the stock. We do not guarantee any success in highly volatile market or otherwise. Stock market investment is subject to market risks which include global and regional risks. We will not be responsible for any Profit or loss that may occur due to any financial decision taken based on any data provided in this message.

Adanien 27 Nov 2024 Bullish zone is above 2192
Bearish zone is below 2110
Note: This is not a buy/sell call. Use stop loss whenever trade.

Massive Gap-up on expected lines, Which way will Nifty go now?After Maharashtra results as expected Nifty gave a gap up opening and sustained above an important level to close the day but can the rally sustain or will it fizzle out. If Nifty can consolidate in the range and cross the important resistance of 24360 while holding the ground above 200 hours EMA of Father line at 24213 we can see a really very bullish rally in Nifty.
The supports for Nifty remain at 24213, 24135, 23948 and finally 23821. Below 23821 which is the 50 Hours EMA or the Mother line the rally may Fizzle out and bears will again dominate the scene. Resistnace for Nifty remain at 24369 important trend line resistance, 24530, 24673 and 24893 before we gain 25K levels and we can move ahead. Above 25K we will be in a predominantly Bullish territory again.
To know more about Mother and Father lines, trend lines and supports and resistances mentioned in the message and to find them on your own in addition to knowing more about Techno-Funda investing in a nutshell you can read my book The Happy Candles way to Wealth creation available on Kindle and Google Playbook in E-version and on Paperback edition on Amazon. It is one of the highest rated books in that category.
Disclaimer: The above information is provided for educational purpose, analysis and paper trading only. Please don't treat this as a buy or sell recommendation for the stock. We do not guarantee any success in highly volatile market or otherwise. Stock market investment is subject to market risks which include global and regional risks. We will not be responsible for any Profit or loss that may occur due to any financial decision taken based on any data provided in this message.

Plan for 26th November 2024Nifty future and banknifty future analysis and intraday plan.
This video is for information/education purpose only. you are 100% responsible for any actions you take by reading/viewing this post.
please consult your financial advisor before taking any action.
----Vinaykumar hiremath, CMT

Nifty Short, Medium & Long Term : 25-Nov-24 to 29-Nov-24Nifty Short, Medium & Long Term : 25-Nov-24 to 29-Nov-24
Nifty closed at 23907 (two weeks before 24141) and touched high & low of 24233-23265
RSI ,Macd and stochastics levels are still down at the bottom.
Market bounced back from Trendline Support around 23250 and bounced back. But FII might continue to sell, hence please apply caution and let market move above the Ist & IInd short term target to buy in bulk. However, small SIP type buy in stocks/ MFs always better at this critica time.
FIIs was continuously selling in Indian market due to valuation issues of Indian Stocks, rather FIIs invested in Bitcoin which lead to Extraordinary increase in Bitcoin vallue and nearing 100,000 $ post US Election. Maharashtra election results gave confidence to current govt and will ease the pressure with current govt and can take free decisions in upcoming budget.
US indictment of Adani in bribe crime is a very bad issue and definitely it affects Adani Stocks and allied stocks. Example ITD Cementation is a great valued stock, but fell down drastically, as Adani was about to buy this company as per the news. Hence, avoid adani related stocks at present, as SEBI also might take action ( show cause notice/ Audit) on adani stocks.
Slowly started adding the stocks and Mutual Funds during this downfall, will continue to buy if there is further fall. Use the opportunity and grab the good value stocks.
Kindly read the Bitcoin Blog which i have written in Sep & Oct 24 with clear Indications to Buy with target of atleast 77000.
Caution was emphasized on Nifty for last 4 months as nifty PE ( Currently 22) was in high level with high valuation especially in Mid cap & Small Cap. PE touched 21.5 and bounced back.
Mutual Funds SIP shall be invested as the goal is for more than 5-10 years at this critical period , further market correction can happen upto nifty index to 22800 from current level, Individual value stock picking is a key at this critical time.
Fundamentally good stocks to be invested at these times. My Stock analysis of diwali recommendation from major financial agencies/ analyst and also some of the stock which is good as per my analysis will be provided upon request. DM : karthik_ss ( Twitter) . Individual need to analyse on their own. Further additional fundamental good value stocks ( which i analysed ) are added now after this downfall. Please note these are all not stock recommendation, rather an analysis. Individual Can analyse and add to your portfolio based on your risk profile.
Nifty 23907 Short term ( Short Term : Neutral)
Nifty short term resistance Market to firmly cross 24500, 24767(0.5 Fib resistance) and 25122 ( 0.618 Fib resistance) to move ahead to 26000.
Support at 23266 ( Last week Low), 23000 & 22800.
Medium Term next target is 25335( Shoulder Pattern), if move up decisively above next target 26268 ( all time high), 26968
Medium term Support 22248.
Long Term : Nifty have a target of 27740, 28000 & 28190 ( Fibonacci Resistance).
Support at 21240

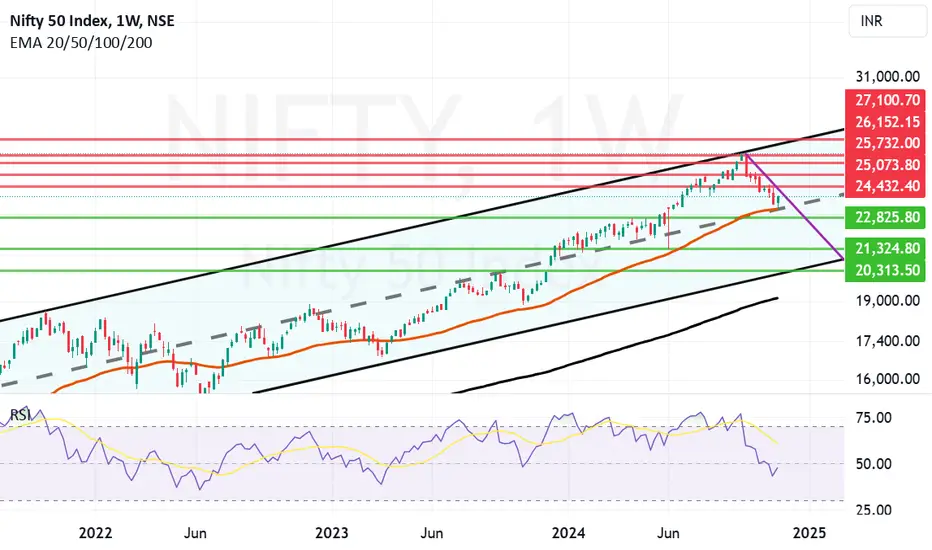
Nifty might be turning corners if there is no further bad news.The medium term outlook of Nifty is that it might be turning corners if there is no further bad news on Global or Local front. RSI is also turning in the positive or bullish zone. 23251 which was the 50 Weeks EMA or the mother line was almost taken and Nifty took a support at exactly mid channel support. This level be the key going forward. In the monthly closing or thereafter if this support is broken then we might see a bear attack once again. In such a scenario next supports will be at 22825. If this support is broken the next supports will be at 21324, 20313 or even 19133 in case of a global catastrophe of some unexpected even from Ukraine / Russia / Iran / Israel front. As of now 23251 seems to be the bottom. The medium term resistances on the upper side remain at 24432, 25073, 25732 and 26152 before Nifty gains previous highs. Nifty channel top currently seems at 27100 levels. There will be a lot of consolidation and it will take a long time before we reach there (2 to 6 or more months). Difficult to predict exact time frame due to lot of uncertainties on the local and global front.
Nifty chart explains Mother-Father & Small Child theory and RSICurrent Nifty daily chart explains Mother-Father & Small Child theory and RSI very well have a look. As we can see and explained in my previous articles in Smart Investment as well as my book, The Happy Candles Way to wealth creation available on Amazon in Paperback and kindle version. The book in E-version is also available on Google Play books. Every time and again Nifty for cooling down from the overbought zone, consolidation, finding support and finding bottom in case of a bear market looks towards taking blessing or ashirwad from mother regularly and father some times. Wherein we call 50 EMA the Mother, 200 EMA of the father and movement of the candle sticks as movement of a 3 year old kid who is moving in a garden. The theory has been explained in depth in my previous articles and books but what you read above is in a nutshell.
This time as there were serious issues related to FIIs selling continuously, issues regarding inflation, consumption and domestic demand being weak we saw a steep correction in Nifty from its high. The global issues like escalating Iran Vs Israel tensions, US elections, Ukraine Vs Russia war again gaining momentum also played a spoilsport for bulls along with new episode of Adani saga. The correction might not be over we do not know for sure where the exact top and exact bottoms are but we can predict zones that can provide resistance and supports accurately.
Mother and Father lines we consider major supports and well as major resistances. They are major and most important supports if price of the particular stock or index is above the lines and they will be major resistance if the price of the stock is below them. On Friday we got a strong closing above the 200 days EMA which means if we get a follow up bullish candle on Monday and index continues to sustain above 200 days EMA things can go North in favour of Bulls. If Bulls can manage to get a closing above 50 days EMA or mother line the rally can enter a very strong zone. Another noteworthy point is that Nifty also hit a near channel bottom support as well as RSI also hit an oversold zone.
Thus getting a positive closing to next week and further extending the closing above Mother line will be very important going forward. Supports for Nifty remain at 23542(Strong Father line Support), 23259, 22801 and 22139. Resistances on the upper side are 23965, 24259, 24417 (Strong Mother line resistance) and 24909 before we again reach 25K+ levels.
Disclaimer: The above information is provided for educational purpose, analysis and paper trading only. Please don't treat this as a buy or sell recommendation for the stock. We do not guarantee any success in highly volatile market or otherwise. Stock market investment is subject to market risks which include global and regional risks. We will not be responsible for any Profit or loss that may occur due to any financial decision taken based on any data provided in this message.
