Nifty took support at the Mother line and trying to recoverNifty has taken support at the Mother line today and tried to post a recovery. Again proving our Mother, Father and small Child theory correct. To know more about the Mother father and small Child theory of stock market. Read my book THE HAPPY CANDLES WAY TO WEALTH CREATION. Nifty during the day made a low of 25378 and closed the day at 25453. It is not a strong recovery nevertheless the recover of 75 points recovery which makes shadow of the candle neutral to positive. Let us see if Nifty can recovery fully tomorrow or Friday to close the week in positive.
Nifty Supports remain at: 25396 (Mother Line Support which is also near the trend line support at 25378), there there is a support at 25245 and finally mid channel support near 25177. Closing below 25177 will make the Bears more powerful and they can drag the index further down towards Father line support near 25108.
Nifty Resistances remain at: 25470, 25528 (Trend line resistance), 25603 and finally 25679. 25759 seems to be the channel top currently in the hourly parallel channel.
Disclaimer: The above information is provided for educational purpose, analysis and paper trading only. Please don't treat this as a buy or sell recommendation for the stock or index. The Techno-Funda analysis is based on data that is more than 3 months old. Supports and Resistances are determined by historic past peaks and Valley in the chart. Many other indicators and patterns like EMA, RSI, MACD, Volumes, Fibonacci, parallel channel etc. use historic data which is 3 months or older cyclical points. There is no guarantee they will work in future as markets are highly volatile and swings in prices are also due to macro and micro factors based on actions taken by the company as well as region and global events. Equity investment is subject to risks. I or my clients or family members might have positions in the stocks that we mention in our educational posts. We will not be responsible for any Profit or loss that may occur due to any financial decision taken based on any data provided in this message. Do consult your investment advisor before taking any financial decisions. Stop losses should be an important part of any investment in equity.
NIFTY

Review and plan for 2nd July 2025 Nifty future and banknifty future analysis and intraday plan.
Swing idea.
This video is for information/education purpose only. you are 100% responsible for any actions you take by reading/viewing this post.
please consult your financial advisor before taking any action.
----Vinaykumar hiremath, CMT

Review and plan for 1st July 2025Nifty future and banknifty future analysis and intraday plan.
swing idea - trent
This video is for information/education purpose only. you are 100% responsible for any actions you take by reading/viewing this post.
please consult your financial advisor before taking any action.
----Vinaykumar hiremath, CMT

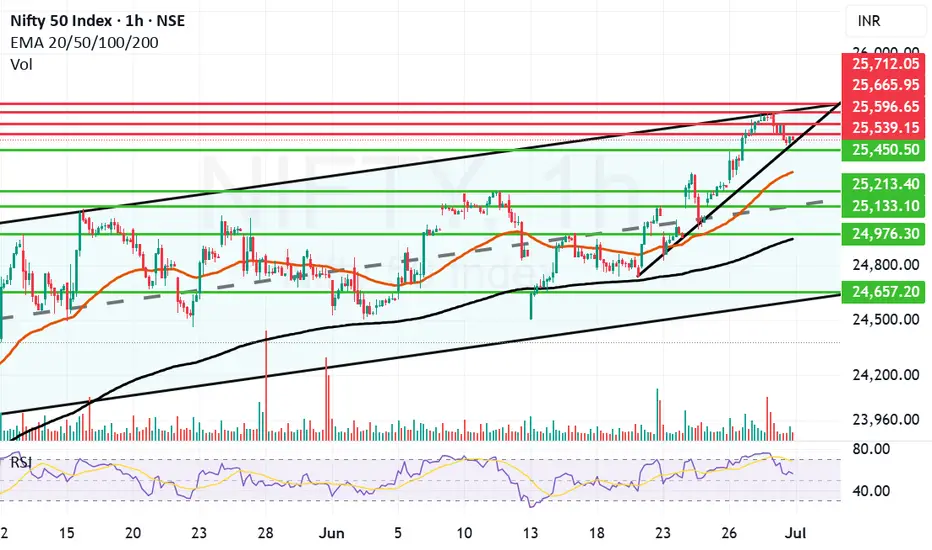
Nifty goes into consolidation mode to end the month at 25500.Today Nifty went into consolidation mode searching for the supports nearby after a massive upward run in the last week. Even though we saw Nift climbing down 120 points today the closing above 25500 is a good sign. It was a volatile day where Nifty made a high of 25669 and a low of 25473 moving 200 points down. But recovered a bit to close at 25517.
The Supports for Nifty remain at: 25450, 25321 (Mother line Support), 25133 (Mid-channel support). If that is broken the Nifty may fall further towards 24976 or 24956 (Which is the Father line support). Channel bottom seems to be at 24657. If we get a closing below this zone we will comment about further supports on the down side.
The Resistance for Nifty remain at: 24539, 24596, 25665 and finally 25712. (25712 seems to be the channel and trend top. Once Nifty closes above this zone we will be able to comment about further levels on the upside.
Disclaimer: The above information is provided for educational purpose, analysis and paper trading only. Please don't treat this as a buy or sell recommendation for the stock or index. The Techno-Funda analysis is based on data that is more than 3 months old. Supports and Resistances are determined by historic past peaks and Valley in the chart. Many other indicators and patterns like EMA, RSI, MACD, Volumes, Fibonacci, parallel channel etc. use historic data which is 3 months or older cyclical points. There is no guarantee they will work in future as markets are highly volatile and swings in prices are also due to macro and micro factors based on actions taken by the company as well as region and global events. Equity investment is subject to risks. I or my clients or family members might have positions in the stocks that we mention in our educational posts. We will not be responsible for any Profit or loss that may occur due to any financial decision taken based on any data provided in this message. Do consult your investment advisor before taking any financial decisions. Stop losses should be an important part of any investment in equity.
Review and plan for 30th June 2025Nifty future and banknifty future analysis and intraday plan.
Swing ideas.
This video is for information/education purpose only. you are 100% responsible for any actions you take by reading/viewing this post.
please consult your financial advisor before taking any action.
----Vinaykumar hiremath, CMT

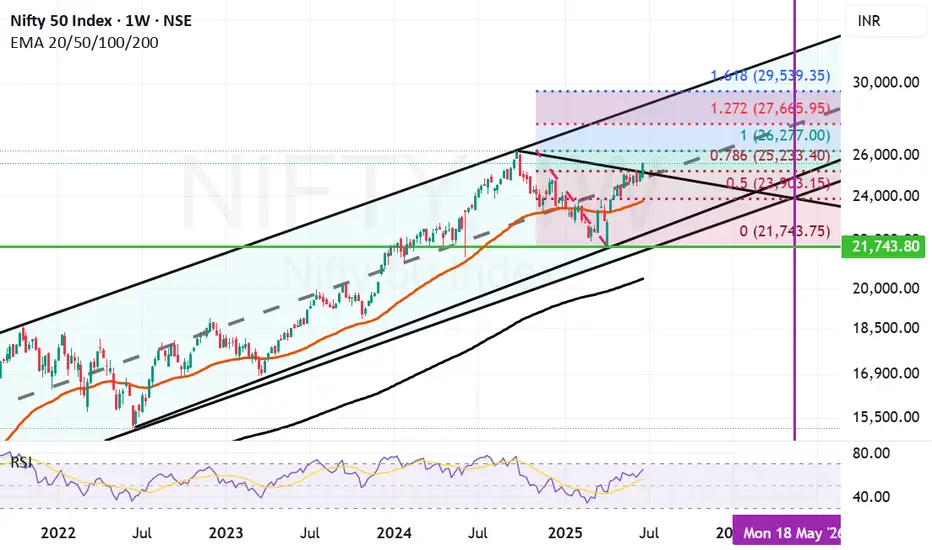
Medium to long term targets for Nifty. We have used parallel channel and Fibonacci retracement on Nifty weekly chart to gauge medium to long term targets for Nifty.
The Fibonacci retracement points out that the support for Nifty will remain at 25233(Fibonacci Support and mid channel support), 23903 (Important Fibonacci support), 23774 (Important Mother line support or 50 weeks EMA, channel bottom support). Nifty can go below these levels only in situation of another major global event or some major local event. If we get a closing below 23774 the Bear will be in commanding situation and will have the power to take Nifty further down towards 21743 which was the recent low we reached during Indo-Pak conflict.
The resistances for Nifty now are at 26277 (Major Resistance, Previous All Time high of Nifty), The next leap of faith for Nifty can be towards 27665 after we get a closing above 26277. (This will be a major hurdle and in next 1 year or so it is highly unlikely that we will cross this level unless we hit a euphoria zone.) This zone is also the current channel top zone. In very unlikely circumstance of Nifty crossing 27665 the next target for Nifty will be at 29539. (This looks possible in 18 to 24 months). We will be very lucky to reach this zone earlier. You never say never in the market.
As of now the local factors remain optimistic but there is a concern by experts related to valuation of market. As the Nifty PE currently is around 23. The results in the next couple of quarters will determine if Bull market stays active.
Disclaimer: The above information is provided for educational purpose, analysis and paper trading only. Please don't treat this as a buy or sell recommendation for the stock or index. The Techno-Funda analysis is based on data that is more than 3 months old. Supports and Resistances are determined by historic past peaks and Valley in the chart. Many other indicators and patterns like EMA, RSI, MACD, Volumes, Fibonacci, parallel channel etc. use historic data which is 3 months or older cyclical points. There is no guarantee they will work in future as markets are highly volatile and swings in prices are also due to macro and micro factors based on actions taken by the company as well as region and global events. Equity investment is subject to risks. I or my clients or family members might have positions in the stocks that we mention in our educational posts. We will not be responsible for any Profit or loss that may occur due to any financial decision taken based on any data provided in this message. Do consult your investment advisor before taking any financial decisions. Stop losses should be an important part of any investment in equity.
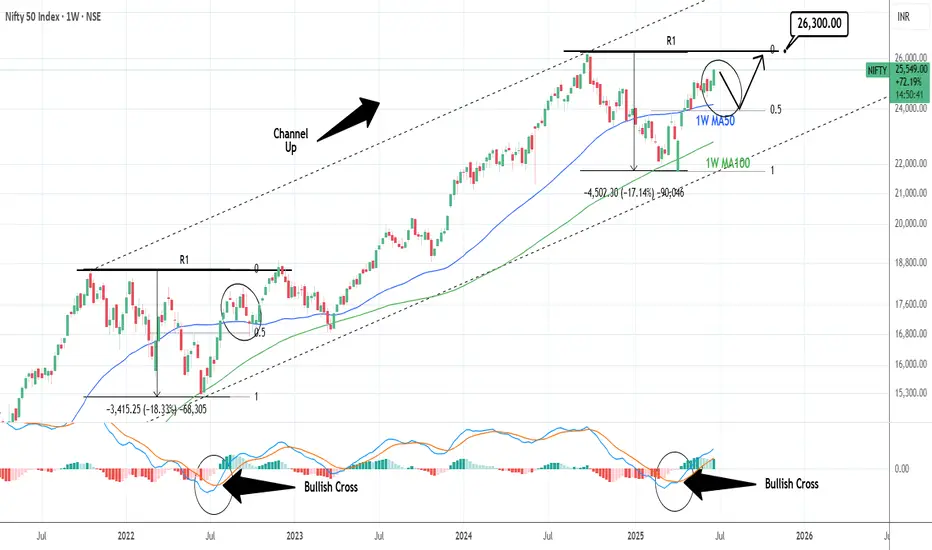
NIFTY: One more opportunity to buy lower.Nifty is on excellent bullish levels on its 1D technical outlook (RSI = 66.330, MACD = 172.380, ADX = 16.480), extending the bullish wave of the 4 year Channel Up. Being close to the R1 already, a pullback to the 0.5 Fib and the 1W MA50 isn't unlikely, as it is what happened in September 2022. That will be our final opportunity to buy low and target the R1 level (TP = 26,300).
## If you like our free content follow our profile to get more daily ideas. ##
## Comments and likes are greatly appreciated. ##
Review and plan for 27th June 2025Nifty future and banknifty future analysis and intraday plan.
Swing trade.
This video is for information/education purpose only. you are 100% responsible for any actions you take by reading/viewing this post.
please consult your financial advisor before taking any action.
----Vinaykumar hiremath, CMT

Major Breakout in Nifty now holding the levels key. We saw a major Breakout in Nifty today. Finally Nifty closed above much coveted levels of 25251. Nifty made a high of 25565 and closed at 25549 which was a remarkable comeback. What we are seeing on chart is a cup formation happening in Nifty. For flying further Nifty needs to have a strong closing tomorrow and stronger monthly closing on Monday that is 30th June. These 2 closings will be very important. We need a Nifty closing above 25884. Even if that does not happen a monthly closing above 25251 will also be considered a strong closing. Nifty is strongly on the path of recovery for sure and supports and resistances for Nifty remain as under:
Nifty Supports Remain At: 25251, 24994, 24760 and 24588 (Mother line). If by chance under unlikely circumstances Mother line is broken then Bears will become more empowered and might try to pull Nifty towards 24209 or even 23892 (Father line support).
Nifty Resistances Remain At: 25565, 25740, 25884, 26066 and finally previous All time high resistance of 26277.
Disclaimer: The above information is provided for educational purpose, analysis and paper trading only. Please don't treat this as a buy or sell recommendation for the stock or index. The Techno-Funda analysis is based on data that is more than 3 months old. Supports and Resistances are determined by historic past peaks and Valley in the chart. Many other indicators and patterns like EMA, RSI, MACD, Volumes, Fibonacci, parallel channel etc. use historic data which is 3 months or older cyclical points. There is no guarantee they will work in future as markets are highly volatile and swings in prices are also due to macro and micro factors based on actions taken by the company as well as region and global events. Equity investment is subject to risks. I or my clients or family members might have positions in the stocks that we mention in our educational posts. We will not be responsible for any Profit or loss that may occur due to any financial decision taken based on any data provided in this message. Do consult your investment advisor before taking any financial decisions. Stop losses should be an important part of any investment in equity.

Review and plan for 26th June 2025Nifty future and banknifty future analysis and intraday plan.
This video is for information/education purpose only. you are 100% responsible for any actions you take by reading/viewing this post.
please consult your financial advisor before taking any action.
----Vinaykumar hiremath, CMT

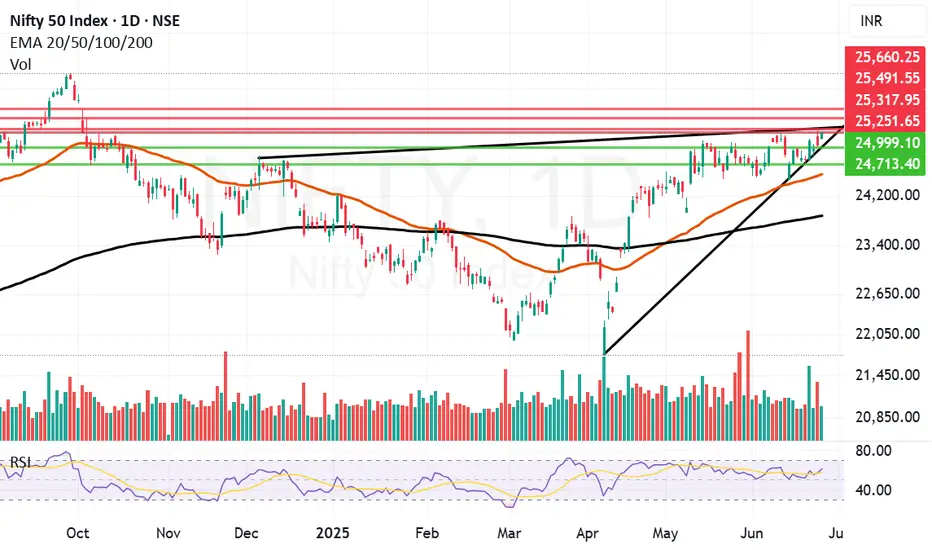
Final hurdle remains to be crossed before Nifty can fly further.One important final hurdle of 25251 remain just in front of Nifty before it can fly further. I can it a final hurdle because it is an important trendline resistance. Last 2 days Nifty has tried to climb above it but we did not get a closing above it yesterday and today as well. Today Nifty made a high of 24266 but closed at 25244. It could not hold on to the ground above 25251. The level is challenging but positive momentum built from today's display might allow it to close above the same. Only time will tell. Closing of this week will be very important.
Nifty resistances remain at: 25251, Closing above 25251 will empower Bulls to pull Nifty further upwards towards 25317, 25491 and 25660.
Nifty supports remain at: 24999, 24713, 24749 (Mother Line Support), 23875 (Father line support). (Closing below Father line support can bring Bears back into the game).
Disclaimer: The above information is provided for educational purpose, analysis and paper trading only. Please don't treat this as a buy or sell recommendation for the stock or index. The Techno-Funda analysis is based on data that is more than 3 months old. Supports and Resistances are determined by historic past peaks and Valley in the chart. Many other indicators and patterns like EMA, RSI, MACD, Volumes, Fibonacci, parallel channel etc. use historic data which is 3 months or older cyclical points. There is no guarantee they will work in future as markets are highly volatile and swings in prices are also due to macro and micro factors based on actions taken by the company as well as region and global events. Equity investment is subject to risks. I or my clients or family members might have positions in the stocks that we mention in our educational posts. We will not be responsible for any Profit or loss that may occur due to any financial decision taken based on any data provided in this message. Do consult your investment advisor before taking any financial decisions. Stop losses should be an important part of any investment in equity.
Review and plan for 25th June 2025Nifty future and banknifty future analysis and intraday plan.
This video is for information/education purpose only. you are 100% responsible for any actions you take by reading/viewing this post.
please consult your financial advisor before taking any action.
----Vinaykumar hiremath, CMT

Nifty lost gains but it is a positive sign to close above 25KNifty in the Euphoria of ceasefire between Iran and Israel gained a lot of ground early in the day and made a high of 25317 but could not sustain the levels and lost massive 273 points due to profit booking to close the day at 25044. Although the loss was big but the silver lining is Nifty still ended the day 72 points in the green and closed above 25K levels. As there were news and claims related to ceasefire violations from both sides a lot of investors and participants were apprehensive of carrying long positions forward. If the things remain positive over night and if important resistance levels of 25116 and 25251 are crossed we might yet again see positive momentum building.
Nifty Resistances remain at: 25116, 25251, 25317. Closing above 25317 will lead to further upside towards the next resistance levels of 25491 and 25660.
Nifty Supports remain at: 25499 (Trend line support), 24713, 24521 (Mother Line Support) and 24463. closing below 24463 can had over the gains to the Bears who can drag index down towards Father line support of 23861.
Disclaimer: The above information is provided for educational purpose, analysis and paper trading only. Please don't treat this as a buy or sell recommendation for the stock or index. The Techno-Funda analysis is based on data that is more than 3 months old. Supports and Resistances are determined by historic past peaks and Valley in the chart. Many other indicators and patterns like EMA, RSI, MACD, Volumes, Fibonacci, parallel channel etc. use historic data which is 3 months or older cyclical points. There is no guarantee they will work in future as markets are highly volatile and swings in prices are also due to macro and micro factors based on actions taken by the company as well as region and global events. Equity investment is subject to risks. I or my clients or family members might have positions in the stocks that we mention in our educational posts. We will not be responsible for any Profit or loss that may occur due to any financial decision taken based on any data provided in this message. Do consult your investment advisor before taking any financial decisions. Stop losses should be an important part of any investment in equity.

Review and plan for 24th June 2025Nifty future and banknifty future analysis and intraday plan.
This video is for information/education purpose only. you are 100% responsible for any actions you take by reading/viewing this post.
please consult your financial advisor before taking any action.
----Vinaykumar hiremath, CMT

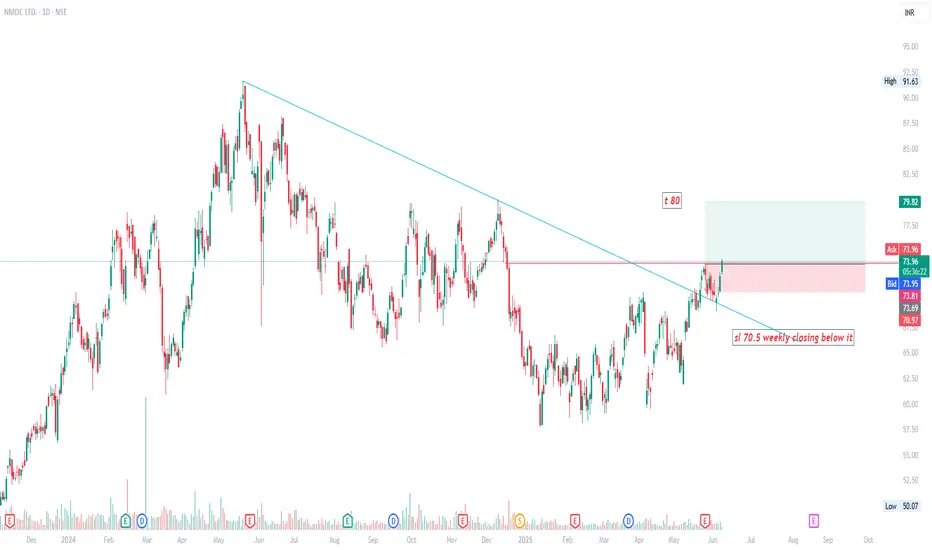
NMDC LONG NMDC CMP 74 T-80 SL 71.5 Weekly closing below it
personal bias as i hold it. not a trading call just a educational idea.
Review and plan for 24th June 2025Nifty future and banknifty future analysis and intraday plan.
This video is for information/education purpose only. you are 100% responsible for any actions you take by reading/viewing this post.
please consult your financial advisor before taking any action.
----Vinaykumar hiremath, CMT

Great recovery by Nifty to end the week. Nifty has shown a great recovery to end the week at 25112 despite persisting global uncertainties. This again shows imminent strength of Indian markets and confidence on the local factors by Bulls.
Nifty however is now entering a tough resistance zone which starts exactly from 25113 and extends till 25251. Once we get a closing above 25251 the Bulls will try to control the market with more strength. Till that happens it can still go in any direction. The supports for Nifty remain at 24869, 24713, 24480 (Mother line support), 24175 and finally 23838 (Father line support).
If any major further global escalation happens during the weekend and we get a closing below 23838 then Bears can become more powerful and they might have potential to push market further down towards 23047 or below.
Things hang in balance despite a strong closing on Friday as the shadow of the candle is still neutral.
Disclaimer: The above information is provided for educational purpose, analysis and paper trading only. Please don't treat this as a buy or sell recommendation for the stock or index. The Techno-Funda analysis is based on data that is more than 3 months old. Supports and Resistances are determined by historic past peaks and Valley in the chart. Many other indicators and patterns like EMA, RSI, MACD, Volumes, Fibonacci, parallel channel etc. use historic data which is 3 months or older cyclical points. There is no guarantee they will work in future as markets are highly volatile and swings in prices are also due to macro and micro factors based on actions taken by the company as well as region and global events. Equity investment is subject to risks. I or my clients or family members might have positions in the stocks that we mention in our educational posts. We will not be responsible for any Profit or loss that may occur due to any financial decision taken based on any data provided in this message. Do consult your investment advisor before taking any financial decisions. Stop losses should be an important part of any investment in equity.

Review and plan for 20th June 2025Nifty future and banknifty future analysis and intraday plan.
This video is for information/education purpose only. you are 100% responsible for any actions you take by reading/viewing this post.
please consult your financial advisor before taking any action.
----Vinaykumar hiremath, CMT

HDFCBANK - For my Indian Viewers!So an Indian Viewer has asked for this, so looking onto it, the heavyweight of sector NIFTY would see a move as stated!

Review and plan for 18th June 2025 Nifty future and banknifty future analysis and intraday plan.
This video is for information/education purpose only. you are 100% responsible for any actions you take by reading/viewing this post.
please consult your financial advisor before taking any action.
----Vinaykumar hiremath, CMT

Resistance zones and Geo-political instability acting up.Geo-Political instability and resistance zone are acting up together to stop Nifty and not allowing it to close above 25K. As the world is looking at developments in Iran Vs Israel conflict with beated heart market today gave up some gains from yesterday. The only index looking strong is IT index right now. Avoid taking very long positions unless you are very sure of the company. Yesterday also Nifty failed to close above 25K opened briefly near 25K today and then moved downwards. Lot will be decided in the short term by the developments that happen tonight. Important G7 meet and US Federal reserve Rate Cut meet is also to happen later in the week. These 2 global factors will decide fate of the market in the short term. Local factors are all in line and nothing to worry for Indian markets on that front.
The supports for Nifty remain at: 24713 (Trend line support), 24425 (Mother line support of Daily chart), next support is near 23917, 23806 (Father line support of daily chart is in place). Closing below 23906 can lead to further down side and in such a scenario Nifty can fall further towards 23500 or 23047 levels. If we get a closing below that we will give updates regarding the same.
Resistances for Nifty remain at: 24982 (Today's high), 25112 and trend line resistance of 25251. When we get a closing above 25251 we will update you regarding the further upward resistnace levels.
Disclaimer: The above information is provided for educational purpose, analysis and paper trading only. Please don't treat this as a buy or sell recommendation for the stock or index. The Techno-Funda analysis is based on data that is more than 3 months old. Supports and Resistances are determined by historic past peaks and Valley in the chart. Many other indicators and patterns like EMA, RSI, MACD, Volumes, Fibonacci, parallel channel etc. use historic data which is 3 months or older cyclical points. There is no guarantee they will work in future as markets are highly volatile and swings in prices are also due to macro and micro factors based on actions taken by the company as well as region and global events. Equity investment is subject to risks. I or my clients or family members might have positions in the stocks that we mention in our educational posts. We will not be responsible for any Profit or loss that may occur due to any financial decision taken based on any data provided in this message. Do consult your investment advisor before taking any financial decisions. Stop losses should be an important part of any investment in equity.

Review and plan for 17th June 2025 Nifty future and banknifty future analysis and intraday plan.
Swing trading ideas.
This video is for information/education purpose only. you are 100% responsible for any actions you take by reading/viewing this post.
please consult your financial advisor before taking any action.
----Vinaykumar hiremath, CMT

Solid V Shaped recovery within the Parallel channel for NiftyNifty recovered sharply within the parallel channel. The reasons that can be attributed are inherent strength in the Indian market and swift recovery in IT, Infra, Metal, commodities, Realty, Mid and Small cap browsers. The closing of Nifty was at 24946 which is just above the mother line which is at 24908. The same mother line provided the support to Nifty in the last few hours of trade when there was some intraday profit booking pressure.
Nifty Supports remain at: 24908 (Mother line Support), 24836, 24690 (Father Line Support), 24555 (Channel Bottom Support) and 24480 recent low. Below 24880 Nifty will be very weak and Bears in that scenario can drag Nifty further down to 24195 or 23957. These are the levels as of now. If we go below these levels in unlikely circumstances we will update the levels once we get there.
Nifty Resistances remain at: 24973, 25106 (Mid Channel Resistance) and 25231.Once we close above 25231 we will update further levels.
Disclaimer: The above information is provided for educational purpose, analysis and paper trading only. Please don't treat this as a buy or sell recommendation for the stock or index. The Techno-Funda analysis is based on data that is more than 3 months old. Supports and Resistances are determined by historic past peaks and Valley in the chart. Many other indicators and patterns like EMA, RSI, MACD, Volumes, Fibonacci, parallel channel etc. use historic data which is 3 months or older cyclical points. There is no guarantee they will work in future as markets are highly volatile and swings in prices are also due to macro and micro factors based on actions taken by the company as well as region and global events. Equity investment is subject to risks. I or my clients or family members might have positions in the stocks that we mention in our educational posts. We will not be responsible for any Profit or loss that may occur due to any financial decision taken based on any data provided in this message. Do consult your investment advisor before taking any financial decisions. Stop losses should be an important part of any investment in equity.
