Review and plan for 20th May 2025 Nifty future and banknifty future analysis and intraday plan.
Quarterly results.
This video is for information/education purpose only. you are 100% responsible for any actions you take by reading/viewing this post.
please consult your financial advisor before taking any action.
----Vinaykumar hiremath, CMT
NIFTY

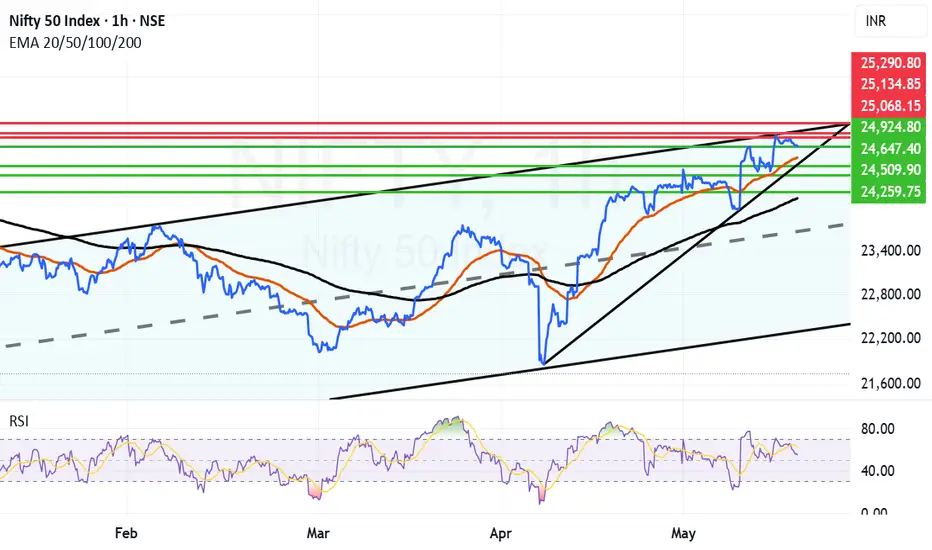
Nifty Still near the top of Parallel Channel. Nifty is consolidating near the top of the parallel channel and searching for momentum for getting a clear breakout. Till it regains the momentum and Mojo the upside looks limited. The current resistances it is facing is near 25068. Once we get a closing above the same there is possibility of some upside. In case we get a closing above 25068 the next resistances will be near 25134 and 25290. 25290 is the point above which we have a clear channel top Breakout. We will wait for that to happen for giving further resistances. The supports for Nifty are currently near 24924, 24761 (Mother Line Support of Hourly chart). If we get a closing below 24761 the bears will come back into the game and can drag the Nifty further towards the levels of 24647, 24509, 24259 or even 24162. 24162 is a Father line support of hourly chart. A closing below this levels can bring Bears in a total action mode. We will comment about further supports if by chance we get a closing below this level.
Disclaimer: The above information is provided for educational purpose, analysis and paper trading only. Please don't treat this as a buy or sell recommendation for the stock or index. The Techno-Funda analysis is based on data that is more than 3 months old. Supports and Resistances are determined by historic past peaks and Valley in the chart. Many other indicators and patterns like EMA, RSI, MACD, Volumes, Fibonacci, parallel channel etc. use historic data which is 3 months or older cyclical points. There is no guarantee they will work in future as markets are highly volatile and swings in prices are also due to macro and micro factors based on actions taken by the company as well as region and global events. Equity investment is subject to risks. I or my clients or family members might have positions in the stocks that we mention in our educational posts. We will not be responsible for any Profit or loss that may occur due to any financial decision taken based on any data provided in this message. Do consult your investment advisor before taking any financial decisions. Stop losses should be an important part of any investment in equity.
Review and plan for 19th May 2025Nifty future and banknifty future analysis and intraday plan.
Quarterly results.
This video is for information/education purpose only. you are 100% responsible for any actions you take by reading/viewing this post.
please consult your financial advisor before taking any action.
----Vinaykumar hiremath, CMT

Maruti Suzuki Chart Breakout Watch | Ascending Triangle PatternNSE:MARUTI
Maruti Suzuki is currently forming a bullish ascending triangle pattern on the 1-hour chart, indicating potential for an upside breakout.
1. Pattern Formation: The price is making higher lows while facing horizontal resistance near the 12,700 zone — forming a classic ascending triangle.
2. Support Zone: Trendline support is holding well, currently near 12,550.
3. Breakout Levels: A confirmed breakout above 12,700 could trigger a sharp move toward the next resistances at 12,888, 13,075, and possibly 13,454.
4. Bullish: Post-breakout, price action is expected to retest and then rally — as shown by the projection arrows on the chart.
5. Volume Confirmation : Watch for volume expansion on breakout to confirm strength.
Trading Plan:
Buy on Breakout : Enter long above 12,700 with targets of 12,888 - 13,075 - 13,454. Use SL below 12,550.
Wait-and-Watch : If price fails to break out, stock may stay range-bound or retest trendline support.
Conclusion:
Price action suggests strength building up. A breakout from this pattern could lead to a fresh rally — ideal setup for short-term swing trades

Review and plan for 16th May 2025 Nifty future and banknifty future analysis and intraday plan.
Quarterly results.
This video is for information/education purpose only. you are 100% responsible for any actions you take by reading/viewing this post.
please consult your financial advisor before taking any action.
----Vinaykumar hiremath, CMT

NIFTY Resumes Its Bullish TrendHello traders! Today we will talk about an Indian stock market exchange NIFTY 50, as we see nice and clean pattern from technical and Elliott wave perspective.
As you can see, NIFTY is in an impulsive bullish rise on the weekly basis, which looks like a higher degree wave 3 of an ongoing five-wave bullish impulse by Elliott wave theory.
After recent corrective slowdown in subwave (4), which perfectly tested channel support line and 38,2% Fibonacci retracement, we can now see it extending even higher, ideally for subwave (5) of a higher degree wave 3 that can push the price even up to 28k-30k area this year, just watch out on short-term pullbacks.

Major Breakout For Nifty But a Lot of Resistances Await.We saw a major Breakout for Nifty today but there are a few resistances ahead of us. Three things could happen now:
1) Nifty Rampages ahead towards 26K If the Bull Rally has real substance.
2) We might see some consolidation in this range and and after consolidating, Nifty retesting some important support the rally begins again.
3) Bears That are trapped throw a counter punch.
Scenario 1) Nifty has some resistance ahead near 25116 and 25221. We already hit 25116 and then closed at 25062. But if these 2 resistances are cleared and we get a closing above them Nifty can move swiftly towards 25352, 25453, 25662, 25882 and then regain 26K+ levels.
Scenario 2) As the Nifty has been rampaging ahead post ceasefire news there is practically need of a consolidation here. If Nifty chooses Consolidation then it may come down to test the bottom and the supports from where it can launch again remain at 24864, 24525, 24369 and then Mother and Father Line supports at 23775 and 23536 respectively.
Scenario 3) Bears who are trapped badly with the shorts can also throw a counter punch. This punch however will be effective only if we get a closing below 23536. In such a scenario Bears can pull back the Nifty towards 23942, 23401, 22805 or even 22K levels. (This however looking at the momentum looks less likely but you can never say never in stock market.)
Disclaimer: The above information is provided for educational purpose, analysis and paper trading only. Please don't treat this as a buy or sell recommendation for the stock or index. The Techno-Funda analysis is based on data that is more than 3 months old. Supports and Resistances are determined by historic past peaks and Valley in the chart. Many other indicators and patterns like EMA, RSI, MACD, Volumes, Fibonacci, parallel channel etc. use historic data which is 3 months or older cyclical points. There is no guarantee they will work in future as markets are highly volatile and swings in prices are also due to macro and micro factors based on actions taken by the company as well as region and global events. Equity investment is subject to risks. I or my clients or family members might have positions in the stocks that we mention in our educational posts. We will not be responsible for any Profit or loss that may occur due to any financial decision taken based on any data provided in this message. Do consult your investment advisor before taking any financial decisions. Stop losses should be an important part of any investment in equity.

Review and plan for 15th May 2025 Nifty future and banknifty future analysis and intraday plan.
Quarterly results.
This video is for information/education purpose only. you are 100% responsible for any actions you take by reading/viewing this post.
please consult your financial advisor before taking any action.
----Vinaykumar hiremath, CMT

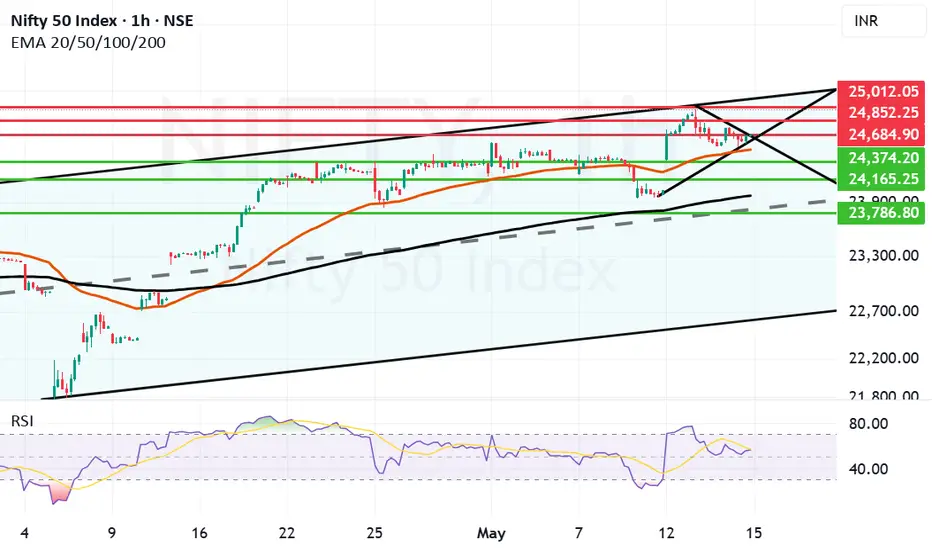
Volatile day where Mother line gave support to NiftyIt was a volatile day on browsers where Mother line of hourly chart gave support to Nifty and helped it close in Green. after opening in Green Nifty and making a high of 24767 Nifty saw selling pressure which took it to as low as 24535 losing over 232 points. There Nifty found the support of Mother line and rose 141 points closing at 24666 which is 88 points hig from yesterdays close. Further volatility cant be ruled out as Nifty is facing the resistance of the trend line at 24684. If this level is crossed Nifty can find further resistance at 24852 and 25012. 25012 seems to be a Channel top resistance which will be little difficult to cross. Supports for Nifty remain at 24505 (Mother Line Support), 24374, 24165 and 23979 (Father Line Support). If Father line support is broken by chance bears can drag Nifty further down to 23786 levels. Around this zone we will also have mid channel support of the parallel channel. Thigs are delicately poised with positive shadow of the candle.
Disclaimer: The above information is provided for educational purpose, analysis and paper trading only. Please don't treat this as a buy or sell recommendation for the stock or index. The Techno-Funda analysis is based on data that is more than 3 months old. Supports and Resistances are determined by historic past peaks and Valley in the chart. Many other indicators and patterns like EMA, RSI, MACD, Volumes, Fibonacci, parallel channel etc. use historic data which is 3 months or older cyclical points. There is no guarantee they will work in future as markets are highly volatile and swings in prices are also due to macro and micro factors based on actions taken by the company as well as region and global events. Equity investment is subject to risks. I or my clients or family members might have positions in the stocks that we mention in our educational posts. We will not be responsible for any Profit or loss that may occur due to any financial decision taken based on any data provided in this message. Do consult your investment advisor before taking any financial decisions. Stop losses should be an important part of any investment in equity.
Review and plan for 14th May 2025Nifty future and banknifty future analysis and intraday plan.
Quarterly results.
This video is for information/education purpose only. you are 100% responsible for any actions you take by reading/viewing this post.
please consult your financial advisor before taking any action.
----Vinaykumar hiremath, CMT

Nifty cooled down from the overbought zone. The correction in Nifty we saw today in most likelihood seems like a correction from overbought zone. The indicator for this is RSI which had reached 77.09 yesterday in the hourly chart. After the correction today it is back to 53.28 after reaching 51.5 earlier today. Another reason can be US and China agreeing to a trade deal which might also be seen as a negative for Indian markets. whether it will have very negative impact and send market further down is there to be seen. IT, Metals, Infra, MNC, Pvt Banking and Finance stocks were laggard. The indices that were positive today are Midcap, Small cap, Psu Banks, CG, Media and Pharma.
Supports for Nifty remain at: 24450 (Mother line of Hourly chart), 24374, 24165, 23929 (Father line of Hourly chart) and Mid channel support at 23786.
Resistances for Nifty remain at: 24642, 24797 and 25012 (Channel top resistance).
Shadow of the candle looks neutral as of now.
Disclaimer: The above information is provided for educational purpose, analysis and paper trading only. Please don't treat this as a buy or sell recommendation for the stock or index. The Techno-Funda analysis is based on data that is more than 3 months old. Supports and Resistances are determined by historic past peaks and Valley in the chart. Many other indicators and patterns like EMA, RSI, MACD, Volumes, Fibonacci, parallel channel etc. use historic data which is 3 months or older cyclical points. There is no guarantee they will work in future as markets are highly volatile and swings in prices are also due to macro and micro factors based on actions taken by the company as well as region and global events. Equity investment is subject to risks. I or my clients or family members might have positions in the stocks that we mention in our educational posts. We will not be responsible for any Profit or loss that may occur due to any financial decision taken based on any data provided in this message. Do consult your investment advisor before taking any financial decisions. Stop losses should be an important part of any investment in equity.

Review and plan for 13th May 2025 Nifty future and banknifty future analysis and intraday plan.
Quarterly results.
This video is for information/education purpose only. you are 100% responsible for any actions you take by reading/viewing this post.
please consult your financial advisor before taking any action.
----Vinaykumar hiremath, CMT

Brahmos Candle took off today. The situation was delicate on Friday but weekend brought a news that was favorable for the market. The news related to Ceasefire always helps the business and give a relief to the investors. We are yet to see how things shape up when the 'war of fog' disperses but things are coming back on track it seems as of now. Trade talks between US and China are also yielding some positive vibes. Thus the market today took off like a BRAHMOS Missile and had given one of the strongest candles which is very rare to see. Things are looking very bullish as of now if everything remains calm.
The Nifty supports right now seem to be near 24802, 24621 (Trend line Support) 24361, 23849, 23648 (Mother line on Daily chart) and 23498 (Father line on Daily chart).
The Nifty Resistances right now seem to be near 24944, 25062, 25245, 25505 and 25772. Once we close above 25772 if everything remain positive we can think of regaining even 26K levels and going deeper just like our missiles. But before we reach the Euphoria zone there are a lot of resistances to be crossed.
Shadow of the candle is Bullish however there can be chances of Profit booking as well where investors can tend to take their short / medium term profit.
Disclaimer: The above information is provided for educational purpose, analysis and paper trading only. Please don't treat this as a buy or sell recommendation for the stock or index. The Techno-Funda analysis is based on data that is more than 3 months old. Supports and Resistances are determined by historic past peaks and Valley in the chart. Many other indicators and patterns like EMA, RSI, MACD, Volumes, Fibonacci, parallel channel etc. use historic data which is 3 months or older cyclical points. There is no guarantee they will work in future as markets are highly volatile and swings in prices are also due to macro and micro factors based on actions taken by the company as well as region and global events. Equity investment is subject to risks. I or my clients or family members might have positions in the stocks that we mention in our educational posts. We will not be responsible for any Profit or loss that may occur due to any financial decision taken based on any data provided in this message. Do consult your investment advisor before taking any financial decisions. Stop losses should be an important part of any investment in equity.

Ceasefire will pump Nifty till 24500As we all know, the market is highly sensitive and tends to react quickly to news events.
Currently, there is ongoing conflict between India and Pakistan, which has caused the markets to open with consistent gap-downs, followed by rangebound movement for the remainder of the trading session.
However, recent developments indicate that Pakistan has realized it cannot continue the conflict without risking severe consequences, including potential erasure from the global map. As a result, they are now showing readiness for a ceasefire.
Given the market's sensitive nature, we can expect a positive reaction to this news.
A strong gap-up opening is likely in the coming sessions.
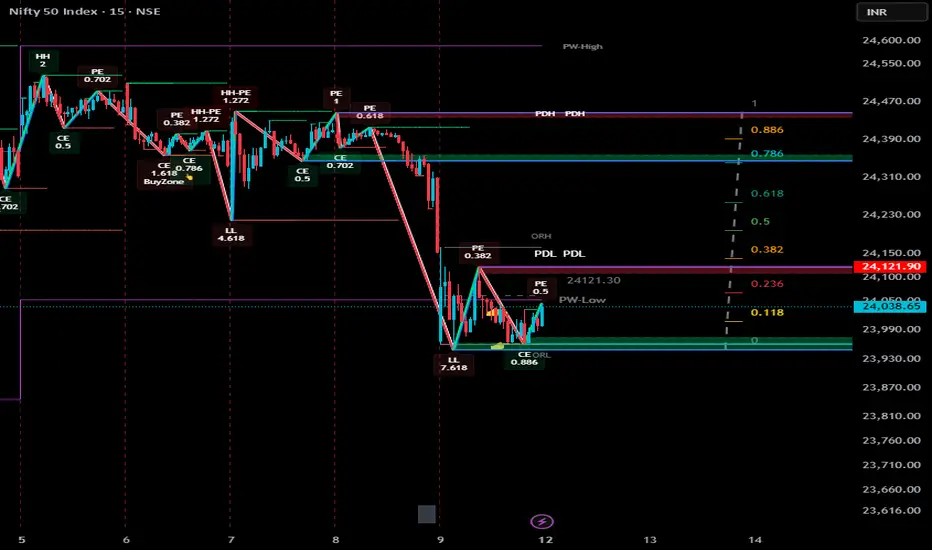
Technically, the market has the potential to rally towards the 0.886 Fibonacci level, which corresponds to the 2400–2500 zone.
Traders should remain cautious but optimistic, and closely monitor key levels for confirmation of the trend.
#Nifty
Review and plan for 12th May 2025 Nifty future and banknifty future analysis and intraday plan.
Quarterly results.
This video is for information/education purpose only. you are 100% responsible for any actions you take by reading/viewing this post.
please consult your financial advisor before taking any action.
----Vinaykumar hiremath, CMT

So finally Nifty recedes a bit due to Indo-Pak tensions.Finally Nifty today receded a bit due to Indo-Pak tensions and war like situation/war between Indo-Pak. The support levels for Nifty now remains at 23924, 23809 important (Father line support of hourly chart), 23676 important mid channel support if this support is broken bears can drag Nifty further down to 23462, 23279, 22771 and finally 22579 which is the channel bottom support. If this level is broken there can be further free fall. Resistances on the upper side remain at 24111, 24247 (Mother Line resistance on the hourly chart), 24443, 24634 and 24892 (Channel top resistance). Situation remains fluid due to the Geo-Political situation no support can be very strong support as a lot can happen during the week end and no resistance can be a solid resistance if few things move in the anticipated direction.
Disclaimer:The above information is provided for educational purpose, analysis and paper trading only. Please don't treat this as a buy or sell recommendation for the stock or index. The Techno-Funda analysis is based on data that is more than 3 months old. Supports and Resistances are determined by historic past peaks and Valley in the chart. Many other indicators and patterns like EMA, RSI, MACD, Volumes, Fibonacci, parallel channel etc. use historic data. There is no guarantee they will work in future as markets are highly volatile and swings in prices are also due to macro and micro factors based on actions taken by the company as well as region and global events. Equity investment is subject to risks. I or my clients or family members might have positions in the stocks that we mention in our educational posts. We will not be responsible for any Profit or loss that may occur due to any financial decision taken based on any data provided in this message. Do consult your investment advisor before taking any financial decisions. Stop losses should be an important part of any investment in equity.

Review and plan for 9th May 2025 Nifty future and banknifty future analysis and intraday plan.
Quarterly results.
This video is for information/education purpose only. you are 100% responsible for any actions you take by reading/viewing this post.
please consult your financial advisor before taking any action.
----Vinaykumar hiremath, CMT

Nifty preparing itself for Big Momentum Today 8may 2025 Nifty traded in just tiny range even on expiry Day. so, what will be next Move?
it is ready for bearish momentum ?
First reason: I have noticed multiple weakness through Wick which is representing by arow on chart.
Second reason: whenever market traded in narrow range (around 8-10 hourly candle) in past few days it gave breakdown represented drawing 4 yellow area see on chart.

Review and plan for 8th May 2025 Nifty future and banknifty future analysis and intraday plan.
Quarterly results.
This video is for information/education purpose only. you are 100% responsible for any actions you take by reading/viewing this post.
please consult your financial advisor before taking any action.
----Vinaykumar hiremath, CMT

Very Strong performance by Nifty to close in Positive todayDespite the fear of escalation of tensions at Indo-Pak border and Indian carrying out Operation Sindoor Nifty closed in Green today. This signifies the strength of Indian market, India as an Economy and India as a country. Very few would have imagined that Indian markets will close in Green today when the market begun early morning. The situation still remains fluid/dynamic and explosive. so still investors should keep stop losses and trailing stop losses in place.
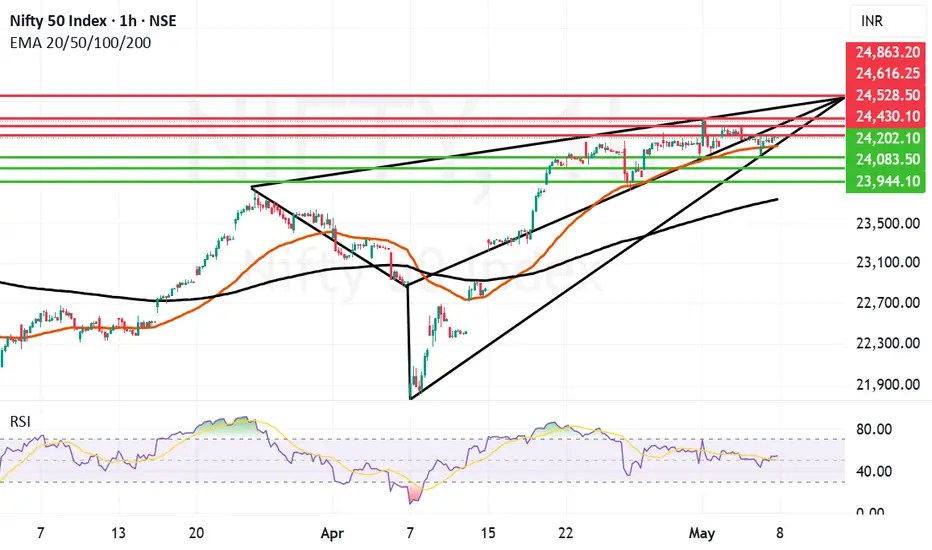
Supports for Nifty remain at: 24315 (Strong Mother line for hourly chart), 24202, 24083, 23944 and 23754 (Strong Father Line support). Below 23754 Bears can take control of the market and drag it towards 23K.
Resistances For Nifty remain at: 24430, 24528, 24616 and 24863. Closing above 24863 can empower Bulls in a big way to Pull Index towards 25K+ levels.
Disclaimer: The above information is provided for educational purpose, analysis and paper trading only. Please don't treat this as a buy or sell recommendation for the stock or index. The Techno-Funda analysis is based on data that is more than 3 months old. Supports and Resistances are determined by historic past peaks and Valley in the chart. Many other indicators and patterns like EMA, RSI, MACD, Volumes, Fibonacci, parallel channel etc. use historic data which is 3 months or older cyclical points. There is no guarantee they will work in future as markets are highly volatile and swings in prices are also due to macro and micro factors based on actions taken by the company as well as region and global events. Equity investment is subject to risks. I or my clients or family members might have positions in the stocks that we mention in our educational posts. We will not be responsible for any Profit or loss that may occur due to any financial decision taken based on any data provided in this message. Do consult your investment advisor before taking any financial decisions. Stop losses should be an important part of any investment in equity.
Review and plan for 7th May 2025 Nifty future and banknifty future analysis and intraday plan.
Quarterly results.
This video is for information/education purpose only. you are 100% responsible for any actions you take by reading/viewing this post.
please consult your financial advisor before taking any action.
----Vinaykumar hiremath, CMT

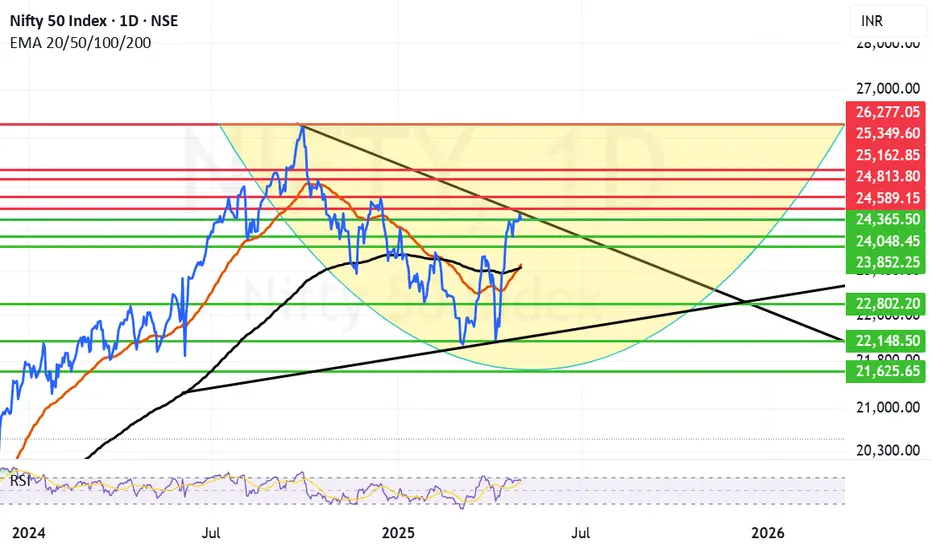
24589 proving to be a difficult resistance to conquerNifty once again tried to sustain the levels above 24500 but again faced resistance and pulled back. Amidst the drums of Ind-Pak war beating and ongoing tariff war the investors are afraid to take seriously long positions. Also we will have a US Fed rate decision coming up which is also adding to the investor anxiety. Mid and Small cap took the maximum brunt today due to all these factors. The Nifty resistance at 24589 is proving very difficult to be conquered with all the noise going around. Nifty resistance levels remain at 24509 and 24589 if we get a closing above 24589 Nifty can easily move for war 24813, and 25162. Supports for Nifty on the down side are at 24365, 24048, 23852 and the zone between 23515 (Mother line) and 23461 (Father line). If we get a closing below 23461, Nifty can again fall to the levels of 22802, 22148 or even 21625. (That is in adverse geo-political developments). A lot right now depends on Macro factors affecting the index and overall situation on Geo-Political front.
Disclaimer: The above information is provided for educational purpose, analysis and paper trading only. Please don't treat this as a buy or sell recommendation for the stock or index. The Techno-Funda analysis is based on data that is more than 3 months old. Supports and Resistances are determined by historic past peaks and Valley in the chart. Many other indicators and patterns like EMA, RSI, MACD, Volumes, Fibonacci, parallel channel etc. use historic data which is 3 months or older cyclical points. There is no guarantee they will work in future as markets are highly volatile and swings in prices are also due to macro and micro factors based on actions taken by the company as well as region and global events. Equity investment is subject to risks. I or my clients or family members might have positions in the stocks that we mention in our educational posts. We will not be responsible for any Profit or loss that may occur due to any financial decision taken based on any data provided in this message. Do consult your investment advisor before taking any financial decisions. Stop losses should be an important part of any investment in equity.
Review and plan for 6th May 2025Nifty future and banknifty future analysis and intraday plan.
Quarterly results.
This video is for information/education purpose only. you are 100% responsible for any actions you take by reading/viewing this post.
please consult your financial advisor before taking any action.
----Vinaykumar hiremath, CMT
