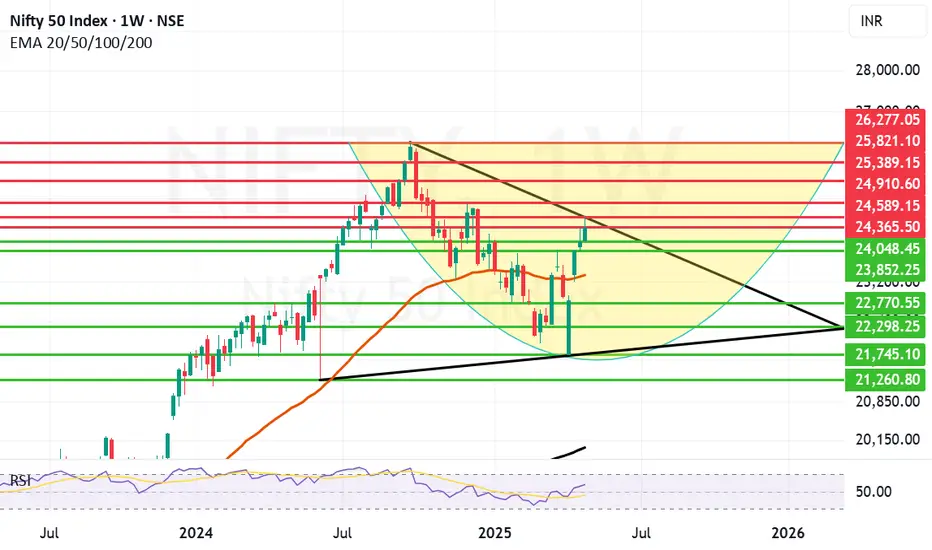
Nifty eyeing Trendline breakout amidst uncertainty. Amidst uncertainty on Geo-Political front Nifty gave up 242 points it had gained earlier in the day. Also it bounced 108 points from the day's low to close 12 points in positive at 24346.7 in a highly volatile Friday.
Reliance remains start of the week after posting stellar results earlier in the week. The Trendline resistance zone between 24365 and 24589 remains difficult to conquer for Nifty. Once we get a closing above 24589 can the bulls try to pull Nifty further up towards 24910 and 25K+ levels.
Incase the trend line resistance is not crossed successfully the support for Nifty remains at 24048, 23852 and 23343. As of now it looks that the level of 23343 which is the Mother line of Weekly candle chart (strong Support) can be breached only if there is flare up of incidents on the Border or elsewhere.
The situation at Indo-Pak Border remains delicate and tense that might be one reason why investors did not carry long positions into the weekend and Nifty lost most of it's gains.
Right now a lot depends on what happens between the 2 nations and surrounding region. Investment in large cap companies remains the safest option looking at the uncertainty. Even in the case of flare-up at the border these companies will be the first to bounce back after situation normalises.
Disclaimer: The above information is provided for educational purpose, analysis and paper trading only. Please don't treat this as a buy or sell recommendation for the stock or index. The Techno-Funda analysis is based on data that is more than 3 months old. Supports and Resistances are determined by historic past peaks and Valley in the chart. Many other indicators and patterns like EMA, RSI, MACD, Volumes, Fibonacci, parallel channel etc. use historic data which is 3 months or older cyclical points. There is no guarantee they will work in future as markets are highly volatile and swings in prices are also due to macro and micro factors based on actions taken by the company as well as region and global events. Equity investment is subject to risks. I or my clients or family members might have positions in the stocks that we mention in our educational posts. We will not be responsible for any Profit or loss that may occur due to any financial decision taken based on any data provided in this message. Do consult your investment advisor before taking any financial decisions. Stop losses should be an important part of any investment in equity.
NIFTY
NIFTY SHORT TRYWe can see the huge sellers placed at the current level.
Can try 24200PE at 110 with 15 points SL

Review and plan for 2nd May 2025Nifty future and banknifty future analysis and intraday plan.
Quarterly results.
This video is for information/education purpose only. you are 100% responsible for any actions you take by reading/viewing this post.
please consult your financial advisor before taking any action.
----Vinaykumar hiremath, CMT

Nifty trying to break trendline resistance. As depicted yesterday we are near the trendline resistance. These trendline resistance like Mother and Father resistances are not easy to break but once broken they become a massive support zone. Nifty as we saw today is trying to break this trendline resistance which is there near 24359. Once this resistance will be crossed and we get a closing above the same we can see Nifty move swiftly towards 24538 and 24816. After closing above 24816 Nifty can move towards capturing 25K level back. Supports for Nifty remain at 23980 and 23708. Below 23708 we have the Mother and Father line support near 23365 and 23424. To know more about Mother Father and Small Child theory. To learn it to master it. Read my book. The Happy Candles Way To Wealth Creation available on Amazon in Paperback and Kindle version.
Disclaimer: The above information is provided for educational purpose, analysis and paper trading only. Please don't treat this as a buy or sell recommendation for the stock or index. The Techno-Funda analysis is based on data that is more than 3 months old. Supports and Resistances are determined by historic past peaks and Valley in the chart. Many other indicators and patterns like EMA, RSI, MACD, Volumes, Fibonacci, parallel channel etc. use historic data which is 3 months or older cyclical points. There is no guarantee they will work in future as markets are highly volatile and swings in prices are also due to macro and micro factors based on actions taken by the company as well as region and global events. Equity investment is subject to risks. I or my clients or family members might have positions in the stocks that we mention in our educational posts. We will not be responsible for any Profit or loss that may occur due to any financial decision taken based on any data provided in this message. Do consult your investment advisor before taking any financial decisions. Stop losses should be an important part of any investment in equity.

Nifty Momentum may lead it to 44000 levelNifty monthly chart is showing a rapid growth since last 5 years, this momentum may lead it to these levels 28000, 36000 and 44000 levels.

Review and plan for 30th April 2025 Nifty future and banknifty future analysis and intraday plan.
Quarterly results.
This video is for information/education purpose only. you are 100% responsible for any actions you take by reading/viewing this post.
please consult your financial advisor before taking any action.
----Vinaykumar hiremath, CMT

is selling being absorbing near 23350 level ?yesterday 27 April I mentioned that nifty must have to break & sustained 23350 level it happened today but long upper wick on hourly time with high volume been noticed showing selling pressure in market of course market bullish momentum still intact it respected the near 23800 level trading above 20 EMA but we need to wait more multiple testing for confirmation to continue upside journey so consolidation may happen in 2-3 days.

Review and plan for 29th April 2025 Nifty future and banknifty future analysis and intraday plan.
Quarterly results analysis.
This video is for information/education purpose only. you are 100% responsible for any actions you take by reading/viewing this post.
please consult your financial advisor before taking any action.
----Vinaykumar hiremath, CMT

Nifty on the verge of Trendline Breakout. There is a major possibility of a Trendline Breakout amidst the rumblings on conflict with enemy nations. The main reason for Market rally today was Superb results posted by Reliance and a rally in PSU, Capital goods and defense related stocks. A lot of stocks that were oversold in the knee-jerk reaction on Friday also tried to catch-up. As the situation on the border remains tense we can have a sudden major decline as a reaction to the Geo-Political proceedings. Thus investors are asked to remains cautious and not to carry heavy derivative positions overnight. Even in the eventuality of a war actually happening one think of remaining invested in companies that can bounce back faster once the situation de-escalates.
Major Supports for Nifty on daily chart now remain at: 23988, 23708, 23415 (Major Father line support), 23325 (Major Mother Line Support) in case of Mother and Father line failing Bears can drag Nifty further down to 22875, 22142 and 21844.
Major Resistances For Nifty remain at: 24359 (Major Trend line resistance), 24538, 24816 (Is another major resistance on Fibonacci scale), If we get a closing above 24816 Nifty can easily flow towards 25183, 25399 and 25603.
Disclaimer: The above information is provided for educational purpose, analysis and paper trading only. Please don't treat this as a buy or sell recommendation for the stock or index. The Techno-Funda analysis is based on data that is more than 3 months old. Supports and Resistances are determined by historic past peaks and Valley in the chart. Many other indicators and patterns like EMA, RSI, MACD, Volumes, Fibonacci, parallel channel etc. use historic data which is 3 months or older cyclical points. There is no guarantee they will work in future as markets are highly volatile and swings in prices are also due to macro and micro factors based on actions taken by the company as well as region and global events. Equity investment is subject to risks. I or my clients or family members might have positions in the stocks that we mention in our educational posts. We will not be responsible for any Profit or loss that may occur due to any financial decision taken based on any data provided in this message. Do consult your investment advisor before taking any financial decisions. Stop losses should be an important part of any investment in equity.

Live buying signal in Nifty 24275Live Khareedo (Buying) signal in Nifty at 24275, lets see how long it will go up.
Note: This is not a buy/sell trade call. trade at your own will and analysis. Use stop loss.

let it be cross & sustained above 24350 leveltoday 28 April market showing strengths after little correction on Friday, yeah ofc market mode is still bullish but see BULLISH LEG 1 mention on chart below avg. traded volume not supporting price same Today BULLISH LEG 2 also have below avg. volume noticed, same you can noticed on 23 April when market was going up below avg. volume before falling , so if nifty really bullish pls let it be cross and sustained above 24350 level

Review and plan for 28th April 2025 Nifty future and banknifty future analysis and intraday plan.
Quarterly results.
This video is for information/education purpose only. you are 100% responsible for any actions you take by reading/viewing this post.
please consult your financial advisor before taking any action.
----Vinaykumar hiremath, CMT

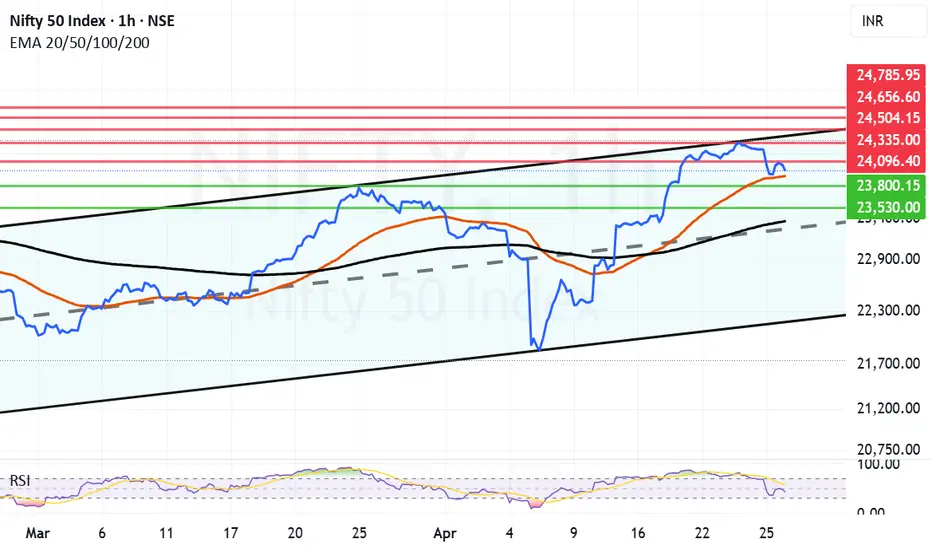
Despite Geo-Political tensions, Nifty closes above Mother line. It was quite remarkable for Nifty to close above the Mother line (50 Hours EMA) despite the Geo-Political tensions and brewing storm of escalations at border. This shows the character of not only Indian market but the resilience of India as a nation. In yesterday's post itself we had mentioned that strong technical resistance has been reached. Add the tension and intent of India to fight against terrorism so it was a perfect recipe for a major fall. Which may happen if things escalate further next week but recovering from 23847 and to close above 24K at 24039 shows that when things will be back to normal the indices will bounce back. Resistance for Nifty now remain at 24096, 24335 and 24504. Supports for Nifty remain at 23914 (Major Mother line support) of 50 Hours EMA, 23800, 23530 and finally 23363.
While Long term players, FII, HNI and DII look at such opportunities to invest for Retail trader it becomes very difficult to control their emotions in such an environment of Geo-political pressure and then we saw a huge fall in the market. The opportunity was seized by both DII and FII with both hands as both turned net buyers for Rs.6492+ Crores. So traders / investors should always avoid knee jerk reactions. Who knows what happens during the weekend the support and resistance levels to watch out for are already mentioned in the message.
Disclaimer: The above information is provided for educational purpose, analysis and paper trading only. Please don't treat this as a buy or sell recommendation for the stock or index. The Techno-Funda analysis is based on data that is more than 3 months old. Supports and Resistances are determined by historic past peaks and Valley in the chart. Many other indicators and patterns like EMA, RSI, MACD, Volumes, Fibonacci, parallel channel etc. use historic data which is 3 months or older cyclical points. There is no guarantee they will work in future as markets are highly volatile and swings in prices are also due to macro and micro factors based on actions taken by the company as well as region and global events. Equity investment is subject to risks. I or my clients or family members might have positions in the stocks that we mention in our educational posts. We will not be responsible for any Profit or loss that may occur due to any financial decision taken based on any data provided in this message. Do consult your investment advisor before taking any financial decisions. Stop losses should be an important part of any investment in equity.
Review and plan for 25th April 2025 Nifty future and banknifty future analysis and intraday plan.
Quarterly results.
This video is for information/education purpose only. you are 100% responsible for any actions you take by reading/viewing this post.
please consult your financial advisor before taking any action.
----Vinaykumar hiremath, CMT

Nifty has hit a channel top with geopolitical events unravellingNifty was swiftly recovering after the Tariff war induced fall. On technical front Nifty has hit a channel top In the hourly line chart. Chanel tops are not easy to conquer and we saw Nifty retrieving today from there. Adding pressure to the rally is the Geo-Political situation after the Dastardly Pahalgam Terrorist Attack. If there is any action by India like Balakot (Swift and fast) any way it will be denied by Pakistan so nothing much will happen to Index. If there is only Political/Geopolitical long term steps taken again it will have less effect on the market. Market may decline drastically only if there is a full blown war between the 2 countries or more than 2 countries. (Possibility of that happening is less but we never know). Not much is in our hand if such a scenario arises. FIIs were seen buying big today so that is something to watchout in the coming days.
Technical Supports for Nifty remain at: 24096, 23882 (Mother Line Support), 23800 and 23316 (Father Line Support). (Mid channel support is also around 23300) so this zone presents a strong support zone.
Technical Resistances Remain at: 24335 (Major Channel Top Resistance), 24504, 24656 and 24785.
Disclaimer: The above information is provided for educational purpose, analysis and paper trading only. Please don't treat this as a buy or sell recommendation for the stock or index. The Techno-Funda analysis is based on data that is more than 3 months old. Supports and Resistances are determined by historic past peaks and Valley in the chart. Many other indicators and patterns like EMA, RSI, MACD, Volumes, Fibonacci, parallel channel etc. use historic data which is 3 months or older cyclical points. There is no guarantee they will work in future as markets are highly volatile and swings in prices are also due to macro and micro factors based on actions taken by the company as well as region and global events. Equity investment is subject to risks. I or my clients or family members might have positions in the stocks that we mention in our educational posts. We will not be responsible for any Profit or loss that may occur due to any financial decision taken based on any data provided in this message. Do consult your investment advisor before taking any financial decisions. Stop losses should be an important part of any investment in equity.

Review and plan for 24th April 2025 Nifty future and banknifty future analysis and intraday plan in kannada.
Quarterly results.
This video is for information/education purpose only. you are 100% responsible for any actions you take by reading/viewing this post.
please consult your financial advisor before taking any action.
----Vinaykumar hiremath, CMT

1/A wave done on the upside. 2/B down underway?Too early to say but NSE:NIFTY seem to have completed wave 1/A and has potentially started wave 2/B down which should hit 23400-23300 zone at the minimum, which happens to be 38.6% retracement of the rise 1/A.

INDIA WAVE B OR 2 TOP EXIT NOW !!The Chart posted is the nifty 50 India market .I am now turning Bearish As we seem to be ending my alt Wave count for wave C up in the ABC rally . We are now at HIGH RISK if this turns Down . Best of Trades WAVETIMER

Review and plan for 23rd April 2025 Nifty future and banknifty future analysis and intraday plan in kannada.
This video is for information/education purpose only. you are 100% responsible for any actions you take by reading/viewing this post.
please consult your financial advisor before taking any action.
----Vinaykumar hiremath, CMT

Nifty - moderation of +ve momentum seen on short period charts.Nifty closed with over 1% 21 VWMA was rising, Nifty respected SD+2 resistance today.
23298, 23395 resistance levels for tomorrow.
SD+1 or 23057 acted as major support today, any breach below this and sustaining lower will signal some weakness.
23730 major pivot, as long as this is help, uptrend is intact, and Nifty is in buy on dips.
24060, 23930, 23875, 23790, 23760 major support levels.

Review and plan for 22nd April 2025 Nifty future and banknifty future analysis and intraday plan in kannada.
This video is for information/education purpose only. you are 100% responsible for any actions you take by reading/viewing this post.
please consult your financial advisor before taking any action.
----Vinaykumar hiremath, CMT

Nifty - Ready to ride to 30k?Alright guys, I’ve been getting this a lot — ‘What’s up with Nifty 50- Though am a pure crypto guy but onto the request i would analyse the index, and i feel its very bullish! And i searched some problem is there if someone analyse it - Its just a educational chart!! So the alleged doesnt disturb me lol.
This is a market profile
After a sharp correction earlier in April, the index formed a base with tightly packed POCs and balanced value areas between 22,400–23,400 levels. This region acted as a strong accumulation zone. Post that, a sharp breakout above the previous VAH (Value Area High) occurred, and price has now cleanly auctioned above 24,000. What’s impressive is the most recent structure: the POC, VAL, and VAH have all shifted higher in alignment, suggesting that acceptance at higher prices is taking place. The current POC at around 24,100 further validates that market participants are comfortable building volume at elevated levels. Unless we fall back below 23,800–23,900 (which is now a key demand zone), Nifty 50 is showing strength and could attempt the 24,400–24,600 range in the upcoming sessions.

Another remarkable leap by Nifty. Channel top approaching. Nifty gained some serious ground again today closing 273.9 points up from previous close. The zone between 24202 and 24479 is the zone which stand between full blown Bull rally and some consolidation. The regressing parallel channel which started after Nifty made a high 26277 can be overcome if we get a closing above 24366. Immediate resistance is near 24202 before we reach there. Once we get a weekly closing above 24479 Bulls will take total control of the market. In such a scenario the Nifty can find resistance near 24830 before it can regain 25K levels.
If Nifty fails to conquer 24202, 24366 or 24479 then the supports will be near 23786. Bears can come back in picture if we get a closing above 23786. In such a scenario Mother and Father lines of hourly chart will play the supporting role at 23411 and 23101. Again near 23101 in addition to the Father line there is also Mid-Channel support thus this level should be considered a major support zone.
Since RSI of hourly chart is above 80 there is a chance of slight correction and consolidation which should also be looked at while taking fresh positions. RSI above 80 indicates that the positions might be just slightly be in the overbought zone.
Disclaimer: The above information is provided for educational purpose, analysis and paper trading only. Please don't treat this as a buy or sell recommendation for the stock or index. The Techno-Funda analysis is based on data that is more than 3 months old. Supports and Resistances are determined by historic past peaks and Valley in the chart. Many other indicators and patterns like EMA, RSI, MACD, Volumes, Fibonacci, parallel channel etc. use historic data which is 3 months or older cyclical points. There is no guarantee they will work in future as markets are highly volatile and swings in prices are also due to macro and micro factors based on actions taken by the company as well as region and global events. Equity investment is subject to risks. I or my clients or family members might have positions in the stocks that we mention in our educational posts. We will not be responsible for any Profit or loss that may occur due to any financial decision taken based on any data provided in this message. Do consult your investment advisor before taking any financial decisions. Stop losses should be an important part of any investment in equity.
