NIFTY INTRADAY LEVELS FOR 09/07/2024BUY ABOVE - 24350
SL - 24300
TARGETS - 24400,24480,24550
SELL BELOW - 24300
SL - 24350
TARGETS - 24230,24160,24060
NO TRADE ZONE - 24300 to 24350
Previous Day High - 24350
Previous Day Low - 24230
Based on price action major support & resistance's are here, the red lines acts as resistances, the green lines acts as supports. If the price breaks the support/resistance, it will move to the next support/resistance line. White lines indicates previous day high & low, high acts as a resistance & low acts as a support for next day.
Trendlines are also significant to price action. If the price is above/below the trendlines, can expect an UP/DOWN with aggressive move.
Please NOTE: this levels are for intraday trading only.
Disclaimer - All information on this page is for educational purposes only,
we are not SEBI Registered, Please consult a SEBI registered financial advisor for your financial matters before investing And taking any decision. We are not responsible for any profit/loss you made.
Request your support and engagement by liking and commenting & follow to provide encouragement
HAPPY TRADING 👍
Nifty50

Nifty Intraday (09-Jul-2024)Description:
Explore intraday trading analysis for Nifty 50. We've identified critical buy and sell levels based on the latest candlestick patterns and EMA trends.
Buy Signal: Consider a long position if Nifty 50 rises above 24,350, with an open target of 24,450+. This move suggests bullish momentum could extend further, offering a potential profit opportunity.
Sell Signal: A short position is advisable if the index drops below 24,265, targeting 24,150-. This setup is based on recent resistance and the potential for downward continuation.
Chart Details:
-Time Frame: 15 minutes
-Indicator: 20-period Exponential Moving Average (EMA)
Trading Strategy:
The strategy utilizes precise entry and exit points to capitalize on short-term price movements. Risk management through stop-loss orders at strategic levels is recommended to minimize potential losses.

Nifty Intraday (08-Jul-2024)It looks like you have provided a trading chart for Nifty 50 Index with specific trading signals for July 8th. Here are the key details from the chart:
Buy Signal:
-Trigger: Above 24,350
-Target: Open for 24,450+
Sell Signal:
-Trigger: Below 24,265
-Target: 24,150-
The chart uses a 15-minute timeframe and shows the price action along with an EMA (20) indicator.

NIFTY INTRADAY LEVELS FOR 08 JULY 2024BUY ABOVE - 24350
SL - 24300
TARGETS - 24400,24480,24550
SELL BELOW - 24300
SL - 24350
TARGETS - 24230,24160,24060
NO TRADE ZONE - 24300 to 24350
Previous Day High - 24350
Previous Day Low - 24160
Based on price action major support & resistance's are here, the red lines acts as resistances, the green lines acts as supports. If the price breaks the support/resistance, it will move to the next support/resistance line. White lines indicates previous day high & low, high acts as a resistance & low acts as a support for next day.
Trendlines are also significant to price action. If the price is above/below the trendlines, can expect an UP/DOWN with aggressive move.
Please NOTE: this levels are for intraday trading only.
Disclaimer - All information on this page is for educational purposes only,
we are not SEBI Registered, Please consult a SEBI registered financial advisor for your financial matters before investing And taking any decision. We are not responsible for any profit/loss you made.
Request your support and engagement by liking and commenting & follow to provide encouragement
HAPPY TRADING 👍

NIFTY INTRADAY LEVELS FOR 5TH JULY 2024BUY ABOVE - 24400
SL - 24350
TARGETS - 24480,24550,24630
SELL BELOW - 24300
SL - 24350
TARGETS - 24230,24160,24060
NO TRADE ZONE - 24300 to 24400
Previous Day High - 24400
Previous Day Low - 24300
Based on price action major support & resistance's are here, the red lines acts as resistances, the green lines acts as supports. If the price breaks the support/resistance, it will move to the next support/resistance line. White lines indicates previous day high & low, high acts as a resistance & low acts as a support for next day.
Trendlines are also significant to price action. If the price is above/below the trendlines, can expect an UP/DOWN with aggressive move.
Please NOTE: this levels are for intraday trading only.
Disclaimer - All information on this page is for educational purposes only,
we are not SEBI Registered, Please consult a SEBI registered financial advisor for your financial matters before investing And taking any decision. We are not responsible for any profit/loss you made.
Request your support and engagement by liking and commenting & follow to provide encouragement
HAPPY TRADING 👍

Nifty made a high near our predicted top yesterday.As predicted the current top seems to be around 24408. Nifty reached round about there, made a high of 24401 and closed at 24302 which is 98.85 points down. The resistnace remains the same and supports remain the same. In fact there is a very weak additional support now at 24396 followed by 24236. Other supports for Nifty remain in the range between 24144 and 24088 (Mother Line 50 hours EMA). Below 24088 Nifty will be weak and only major support remaining will be between 23983 and 23807 before Nifty hits 23477 (Which is 200 Hours EMA). Below 23477 Bears will gain more ground and solid momentum.

Nifty Intraday (05-Jul-2024)The image is a chart displaying the 15-minute price movements of the Nifty 50 Index for July 3rd and 4th, 2024. It includes technical analysis with marked buy and sell signals:
-Buy Signal: A suggestion to buy above 24,350 with a target open for 24,450 or more.
-Sell Signal: A recommendation to sell below 24,275 with a target of 24,125 or lower.
The chart also shows the 20-period Exponential Moving Average (EMA), which helps traders gauge the trend direction and potential support or resistance levels.

Nifty50 (4th July) 1/1
If candle closes above that dash line or 24384 in hourly then 📈 📈 to 24462
Hourly 🕯 closing below that red line could be 📉 📉
Disclaimer:
It's a personal view not a financial advice and I assume no responsibility and liability whatever outcome arises.

One more hurdle crossed, Very little room left at the top. One more major hurdle crossed by Nifty and very little room left at the top. Unless there is a channel top breakout. The final resistance remaining before we have a channel top break out is 24408. Today the hurdle of 24236 was closed by a gap up opening the same level was tested as well so now it will act as a support. Other supports for Nifty remain in the range between 24054 and 24010 (Mother Line 50 hours EMA). Below 24010 Nifty will be weak and only major support remaining will be 23807 before Nifty hits 23416 (Which is 200 Hours EMA). Below 23416 Bears will gain more ground and solid momentum.

Nifty Intraday (03-Jul-2024)15-minute intraday chart for the Nifty 50 index from a trading view. It includes data and trading strategies for July 4th, 2024. The chart displays price movements with a plotted Exponential Moving Average (EMA). There are strategic points marked for buying and selling:
Buy Signal: The chart suggests buying if the index moves above 24,325 points with a target open for reaching above 24,450 points.
Sell Signal: The chart suggests selling if the index falls below 24,225 points, with a target of reaching around 24,100 points.

HDFC BREAKOUT Hi guys,
Its me Guruzzz
HDFC Breakout
A "breakout" in the context of stock trading typically refers to a situation where the price of a stock moves above a resistance level or below a support level with increased volume. For HDFC (Housing Development Finance Corporation), a breakout could signify a significant upward or downward movement in the stock price, suggesting potential buying or selling opportunities for traders.
Indicators of a Positive Breakout:
Price Movement: If HDFC’s stock price breaks above a key resistance level, it indicates a bullish trend.
Volume: Increased trading volume during the breakout confirms the strength of the movement.
Technical Indicators: Positive signals from technical indicators such as moving averages, RSI (Relative Strength Index), and MACD (Moving Average Convergence Divergence) can support the breakout.
Positive Words About HDFC
Strong Financial Performance:
Consistent Growth: HDFC has demonstrated consistent growth in revenue and profitability over the years, reflecting its robust business model and strategic vision.
Solid Asset Quality: The company's focus on maintaining a high-quality loan portfolio has ensured minimal non-performing assets (NPAs), contributing to financial stability.
Market Leadership:
Industry Leader: HDFC is a market leader in the housing finance sector in India, with a strong presence and extensive reach across the country.
Reputation and Trust: The brand is synonymous with trust and reliability, having established a strong reputation among customers and stakeholders.
Innovation and Adaptability:
Technological Innovation: HDFC has been at the forefront of adopting technology to enhance customer experience, streamline operations, and improve efficiency.
Product Diversification: The company offers a wide range of financial products and services, catering to various customer needs and preferences.
Strong Management Team:
Experienced Leadership: HDFC's leadership team comprises experienced professionals with a deep understanding of the financial industry, driving the company's strategic initiatives.
Visionary Strategies: The management's forward-thinking strategies have enabled HDFC to navigate market challenges and capitalize on growth opportunities.
Corporate Governance and Social Responsibility:
Robust Governance: HDFC adheres to high standards of corporate governance, ensuring transparency, accountability, and ethical practices.
Social Impact: The company is committed to corporate social responsibility (CSR) initiatives, contributing to social development and community welfare.
Conclusion
HDFC's breakout indicates potential positive momentum in its stock price, driven by strong financial performance, market leadership, innovation, experienced management, and commitment to corporate governance and social responsibility. These attributes make HDFC a reputable and reliable company in the financial sector.
Disclaimer - All information on this page is for educational purposes only,
we are not SEBI Registered, Please consult a SEBI registered financial advisor for your financial matters before investing And taking any decision. We are not responsible for any profit/loss you made.

Nifty almost flat in but moving in a tight range. Nifty is moving in a tight range. On higher levels there is Profit booking as it falls there is buying. Perfect Bull bear tussel at play. during the tussel Nifty has found a new support of today's low at 24054. Also extended it's resistance to 24236. If we get a closing above 24236 the Channel top currently looks near 24350 to 24408 range. There is a possibility of Channel top resistance as well as channel breakout. If there is a break out we will give new targets then but supports for now are 24054, 24986, 23925 (Mother Line Support) 50 hours EMA and 23807. Resistance being at 24180, 24236 and 24408.

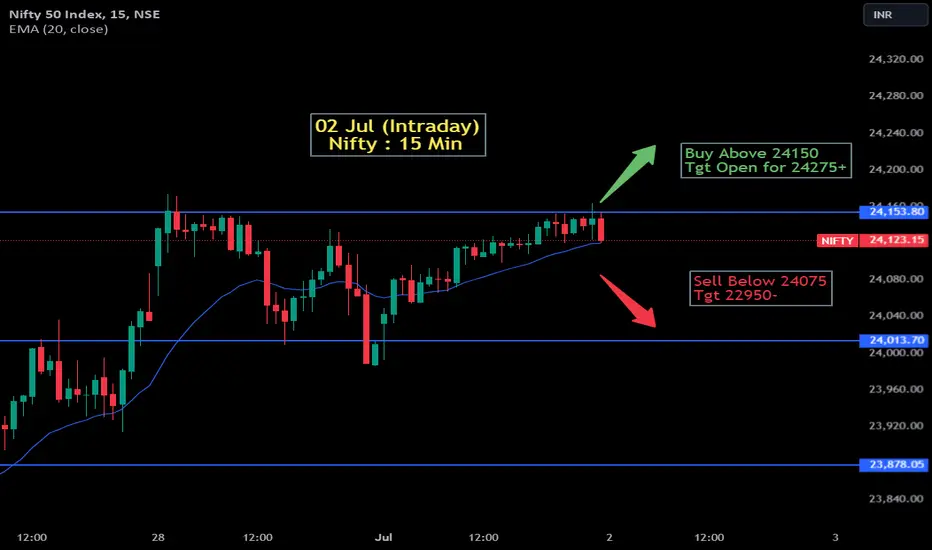
Nifty Intraday (03-Jul-2024)📈 #Nifty 15-min Intraday Strategy (3 Jul):
Buy above 24,150 🎯 Target: 24,275+
Sell below 24,075 🎯 Target: 22,950-
Key Levels:
Resistance: 24,153.80
Support: 24,013.70
#Trading #StockMarket #Nifty50

NIFTY INTRADAY LEVELS FOR 2ND JULY 2024BUY ABOVE - 24160
SL - 24100
TARGETS - 24280,24380,24480
SELL BELOW - 24010
SL - 24100
TARGETS - 23900,23800,23740
NO TRADE ZONE - 24010 to 24160
Previous Day High - 24160
Previous Day Low - 24010
Based on price action major support & resistance's are here, the red lines acts as resistances, the green lines acts as supports. If the price breaks the support/resistance, it will move to the next support/resistance line. White lines indicates previous day high & low, high acts as a resistance & low acts as a support for next day.
Trendlines are also significant to price action. If the price is above/below the trendlines, can expect an UP/DOWN with aggressive move.
Please NOTE: this levels are for intraday trading only.
Disclaimer - All information on this page is for educational purposes only,
we are not SEBI Registered, Please consult a SEBI registered financial advisor for your financial matters before investing And taking any decision. We are not responsible for any profit/loss you made.
Request your support and engagement by liking and commenting & follow to provide encouragement
HAPPY TRADING 👍

Today's high will be an important resistance. Today's high of 24164 will be an important resistance. Closing above 24164 can open the door for 24322. 24322 is a very important channel top and trend top resistance. As there is very less room left towards the top and Nifty is delicately placed on the trend line.
There are 2 things that can happen when and if the Nifty reaches channel top. There can be channel top breakout or there can be channel top resistance can come into effect and there can be consolidation and correction.
If there is a correction or consolidation the support levels for Nifty will be 23982, 23859 Important 50 hours EMA (Mother Lines support). If nifty closes below 50 EMA there will be weakness. This weakness can drag Nifty further down to 23679, 23297 or even 23173.(Mid channel Support).

Nifty Intraday (02-Jul-2024)An intraday trading chart for the Nifty 50 Index on July 2, 2024, captured in 15-minute intervals. Here's a detailed overview of the chart:
Candlestick Format: Utilizes candlestick bars to depict price action for each 15-minute period, indicating open, high, low, and close prices.
Exponential Moving Average (EMA): A blue line representing the 20-period EMA is visible, which helps traders identify the trend's direction and dynamic levels of support or resistance.
Trading Signals:
-Buy Signal: A green arrow points upwards, suggesting to buy if the Nifty exceeds 24,150, with an open target potentially reaching or surpassing 24,275.
-Sell Signal: A red arrow pointing downwards indicates a selling opportunity if the index falls below 24,075, with a target of 22,950.
Technical Analysis Overview: The chart illustrates the Nifty's price movements within a sideways to an upward trend, using the EMA line as a reference point for potential support or resistance levels. The annotations provide strategic entry and exit points based on specific price thresholds.
HDFC BANK _ Next Target is 1994 rupees (0.6 Fibonacci Extension)HDFC Bank is approaching its all-time high. If it Breakout above the resistance level, HDFC Bank could reach a New All-Time High, with the first target at 1994 rupees (0.6 Fibonacci extension level). The second target is 2385 rupees (100% Fibonacci extension). This is a Long-Term projection, so it is important to follow trend continuation techniques.
I want to help people to Make Profit all over the "World".

Triangle Breakout in MHRIL...Elliott Wave Analysis:-
Triangle correction taking place.
triangle breakout happened.
triangle retirement taking place.
Slight bearish is expected before a raise
We can accumulate bit by bit in every fall with stop loss of 369.20 .
I am not a SEBI registered advisor.Before taking a trade do your own analysis or consult a financial advisor.I share chart for education purpose only.I share my trade setup.

Nifty prediction #smcNifty have a chance of choch once near by demand break we can expect a chance of trend till that nifty is in uptrend only wait for a powerful choch

Nifty Next Week: (Short to Medium Term Market Outlook)Nifty is moving swiftly near the channel top. In the short term hourly chart RSI is 58.8 indicating that there might be some strength left in the current rally. However, it is delicately placed between strong resistance and weak supports which indicates correction also might be round the corner. Nifty supports are at 23976 and 23881 both are weak supports. 23777 is a moderate support of 50 hours EMA. (Mother line).
Strong support for Nifty is seen around the region of 23238 which has a dual support of Mid channel and 200 hours EMA. Immediate Resistances for Nifty are at 24130 (Moderate resistance) and there will be a strong resistance near 24322 (Channel top and trend top resistance. It is an interesting scenario where shadow of the candle is absolutely neutral. The dice can turn in any direction keep your stop losses in place. Market mood index indicating is another parameter to judge index and it's direction. Extreme Fear (<30), Fear (30-50), Greed (50-70), and Extreme Greed (>70). Right now the MMI index is at 71.28 indicating we have entered Extreme greed zone. So it is advised to Keep your trailing stop losses also in place.
The above information is provided for educational purpose, analysis and paper trading only. Please don't treat this as a buy or sell recommendation for the stock. We do not guarantee any success in highly volatile market or otherwise. Stock market investment is subject to market risks which include global and regional risks. We will not be responsible for any Profit or loss that may occur due to any financial decision taken based on any data provided in this message.

Nifty Short, Medium & Long Term view 1Jul-24 to Jul-24Nifty Short, Medium & Long Term view 1Jul-24 to Jul-24
Nifty closed at 23010 (23501) and touched low & high of 23351-24170
Post Election and govt formation market sustained above k5ey resistance at for two weeks after a dip to 21286.
RSI and stochastics levels was marginally down last week (68.5 % & 90% Respectively). Stochastic still in overbought levels.
Retain the statement for almost a month, Market need to cross 24150 as two trend line resistance ( Shown in the Chart), one with low risk can book partial profit and can wait for market to correct to reinvest. Market depends on the new budget and Q1 results expected in Jul 24. Market have high potential to touch Psychological 25000 Mark.
Nifty 24010- Short term (Neutral )
Nifty have resistance at 24280/ support around 22600. Nifty at PE 22.9 crossed 3 year historical average 22.5 hence to be cautious.
Short term support 22600( trendline), 22200 ( Trend Line) and 21700 Trend line Support as shown in the chart.
Medium term resistance 24280 ( Trendline and % of difference between Mar 23 low and Sep 23 high low from Sep23 high shown as vertical line)
medium term Support - 22000
Long Term
Nifty have strong resistance at 25000 ( Trend Line). If market close above 24150 decisively.
Support at 20800 ( Fib Support) 20225 / 20000 ( Fib Resistance),19500 expected in 2024.
Q3 results are average except bank & Nbfc stocks, further up move will have target of 23150 ( Trend Line), 23500 ( Fib Resistance).
All Companies so far posted average results other than Bank & Finance stocks which posted Good results thats why it is evident Nifty Bank have grown better than Nifty, Nifty IT and Nifty Auto in last 2 months.
Nifty bank 52342 (51661)- As proposed from 47250 level nifty bank jumped more than 10%. Caution to be emphasised as nifty bank reached critical resistance. It need to cross and move up decisively this current zone.
Slowly Can consider to book partial profits in Nifty Bank on every rise.
Investment decision in Nifty bank, bank stocks helped in portfolio.
Stock Picking is needed at this crucial nifty, Nifty Bank, Nifty auto, Nifty Pharma stocks.
As insisted for last 3 months Banks & Finanace Stocks are really good and will give good results, as expected Q4 results are good especially for Axis Bank ,ICICI Bank, HDFC Bank, SBI ( Buy on dip) and Indus Ind Bank ( Buy on dip).
Following Finance Stocks can be added as it posted good results are Manappuram Finance, suryoday small fin,Motilal Fin, Chola Finance, ICICI Securities. Other stocks like Dr Reddys, Natco Pharma, Cipla, JK Cements, Biocon, Coforge & persistent Sys can add these stocks to portfolio.
There is a possibility of dip to 21000-22000, hence please buy in parcels and every dip of Index and every dip of individual stocks (2-5% of portfolio on each purchase for long term)
The above stocks mentioned are based on analysis of top line & Bottom line performance, hence based on the risk and portfolio mix one can add after analysis.
Comments :
Post Elections, if Market need to grow higher by reduction of interest rate by RBI on a staggered manner till it reaches 5% ( in span of 2-3 years ). US fed rate reduction also expected from Aug/ Sep 2024. Market may correct if any global news till 19500 as there is strong multiple fib support in this range.
Nifty IT 36157 (35086), indices broke the Major support at 33350 and went down upto 32420. Tech stocks revived in last two trading session. Nifty IT Stocks like TCS, Infosys, Wipro gave muted results in Q4 2024. Can be added for short rally as it fell sharply, however strictly for long term and also in portions slowly on each fall ( say 5-10% of total investment in IT stocks). Whenever there is such dips and new lows ( in the last 1 year) We can add slowly considering 2-3 years. It need to break above 35786 ( Fib) to reach 38000 needed to further move up. Future of technology stocks are in high pressure due to AI as it is reflecting in US and Indian technology stocks.

Nifty Short to Medium term outlookNifty is moving swiftly near the channel top. In the short term hourly chart RSI is 58.8 indicating that there might be some strength left in the current rally. However it is delicately placed between strong resistance and weak supports which indicates correction also might be round the corner. Nifty supports are at 23976 and 23881 both are weak supports. 23777 is a moderate support of 50 hours EMA. (Mother line). Strong support for Nifty is seen around the region of 23238 which has a dual support of Mid channel and 200 hours EMA. Immediate Resistances for Nifty are at 24130 (Moderate resistance) and there will be a strong resistance near 24322 (Channel top and trend top resistance. It is an interesting scenario where shadow of the candle is absolutely neutral. The dice can turn in any direction keep your stop losses in place. Market mood index indicating is another parameter to judge index and it's direction. Extreme Fear (<30), Fear (30-50), Greed (50-70), and Extreme Greed (>70). Right now the MMI index is at 71.28 indicating we have entered Extreme greed zone. So it is advised to Keep your trailing stop losses also in place.

Long Term Analysis of Nifty my observations and a conclusion.The chart above is the chart of Nifty 50 since 1991. This chart here tells a few stories. I will tell you my version of these stories or observations you can derive your own conclusions from them:
1) India is a continuous bull market. There are blips due to Micro and Macro reasons but the chart keeps moving forward in the parallel channel. We are in the upper half of the channel since 2005 indicative of an economy that is moving forward and GDP that is continuously growing. There are couple of times when the market went into the lower half of the channel once was during the 2008 Sub-prime crisis and once during the COVID19 global crisis. Lot of countries of the world have still not come out of the trauma but we bounce back each time. This tells us about strength of our nation and our economy.
2) There is lot more room to grow before we hit the channel top resistance. Even in case of some major political event or market correction. We can get the mid channel support and the support of Mother line 50 Months EMA.
3) Relative Strength index is a lagging indicator used by a lot of analyst to check if the market is overbought or oversold. As per my observation over the years. We start to enter the overbought territory once the index is above 70. RSI above 80 is indicative of a market that is overbought. Similarly when the RSI levels are below 30 we enter the oversold territory and When RSI is below 20 we are in the highly oversold territory. Now if you look at the chart carefully each time monthly RSI of Nifty has gone near / above / substantially above 80 levels there has been a correction in the market. Some corrections have been large some not so substantial but inevitably market has corrected. Right now RSI of Nifty is 78.94. The levels to watch out for reversal / Consolidation / correction in my opinion can be anywhere between 79.88 and 91.35. I am not trying to scare you or predict a doomsday scenario, I am just presenting historic data in front of you.
4) Market can remain irrational for period of time beyond human comprehension. Market can remain irrational more than an investor can remain rational. So while we ride the upwave changing sectors and changing our stories and choices shuffling between small and mid and large caps do not forget to put in your stop losses and trailing stop losses. Stop losses are our friends that protect our capital and trailing stop losses are our friends that protect our profits. While we use them it can happen that a stock takes your trailing stop loss and again bounces back to huge upside but it is fine, either we learn or we win. If you have the capital you can invest again. If you will not have the capital it is an irreversible loss.
Conclusion: Stay Positive but be cautious. Use stop losses with discipline and trailing stop losses generously. The chart shows that history repeats. The chart shows that India is a continuous bull market. The chart shows that long term investor will always win if he has discipline and follows a process in stock selection, profit booking and staying vigilant.
