U-formation on cards if resistance at 22632 is cleared by Nifty.It looks like Nifty can create a U formation if the resistances at 22632 is cleared and we get a proper closing above it. However for perfect U-formation the Nifty will have to cross other resistances at 22693, 22734, 22768 and finally 22794. In case we do not get a closing above 22632 and Nifty returns the supports for Nifty will be at 22536, 22484 and 22445. Below 22445 there are important support levels of 50 and 200 EMA which are 22409 and 22345. Below 22345 Nifty becomes very weak and Bears take over the market. Shadow of the candle is neutral to positive for tomorrow.
Nifty50

NIFTY INTRADAY LEVELS FOR 23/05/2024BUY ABOVE - 22640
SL - 22590
TARGETS - 22710,22780,22830
SELL BELOW - 22550
SL - 22590
TARGETS - 22500,22440,22350
NO TRADE ZONE - 22550 to 22640
Previous Day High - 22640
Previous Day Low - 22500
Based on price action major support & resistance's are here, the red lines acts as resistances, the green lines acts as supports. If the price breaks the support/resistance, it will move to the next support/resistance line. White lines indicates previous day high & low, high acts as a resistance & low acts as a support for next day.
Trendlines are also significant to price action. If the price is above/below the trendlines, can expect an UP/DOWN with aggressive move.
Please NOTE: this levels are for intraday trading only.
Disclaimer - All information on this page is for educational purposes only,
we are not SEBI Registered, Please consult a SEBI registered financial advisor for your financial matters before investing And taking any decision. We are not responsible for any profit/loss you made.
Request your support and engagement by liking and commenting & follow to provide encouragement
HAPPY TRADING 👍

Nifty returning from 22591 indicates strong resistance zone.Nifty returning from high of 22591 has given indication of strong resistance zone ahead. Also closing above Mid-Channel resistance was a good move but still it is not a convincing upward gallop with market breadth remaining negative and FII still selling relentlessly. Some decent mid and large cap stocks are not moving despite good results and some average stocks and PSU are moving towards exaggerated valuation. PE investing or comparing the 10 year PE to the current PE of the stock should be the way to go for investors. Do not get trapped at levels which might not return for years. (I am nor fear mongering but that should be the case in every and any circumstance anyway.)
Nifty Supports levels: 22470, 22402, 22345, 22257 and 22055.
Nifty Resistance levels: 22530, 22591, 22658, 22730 and 22831.

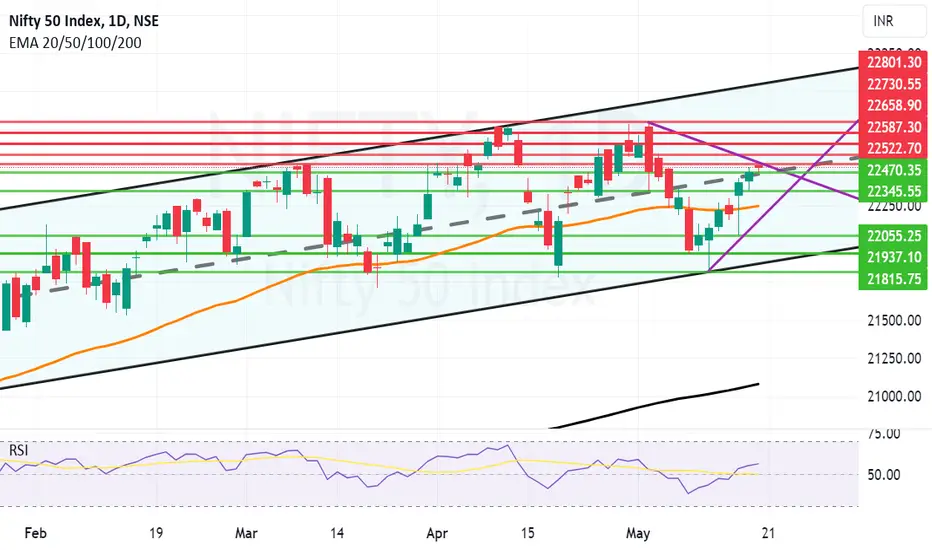
Good move ahead if mid channel support is held by NiftyGood move ahead for Nifty can hold the levels of 22470 and give a closing above 22522. Incase we get a closing above 22522 the resistances ahead will be 22587, 22658, 22730 and 22800+. In case Nifty gives a closing below 22470 the supports will be at 22345, 22246 and 22055. 22522 is however a strong trendline resistance and gap up opening and holding above it is the way to overcome it faster. Shadow of the candle is positive for the beginning of the week.
NIFTY INTRADAY LEVELS FOR 21 MAY 2024BUY ABOVE - 22500
SL - 22430
TARGETS - 22550,22600,22640
SELL BELOW - 22430
SL - 22500
TARGETS - 22350,22300,22230
NO TRADE ZONE - 22430 to 22500
Previous Day High - 22500
Previous Day Low - 22350
Based on price action major support & resistance's are here, the red lines acts as resistances, the green lines acts as supports. If the price breaks the support/resistance, it will move to the next support/resistance line. White lines indicates previous day high & low, high acts as a resistance & low acts as a support for next day.
Trendlines are also significant to price action. If the price is above/below the trendlines, can expect an UP/DOWN with aggressive move.
Please NOTE: this levels are for intraday trading only.
Disclaimer - All information on this page is for educational purposes only,
we are not SEBI Registered, Please consult a SEBI registered financial advisor for your financial matters before investing And taking any decision. We are not responsible for any profit/loss you made.
Request your support and engagement by liking and commenting & follow to provide encouragement
HAPPY TRADING 👍

JK Lakshmi Cements: It could break either way. Be prepared.Key Zones
Supply Zone (Resistance) represented by the Red Box.
The price has shown a clear rejection in this zone multiple times, indicating strong selling pressure.
Demand Zone (Support) represented by the Green Box.
Historically, this zone has acted as a strong support, suggesting buying interest in this area.
Patterns and Trendlines
RSI (Relative Strength Index): Current RSI is around 40.73, suggesting the stock is approaching the oversold territory, but not quite there yet.
Key Levels to Watch
Resistance: 875 - 900 INR (Supply Zone)
Support: 675 - 725 INR (Demand Zone)
Intermediate Support: 723.10 INR
Possible Scenarios
Bullish Scenario:
If the price breaks above the descending triangle's upper trendline, it could challenge the supply zone around 875-900 INR.
Confirmation would require a strong breakout with high volume.
Bearish Scenario:
A breakdown below the descending triangle’s lower trendline and the support at 775 INR could lead to a drop towards the demand zone around 675-725 INR.
The gap fill mentioned in the chart could be a target area in the event of a breakdown.
Conclusion
The chart shows JK Lakshmi Cement at a crucial juncture within a descending triangle pattern.
Watch for a breakout above the triangle for a bullish move towards the supply zone.
Alternatively, a breakdown below the current support could lead to further downside, targeting the demand zone and potential gap fill area.
Monitoring volume and RSI will be key in confirming any breakout or breakdown.
Overall, traders should keep an eye on these critical levels and patterns to make informed decisions.
DISCLAIMER: EDUCATION PURPOSES ONLY. NOT FINANCIAL ADVICE.

Technical Analysis: NIFTY 50's Recent Shifts and Future ProspectHello, TradingView community! Today, we're diving into a detailed technical analysis of the NSE:NIFTY index, which has shown some interesting movements lately. We'll break down the technical signals, look at the potential implications, and discuss what to watch out for in the coming days.
🔍 Overview of Recent Trends
The NIFTY 50 has been following a well-defined upward trend channel over the past several months, making consistent gains each time it hit the upper boundary. However, recent patterns suggest a change in dynamics, which we need to scrutinize closely.
🔁 Current Technical Setup
Most notably, the NIFTY 50 recently deviated from its usual pattern by not reaching the upper boundary of the trend channel before reversing its direction towards the lower boundary. This could be an early sign of weakening bullish momentum.
📉 Significance of the Double Top Pattern
The formation of a potential Double top, a classic bearish reversal indicator, adds weight to concerns about a bearish shift. While this pattern is not yet confirmed—since we haven't seen a definitive breakdown below the neckline—it's a development that warrants attention.
📊 Intersection with the 100-day SMA
The recent drop of -1.5% in the NIFTY 50 brought it down to the lower boundary of the trend channel, which coincidentally aligns with the 100-day Simple Moving Average (SMA). This SMA has historically served as a strong support level, often triggering rebounds.
🔄 Potential Outcomes
Bounce Back: If the 100-day SMA and the lower boundary of the trend channel hold up, there's potential for the NIFTY 50 to rebound towards the mid or upper boundary of the channel.
Bearish Reversal: A decisive close below the 100-day SMA & Neckline of Double Top could indicate a more significant Bearish Trend or the start of a consolidation phase.
🌐 Broader Market Context
Quarterly Earnings: The index is feeling the pressure from non-impressive Q4 results for 2024. Lackluster corporate earnings can dampen investor sentiment and lead to a reevaluation of stock valuations.
Volatility Index Rise: The NSE:INDIAVIX , which measures market volatility, is on the rise. This indicates increased uncertainty among investors, as they price in a higher potential for market swings.
FII Activity: There has been significant selling by foreign institutional investors (FIIs), contributing to downward pressure on the index. FII flows are crucial as they represent substantial investment volumes and can influence market direction.
US Federal Reserve's Stance: The hawkish stance of the US Federal Reserve, signaling potential interest rate hikes, is also a critical factor. Higher US interest rates can lead to capital outflows from emerging markets like India as investors seek higher returns in US assets.
These points illustrate how external factors are intricately linked with the movements of the NIFTY 50 index and should be considered when analyzing its future direction.
📈 Trading Strategy Recommendations
For those actively monitoring the NIFTY 50, it's crucial to keep a close eye on the 100-day SMA and the lower trend line of uptrend channel. These areas serve as critical junctures that could determine the market's short-term direction.
"In the world of Market, it's not about how much you know, but how well you understand what you know and how you apply it in uncertain times."
To conclude, while the NIFTY 50 presents an intriguing technical setup, traders should proceed with caution given the current uncertainties and the index's recent behavior.
This analysis is intended to enhance understanding and encourage informed decision-making. Keep watching these indicators and adapt your strategies accordingly to navigate through these potentially choppy waters.
Lastly, thank you for your support, your likes, Follows & comments. Feel free to ask if you have any questions.

Good closing by Nifty just above mid-channel resistance. Nifty saw a good closing today above mid channel resistance but could not hold on to higher levels as it found the resistance at 22502 to hot to cross. 22502 was today's high and might act as a resistance again tomorrow. If this level is crossed and we get a closing above it the next resistance levels will be at 22587 and 22658. Above 22658 bull have potential to take full control of the market and in such a scenario we can see Nifty climbing to the highs of 22730 and 22801 in the coming week or weeks. On the lower side, today's low of 22345 is a good support followed by Mother line support of 50 Hours EMA at 22235. Below 22235 Nifty becomes week and we might again see the levels of 22055, 21937 and 21815. Below 21815 closing Bears take total control of the market. Nifty is interestingly placed with shadow of the candle being neutral and it was a Doji candle that we saw today emphasizing the tussle between bulls and bears or shall we call it a tussle between FIIs and DIIs + Retail investors?

Remarkable Comeback Nifty but now faces Mid-channel resistance.Nifty recovered handsomely 349.85 points from the low of the day in the last hour against all frantic FII selling. This shows the power of DII and retail investors. Now Nifty faces a tough mid channel resistance 22438 which will take some doing to cross it. If Nifty manages to cross 22438 the next resistances will be at 22496, 22587, 22658, 22730 and 22801. If Nifty is not able to cross the Mid channel resistance the supports will be at 22298, 22215 and 22054. Nifty will be very weak below 22054. Shadow of the candle is looking neutral to negative but if FII jump into action (which unlikely) then frantic upside is possible. Volatility and peak tussle between FII and DII might continue.

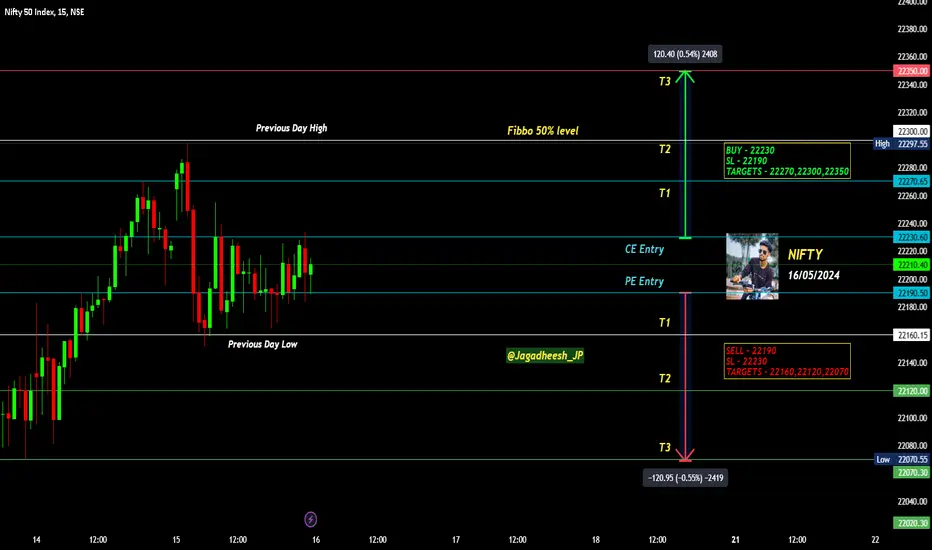
NIFTY INTRADAY LEVELS FOR 16 MAY 2024BUY ABOVE - 22230
SL - 22190
TARGETS - 22270,22300,22350
SELL BELOW - 22190
SL - 22230
TARGETS - 22160,22120,22070
NO TRADE ZONE - 22190 to 22230
Previous Day High - 22300
Previous Day Low - 22160
Based on price action major support & resistance's are here, the red lines acts as resistances, the green lines acts as supports. If the price breaks the support/resistance, it will move to the next support/resistance line. White lines indicates previous day high & low, high acts as a resistance & low acts as a support for next day.
Trendlines are also significant to price action. If the price is above/below the trendlines, can expect an UP/DOWN with aggressive move.
Please NOTE: this levels are for intraday trading only.
Disclaimer - All information on this page is for educational purposes only,
we are not SEBI Registered, Please consult a SEBI registered financial advisor for your financial matters before investing And taking any decision. We are not responsible for any profit/loss you made.
Request your support and engagement by liking and commenting & follow to provide encouragement
HAPPY TRADING 👍

Nifty Squeezing in tight space between supports and resistances.Nifty is squeezing in a tight space squeezing between major supports and resistances. A major move on either side can not be negated. With US inflation, Lok Sabha election phases, Announcements by FM about course correction discussion with SEBI on how F&O will operate in future, and other important data awaited, mixed bag results. Today 200 Hours EMA acted as a major resistance. Nifty barely touched it and returned closing fractionally below 50 hours EMA. Trend line resistance and support are also acting not allowing Nifty to move much in either directions. FII is selling on every rise. DII is buying on every dip.
Very interesting phase which is testing the patience of investors is going on. All we need to do is watch important levels, important results and important data. Holding on to what we have high conviction in and letting go of what is not convincing valuation wise is important. Not reacting to market noise and filtering out your portfolio is important, before the next bull run begins. If it has not already begun.
Important Resistance Levels: 22242, 22302 (200 Hours EMA) Father line, 22400 mid channel resistance and 22501.
Important Support levels: 22148, 22068, 21937 and 21815 (Nifty becomes very weak and goes into bear grip below this level.)

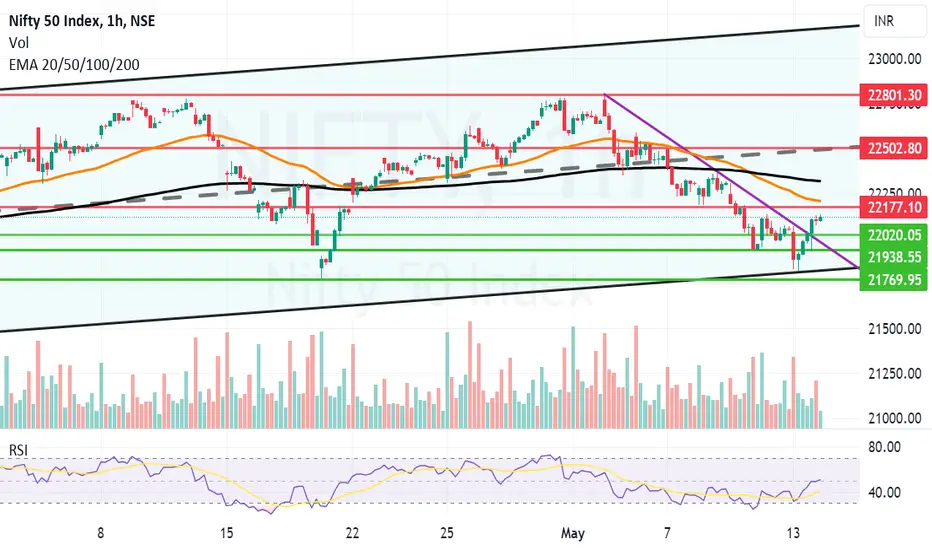
Good Closing For Nifty but major resistance ahead. Nifty closed very well above 50 hours EMA (Mother Line) but is facing a formidable resistance of 22273 and 22309. The best thing to happen can be if Nifty opens gap up above this resistance and sustains the level. In such a scenario the next resistance it will face will be at 22374. Crossing and closing above 22374 will bring back bulls firmly in the business and they can push the nifty towards 22501, 22598 or even 22695. In case the resistance of 22273 and 22309 are not crossed by Nifty successfully the supports for Nifty will be at 22205, 22096, 22020 and finally 21937. Below 21937 Nifty has only one support of channel bottom at 21815. closing below 21815 can empower the bears to run havoc but shadow of the candle looks positive right now.

NIFTY50 INDEX BREAKOUT CONFIRMED, WHAT'S NEXT?The NIFTY50 has indeed followed the projection I made last week, confirming the breakout on the channel we identified. Now, I anticipate a continuation of the bearish trend towards the lower support level. This retracement should provide a significant pullback from the current bullish momentum observed on the hourly timeframe.

Nifty received some support from bottom and the Home Minister. Nifty today received some support from the bottom and some support from the interview of home Minister where he was seen very confident about forming a stable government as well as talking about investments in the share markets and how things will be in case they win (Which he was confident about. Nifty took support near 21821 and broke a negative trend line and gave a closing above it at 22104 as seen in the chart. However formidable resistances at 22177, 22207 and 22317 remain to be conquered. Bulls can breath easy only above this level. Also FIIs might further sell at every bounce. Unless FII and DII both are buying volatility will remain at the forefront. Supports for Nifty at lower levels are at 22020, 21938 and 21769. Below 21769 bears can create further mayhem.
NIFTY 50Nifty 50 is currently trading at a major support area. Here are some support and resistance levels if you are interested in trading Nifty 50.

Nifty Finnifty bank Nifty Tuesday 14 May 2024 Nifty Finnifty bank Nifty Tuesday 14 May 2024
the trend in nifty is sideways to negative but if price is going to trade above 22400 more power to the Nifty will come and short term trend is going to change . Nifty showed recovery from important train line in past where price has taken demand or support many times and same thing happened today with a bullish engulfing candlestick pattern
for Bank Nifty and free Nifty both indices how taken good and ample amount of support from rising train line with a good double candlestick bullish signal indicating and if the price is going to sustain above today's low for prudence a solid up move is to be getting expected
this post is for educational purpose trading recommendation or NO trading advice

Trend change from not bearish to bearish in Nifty?I was not bearish in Nifty until Friday but the market has not failed to surprise me yet again.
Important support (100 SMA) at 22000 was broken with conviction and India VIX is flying through the roof. These both points make me rethink my bullish thoughts I had and now I would either stay away from the market or wait for the right levels and sell on the rise but better option is to stay away from the market for a while and let the dust settle.
#Educational purpose only

NIFTY INTRADAY LEVELS FOR 13/05/2024BUY ABOVE - 22070
SL - 22020
TARGETS - 22120,22180,22240
SELL BELOW - 22020
SL - 22070
TARGETS - 21960,21900,21850
NO TRADE ZONE - 22020 to 22070
Previous Day High - 22120
Previous Day Low - 21960
Based on price action major support & resistance's are here, the red lines acts as resistances, the green lines acts as supports. If the price breaks the support/resistance, it will move to the next support/resistance line. White lines indicates previous day high & low, high acts as a resistance & low acts as a support for next day.
Trendlines are also significant to price action. If the price is above/below the trendlines, can expect an UP/DOWN with aggressive move.
Please NOTE: this levels are for intraday trading only.
Disclaimer - All information on this page is for educational purposes only,
we are not SEBI Registered, Please consult a SEBI registered financial advisor for your financial matters before investing And taking any decision. We are not responsible for any profit/loss you made.
Request your support and engagement by liking and commenting & follow to provide encouragement
HAPPY TRADING 👍

Nifty trying to bounce after bottom formation. Nifty is trying to bounce after bottom formation. The bull rally can commence and the bounce can sustain only if the level of 21938 is held and we get a closing above 22070. In the case of up move after 22070 is crossed and held the resistances for future will be 22129 and 22188. Post closing above 22188 50 and 200 Hours EMA (Mother and Father line) 22236 and 22339 will be the next major resistance levels. Bulls can breath easily only after we get a closing above 22339. In this case the future target will be 22502. In case we get a closing below 21938 in the coming week the next support level will be at 21769. (Right now charts do not suggest that we can get a closing in Nifty below this point but in case we get a closing below 21769, bears will play major havoc and can drag Nifty even to sub 21K levels.) However this does not look probable right now as shadow of the candles look positive (Green) but you can never say never. Bulls have potential to fight back above 22070 levels and specially can take centre stage if we get a closing later this week or the next above 22339.

Can Channel Bottom Support save Nifty?As you can see Nifty is resting very timidly at the bottom of the channel after confirmation of H&S Break down. Most of the indices were thrashed like bowlers are thrashed in IPL matches this season. If Nifty has to recover it has to be done in next couple of sessions that is Friday or Monday. If the current support around 21900 is broken the next supports are only at 21769, 21543 and finally 20991. Below these levels more pain will be there in the system and Bears will become even more powerful. Resistances on the upper side now are at 22096, 22231 (Mother Line Support) (50 EMA), 22311 and 22502. Shadow of the candle is looking negative but bears will try to give a fight for sure if not tomorrow very soon.

SENSEX and Bank Nifty Setups Friday 10 may 2024 SENSEX and Bank Nifty Setups Friday 10 may 2024 The trend in Indian markets are going in the downtrend but as of now Nifty especially Sensex near there rising channel higher low area values zone. seems Friday may 10th 2024 levels in Sensex and Nifty 50 would be challenging because Indian bricks is rising and if some cool of is going to happen in tomorrow's early 2 hours of training session of Friday then possibly a small nude short covering rally will be available in both of indices
Nifty Bank is much away from its rising train line at support or demand line
and the final area where smart buyers are pending orders placed are waiting to be getting executed the zone of 47000 46600
these are level to watch on Friday session

Nifty 50 within the Channel. Trend Analysis for short term TradeNifty 50 is currently trading within a Channel. This analysis suggests a short-term or swing trade approach. As the market is currently trending downward, consider using Trend Continuation technic and Fibonacci Retracement for your trading strategy.
