NIFTY INTRADAY LEVELS FOR 09/05/2024BUY ABOVE - 22350
SL - 22300
TARGETS - 22420,22470,22510
SELL BELOW - 22240
SL - 22300
TARGETS - 22200,22160,22100
NO TRADE ZONE - 22240 to 22350
Previous Day High - 22350
Previous Day Low - 22200
Based on price action major support & resistance's are here, the red lines acts as resistances, the green lines acts as supports. If the price breaks the support/resistance, it will move to the next support/resistance line. White lines indicates previous day high & low, high acts as a resistance & low acts as a support for next day.
Trendlines are also significant to price action. If the price is above/below the trendlines, can expect an UP/DOWN with aggressive move.
Please NOTE: this levels are for intraday trading only.
Disclaimer - All information on this page is for educational purposes only,
we are not SEBI Registered, Please consult a SEBI registered financial advisor for your financial matters before investing And taking any decision. We are not responsible for any profit/loss you made.
Request your support and engagement by liking and commenting & follow to provide encouragement
HAPPY TRADING 👍
Nifty50

NIFTY50 POTENTIAL BREAKOUT ON THE STRUCTURENIFTY50 is currently within a robust bullish channel, displaying consistent growth since the emergence of bullish sentiment. Price has adhered to the previous high established on the daily timeframe. We anticipate potential price action to remain within the upper and lower boundaries for a period. Upon future confirmation of a breakout at the lower boundary, a bearish trend with significant momentum could be witnessed.

HUL: Long position mid term (35% returns)HUL has give a strong breakout today (with heavy volume) against its trendline (blue). The price has been in a downtrend since July 2023 forming a rounding bottom pattern with neckline at 2700 and bottom at 2200. The target based on the pattern is 3200 (Upside of 35%) .
Fundamentally, the company is strong and has grown consistently. The P/E valuation and EV/EBITDA are at multiyear low. The stock has been under time correction mode for the last 3 years. The inflation is expected to come down in the coming quarters which will help revive the sales and boost the earnings going forward. The rural demand has picked up as well. All the drivers should set the stock rallying to new ATHs.
Targets:
1) 2450-2500 (range)
2) 2650-2700 (range)
3) 3200
Risks: Given the Nifty has been under selling pressure, there's a risk of this breakout to not push all the way to the targets creating another round of sideways price action.

Even after the dramatic fall on Friday Nifty looking strong.Even after the fall due to Profit booking and fear in investors due to Fed rate pause Nifty is not looking weak. Seemingly it has taken 200 Hours EMA support in late trading hours of Friday at 22388 after falling below it just for a while. If 22388 is not broken in the coming week the targets/resistances on the upper side will be at 22535 (Major resistance) (best way to avoid it will be to open gap up above it.), 22691, 22799, 22873, 22973 and 23039. Channel top seems to be around 23155. If the support at 22388 is broken and we get a closing below it, the supports will be at 22348, 22186 and finally channel bottom support near 21962 (in very unlikely event). The shadow of the candles is positive right now but there will be profit booking effort at every rise. Bears will try to fight the bulls who were taken by surprise by the bear attack on Friday.

Nifty Intraday Levels: 07-May-24Price created X pattern , @Resistance so wait for rejection in lower timeframe for Entry
Bullish > 22500
Bearish < 22350

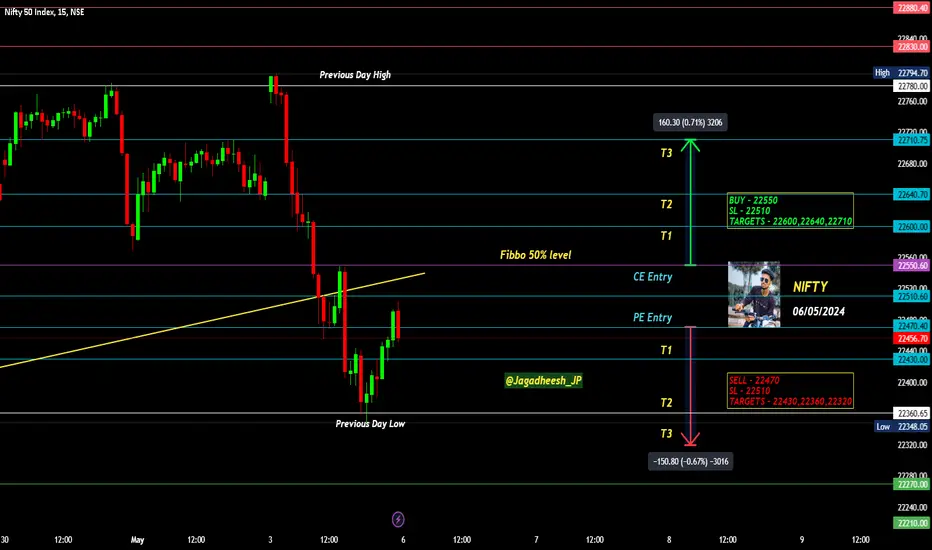
NIFTY INTRADAY LEVELS FOR 06/05/2024BUY ABOVE - 22550
SL - 22510
TARGETS - 22600,22640,22710
SELL BELOW - 22470
SL - 22510
TARGETS - 22430,22360,22320
NO TRADE ZONE - 22470 to 22550
Previous Day High - 22780
Previous Day Low - 22360
Based on price action major support & resistance's are here, the red lines acts as resistances, the green lines acts as supports. If the price breaks the support/resistance, it will move to the next support/resistance line. White lines indicates previous day high & low, high acts as a resistance & low acts as a support for next day.
Trendlines are also significant to price action. If the price is above/below the trendlines, can expect an UP/DOWN with aggressive move.
Please NOTE: this levels are for intraday trading only.
Disclaimer - All information on this page is for educational purposes only,
we are not SEBI Registered, Please consult a SEBI registered financial advisor for your financial matters before investing And taking any decision. We are not responsible for any profit/loss you made.
Request your support and engagement by liking and commenting & follow to provide encouragement
HAPPY TRADING 👍
Nifty50 Options Trading Plan: 3rd May to 9th MayGreetings traders,
I'm excited to share my trading plan for the Nifty50 options from 3rd May to 9th May. Let's dive into the analysis and potential scenarios.
Bullish Outlook:
Firstly, I hold a bullish sentiment for the Nifty50 9th May expiration option contract. Based on my analysis, I foresee two possible scenarios unfolding during this period.
Scenario 1: Dip Buying Opportunity
In the first scenario, I anticipate that Nifty may experience a temporary dip, possibly down to the levels of 22500/22400. This presents an excellent opportunity to buy call options at a discounted price, setting the stage for potential gains.
Scenario 2: Rally Commences
Alternatively, Nifty could kickstart a rally from tomorrow onwards, with targets set around 23000/23100. This scenario would signify a strong upward momentum, offering profitable opportunities for traders.
Trading Strategy:
Now, let's delve into the specifics of my trading strategy based on these scenarios.
Scenario 1 Unfolds:
If Nifty dips as anticipated, I have set a target range of 22800/22900. In this scenario, I plan to buy the 22650 call option at or below 60.80, considering its current price at 182.00. My target exit range for this trade is set at 200/210, adopting a "hero zero" mode strategy to maximize potential gains.
Scenario 2 Execution:
Should Nifty initiate a rally towards 23000/23100, I will adjust my strategy accordingly to capitalize on the upward momentum and potential price movements.
Conclusion:
With a bullish outlook and a well-defined trading plan for both scenarios, I am prepared to navigate the Nifty50 options market from 3rd May to 9th May. Remember, trading involves risk, so always implement risk management strategies and stay updated with market developments.
Happy trading and may the markets be in your favor!

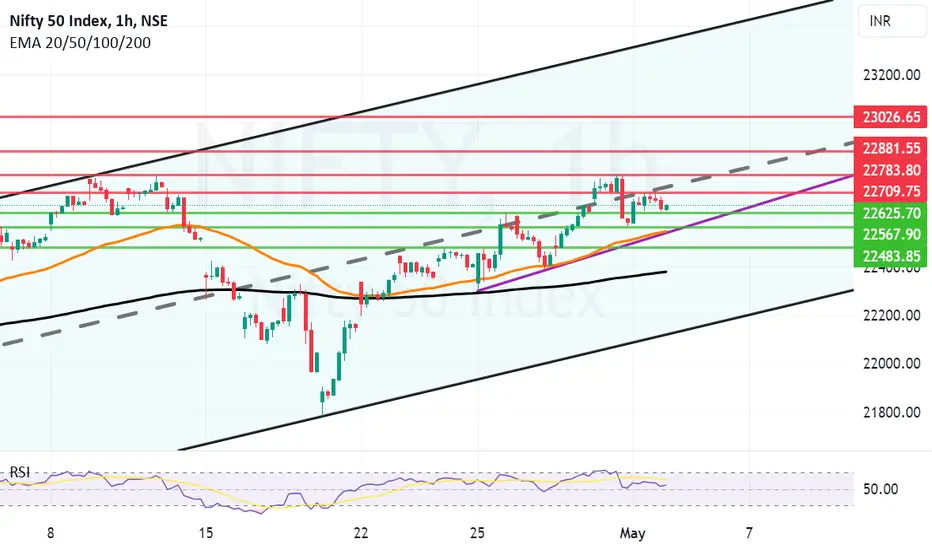
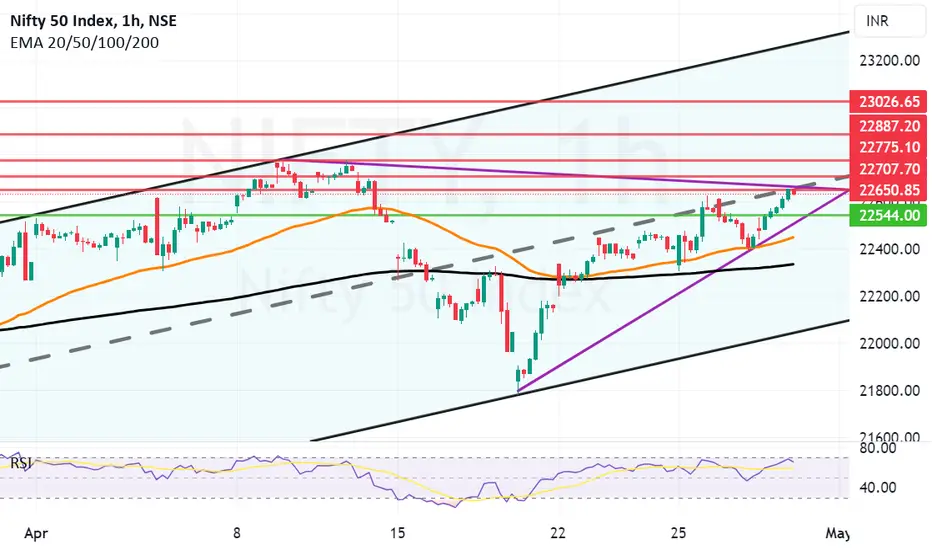
Strong higher high higher Low pattern on Hourly chart. Positive.Nifty is making a higher high, higher low, pattern on Nifty. Which looks very promising and positive. For going further and higher and into unchartered territory Nifty needs to hold 22625 or at least 22547. These two points will work as great supports too. Below 22547 the next supports will be near 22483 and 22379. On the upper side the resistance levels seem to be at 22709, 22881, 22967 and finally 23026. Shadow of the candle looks positive.
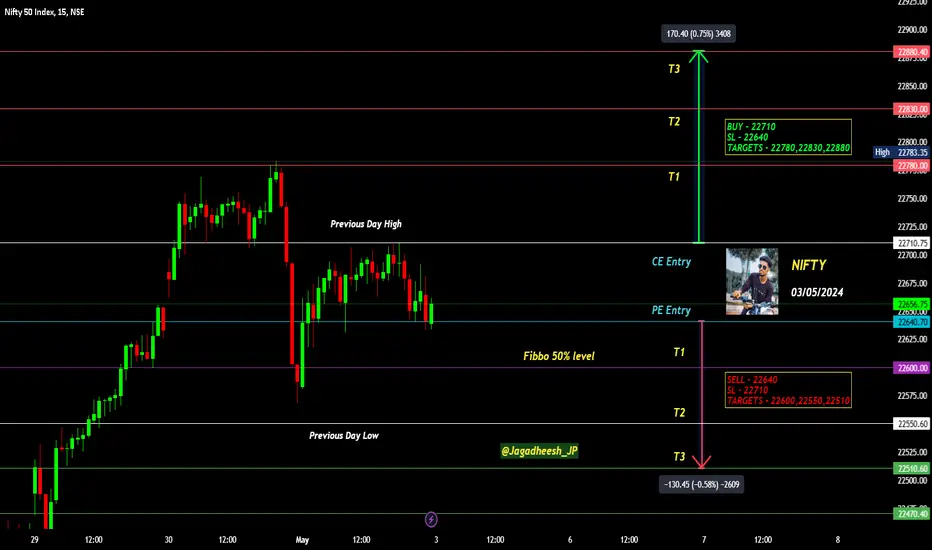
NIFTY INTRADAY LEVELS FOR 03/05/2024BUY ABOVE - 22710
SL - 22640
TARGETS - 22780,22830,22880
SELL BELOW - 22640
SL - 22710
TARGETS - 22600,22550,22510
NO TRADE ZONE - 22640 to 22710
Previous Day High - 22710
Previous Day Low - 22550
Based on price action major support & resistance's are here, the red lines acts as resistances, the green lines acts as supports. If the price breaks the support/resistance, it will move to the next support/resistance line. White lines indicates previous day high & low, high acts as a resistance & low acts as a support for next day.
Trendlines are also significant to price action. If the price is above/below the trendlines, can expect an UP/DOWN with aggressive move.
Please NOTE: this levels are for intraday trading only.
Disclaimer - All information on this page is for educational purposes only,
we are not SEBI Registered, Please consult a SEBI registered financial advisor for your financial matters before investing And taking any decision. We are not responsible for any profit/loss you made.
Request your support and engagement by liking and commenting & follow to provide encouragement
HAPPY TRADING 👍
Analyzing Nifty50 Spot's Triangle Pattern Breakout Trade PlanGreetings fellow traders,
I've been closely monitoring the Nifty50 spot since April 25th and have observed a range-bound movement, forming what appears to be a triangle pattern. I anticipate a breakout from this pattern tomorrow, which could lead to significant moves in the market.
My trade plan revolves around this potential breakout. If Nifty50 breaks out tomorrow, my targets are set at T1 (22727.80) and T2 (22895.40) . However, for the breakout to sustain above T1, my proprietary option pricing calculations indicate that the 22550 put option (2nd May expiration) should trade below 10.15 (today's closing price was 57.35).
Therefore, I'm planning to buy the 22550 put option above T1, with a stop loss set at 10.10 to manage risk effectively.
Let's stay tuned and execute this trade plan strategically.

NIFTY50 BULLISH CHANNELNIFTY is playing inside a strong bullish channel where we witness a steady growth ever since the bullish sentiment. Price respected the previous high created on the daily timeframe. Where we might see some price action intact with the upper and lower boundaries for sometime. With a future breakout confirmation on the lower boundary, we may witness a bearish trend with a nice bearish momentum.

NIFTY stuck in channelNSE:NIFTY at its all-time high is consolidating in a channel pattern between 22000 and 23000.
Good time to accumulate value stocks to reap benefits if nifty breaks upwards.
Also reserve to pump in capital if nifty breaks downwards.
Key note : Always follow proper risk management to avoid losing capital from false breakouts as this is common.
Caution : This is a knowledge sharing analysis, not a call.
Profits are not made from following ideas, but by following Risk Management.

Resistance zone between 22783 and 22755 comes into effect.After making a new high of 22783 there was a bought of Profit booking seen in Nifty. Two important international events of US FED Interest decision and CPI Inflation data are awaited so traders may have thought of being cautious at this juncture. Further bullishness leading to 22800, 22887 and 23026 is also a possibility but for that overcoming this important resistance zone is imperative. Supports for Nifty on the lower side in case of consolidation or further profit booking will be 22544, 22508 and 22358. If 22358 is broken we may see bullish grip weaken a bit and in this scenario bears can drag the Nifty further down to 22200 or even levels below 22000. The zone between 22544 and 22508 is an important support zone for Nifty now.
NIFTY Wait for a 1D MA50 pull-back and buy.The Nifty 50 Index (NIFTY) has been trading within a Channel Up since late December 2023 and today it hit the April 10 2024 High. That was a Higher High for the Channel Up and the price immediately got rejected.
Based on the 1D RSI, it may rise some more to its Resistance Zone before getting rejected but this sequence is very similar with the February 02 2024 rejection. Both fractals made clear technical Higher Lows at the bottom of the Channel Up and the February one after the rejection, pulled back to the 1D MA50 (blue trend-line) before finding Support and new buyers.
As a result, we are only willing to turn bullish again on the 1D MA50 and then target the Channel's standard target of the 1.382 Fib extension at 23100.
-------------------------------------------------------------------------------
** Please LIKE 👍, FOLLOW ✅, SHARE 🙌 and COMMENT ✍ if you enjoy this idea! Also share your ideas and charts in the comments section below! This is best way to keep it relevant, support us, keep the content here free and allow the idea to reach as many people as possible. **
-------------------------------------------------------------------------------
💸💸💸💸💸💸
👇 👇 👇 👇 👇 👇

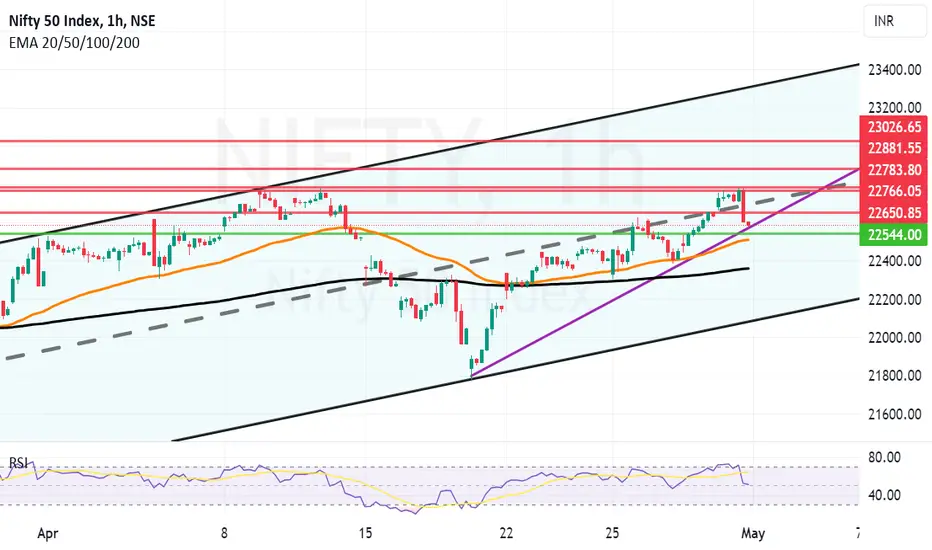
Nifty on the verge of a major breakoutIf Nifty manages to close above 22650 it will successfully cross the double resistance of a trend line and mid channel resistance. The next targets for Nifty in this case will be 22707, 22775.(Major All time resistance.) If this is also crossed successfully we may see new all time highs of 22887 or 23026 and more. Supports for Nifty are at 22544, 22448 and finally 22334. Below 22334 Nifty becomes little weak.
TCS BrakeoutWe can see that the TCS was in down Trent. It formed with higher high with higher low formation and now it braked to the last higher high. There is a chance to change this trend in to the up Trent. You can keep eye on this stock. Its for the medium or long term investment. Its a fundamentally strong IT stock. You can keep SL also that will help you to get this stock at best rate.

Anticipating Short-Covering: Nifty50 Spot Recovery StrategyI anticipate a short-covering rally in the Nifty50 spot, expecting a recovery as long as the spot doesn't dip below 22323.60. I've taken a long position below 22442.20, with a strict stop loss set at 22323.60.

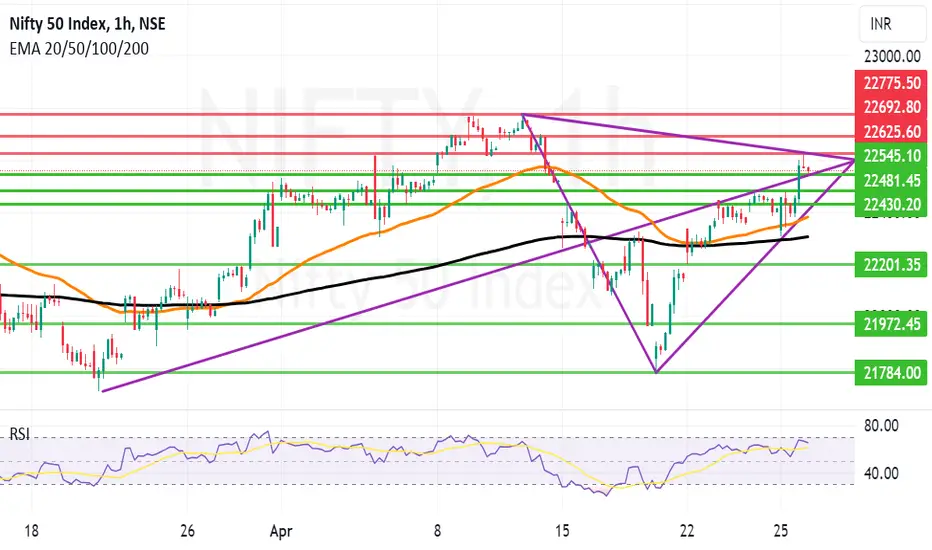
Nifty Delicately placed near the support zone.Nifty is delicately placed above the 50 EMA and 200 EMA support zones (Mother and Father support) which are at 22404 and 22316 respectively. This zone can act as a buffer and should provide proper technical support to Nifty. In case 22316 is broken Nifty can further fall to the levels of 22201 or even 21972. Worst case scenario as of now looks like 21784. If supports of 22404 and 22316 are respected we may see the Nifty rising upwards with resistances at 22458, 22545, 22625, 22692 and 22775. Shadow of the candle looks neutral with slightly positive bias.

What does Arrow in the chart of Nifty say? Arrow in the chart of Nifty is pointing in the direction of which Nifty intends to go in the long term. There may be some slip-ups in the short run but in the long run Nifty will be seen travelling in the direction the arrow is pointing.
Today Nifty returned from an important trendline resistance of 22625. crossing the same will be a little bit of a challenge. If we get a weekly closing above 22625 Nifty can quickly make new highs in the coming days with resistance at 22692 and 22775.
In case the mid arrow support is broken tomorrow we may see a down side with supports at 22545, 22481, 22430, 22380 and 22304. Below 22304 Nifty becomes weak again and bears can start calling the shots.
Shadow of the candle is negative to neutral as of now.
NIFTY INTRADAY LEVELS FOR 26/04/2024BUY ABOVE - 22620
SL - 22570
TARGETS - 22670,22720,22770
SELL BELOW - 22510
SL - 22570
TARGETS - 22510,22430,22390
NO TRADE ZONE - 22510 to 22620
Previous Day High - 22620
Previous Day Low - 22320
Based on price action major support & resistance's are here, the red lines acts as resistances, the green lines acts as supports. If the price breaks the support/resistance, it will move to the next support/resistance line. White lines indicates previous day high & low, high acts as a resistance & low acts as a support for next day.
Trendlines are also significant to price action. If the price is above/below the trendlines, can expect an UP/DOWN with aggressive move.
Please NOTE: this levels are for intraday trading only.
Disclaimer - All information on this page is for educational purposes only,
we are not SEBI Registered, Please consult a SEBI registered financial advisor for your financial matters before investing And taking any decision. We are not responsible for any profit/loss you made.
Request your support and engagement by liking and commenting & follow to provide encouragement
HAPPY TRADING 👍

22447 to 22481 proving to be a tough resistance to crack.Since yesterday 22447 to 22481 is again and again blocking the Nifty rally. Only after 22481 is crossed and held we will see the rally continue further. Further resistance will be near 22558, 22612, 22692 or even 22780+. In case the resistance proves strong enough the supports will be found at 22376, 22342 and 22290. If 22290 is broken then further supports will be found at 22201, 21972 and finally 22784. Shadow of the candle is still looking positive.

NIFTY INTRADAY LEVELS FOR 25/04/2024BUY ABOVE - 22430
SL - 22360
TARGETS - 22470,22510,22570
SELL BELOW - 22360
SL - 22430
TARGETS - 22320,22270,22210
NO TRADE ZONE - 22360 to 22430
Previous Day High - 22470
Previous Day Low - 22390
Based on price action major support & resistance's are here, the red lines acts as resistances, the green lines acts as supports. If the price breaks the support/resistance, it will move to the next support/resistance line. White lines indicates previous day high & low, high acts as a resistance & low acts as a support for next day.
Trendlines are also significant to price action. If the price is above/below the trendlines, can expect an UP/DOWN with aggressive move.
Please NOTE: this levels are for intraday trading only.
Disclaimer - All information on this page is for educational purposes only,
we are not SEBI Registered, Please consult a SEBI registered financial advisor for your financial matters before investing And taking any decision. We are not responsible for any profit/loss you made.
Request your support and engagement by liking and commenting & follow to provide encouragement
HAPPY TRADING 👍

NIFTY INTRADAY LEVELS FOR 24/04/2024BUY ABOVE - 22430
SL - 22360
TARGETS - 22470,22510,22570
SELL BELOW - 22360
SL - 22430
TARGETS - 22320,22270,22210
NO TRADE ZONE - 22360 to 22430
Previous Day High - 22430
Previous Day Low - 22360
Based on price action major support & resistance's are here, the red lines acts as resistances, the green lines acts as supports. If the price breaks the support/resistance, it will move to the next support/resistance line. White lines indicates previous day high & low, high acts as a resistance & low acts as a support for next day.
Trendlines are also significant to price action. If the price is above/below the trendlines, can expect an UP/DOWN with aggressive move.
Please NOTE: this levels are for intraday trading only.
Disclaimer - All information on this page is for educational purposes only,
we are not SEBI Registered, Please consult a SEBI registered financial advisor for your financial matters before investing And taking any decision. We are not responsible for any profit/loss you made.
Request your support and engagement by liking and commenting & follow to provide encouragement
HAPPY TRADING 👍
