NIFTY 50NIFTY 50 Support and Resistance Levels, Its look negative on hourly timeframe.
Nifty try to form double top pattern at there higher levels.
Neckline will play crucial level for support if its break, then we can expect level till the starting point of trendline.
Disclaimer: Its for educational purpose only do your own analysis before taking any position.
Nifty50

Nifty took support at the trendline+200 EMA support as expectedAs it was expected and depicted in our message yesterday Nifty took support at the trendline+200 EMA support making a low of 21860 and closing at 21982 making a high of 22060. We had mentioned as 22053 as resistance in case of bounce. The resistance of Mother line, 50 EMA forced the Nifty down again.(As shown in the encircled portion in the chart). This is how Technical analysis works and helps us with market and related predictions.
Future supports for Nifty: 21860, 21872 (200 Hours EMA), 21824 and 21674.
Future Resistance for Nifty: 22056 (50 Hours EMA), 22152 and 22229.

Nifty Approaching major support level in the free fall. We witnessed a free fall in Nifty today across the sectors. While the Nifty is falling freely a major support level of 200 hours EMA is approaching. Coinciding with 200 Hours EMA (Father Line) support is a trend line support which is near 21865. What seems to be the reason behind the market fall seems to be SEBI advisory to the Mutual Funds regarding their investment in small and mid cap companies to protect investor interest and and the need to rebalance their portfolio and take other measures. Next few days we will come to know the exact impact of the proceeds but certainly such an advisory when market is near the top will create a panic profit booking frenzy.
If 21865 is broken the next supports will be near 21824, 21674, 21533 or 21432 which seems to be the channel bottom.
If Nifty takes support near 200 days EMA and bounces from there the resistance levels will be at 22053, 22085, 22125, 22229 and 22281.
In case of market recovery the channel top seems to be near 22510.

50 EMA giving proper support to Nifty again.Today again we saw benevolence of Mother line (50 hours EMA) coming to fore and supporting Nifty giving it support to close well in the green. If Nifty can close above a strong resistance of 22218 there are good chances of Nifty again reaching previous high of 22295 or even cross it and go towards new high of 22364. Supports for Nifty remain at 22110 and 22105 (Strong support Zone). If this support is broken the Nifty can fall to 21970, 21885 or even channel bottom and 200 Hours EMA (Father line near 21853).

Mr. Double Top is that you?Following a contracting triangle breakout today, NIFTY zoomed up with a fair amount of pull backs which denote more than just a regular retracement. Over a larger time frame, one can observe NIFTY ultimately forming lower highs since it made the last all time high. Today, near the closing bell NIFTY made a double top and slipped down from what one would consider a healthy retracement. These sharp pull backs show the power of bears to cause a dip and trap for buyers hoping a fresh bull run.
However, patterns can break so keeping in mind the risks you should not stick to any particular pattern assuming the holy grail to market formations. On the right axis is Fibonacci retracements we can observe if a sharp fall occurs if the double top pattern holds true.

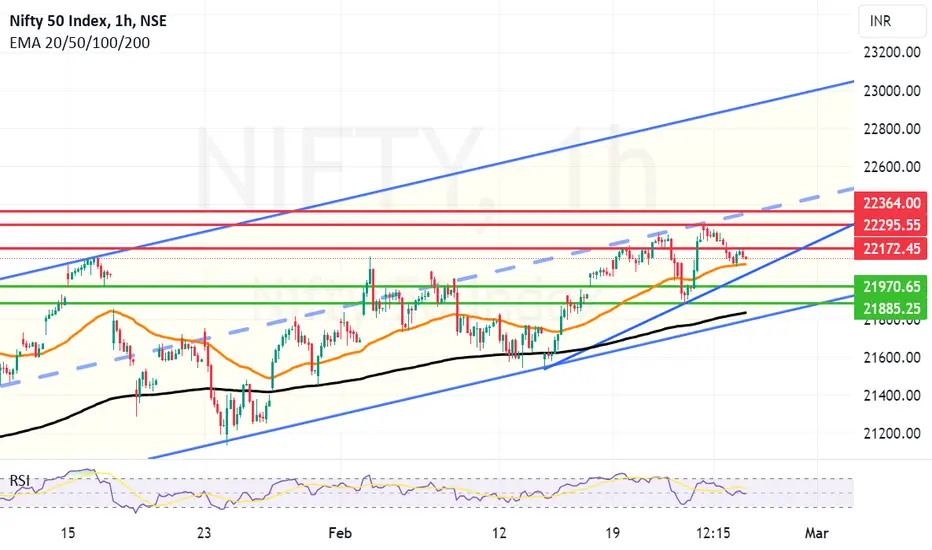
50 Hours EMA Support came into action today for Nifty.50 Hours EMA Support came into action and saved the day for Nifty today. Usually 50 Hour EMA should be a good support for Nifty but if we get a closing below the same today we can see further fall which may lead the Nifty to next support levels of 21970 or 21885. 21835 is the next major support for Nifty as it is a 200 Hours EMA. If Nifty recovers from the 50 EMA support the next resistance levels will be at 22172. The zone between 22295 and 22364 is a tough zone to conquer as the zone has ATH resistance as well as challenging Mid-channel resistance.
Trade setup_nifty completes minor corrective wave ii.Nifty 50 is seen completing 50% retracement of the prior leg i of 3 with today's dip.
The wave ii has achieved a 50% retracement of the wave i.
wave iii of 3 should now take off by today after noon.
the target for wave iii would be approx 22500 from here.
Today's intraday low of 22075 should most probably be a crucial bottom.
22000-22100 currently is the strong support zone.

NIFTY 50 Analysis For Feb 26th!Hello Traders,
Here is a Brief Overview About The Analysis of NIFTY 50 For Feb 26th!,
There Are Total of 2 Support Zones Which You Need To Look For And Same 2 Resistance Zones And To Be Mentioned One Grey Area And We Have 2 Imbalance Zones!
The Horizontal Lines From Volume To Volume And OI To OI Indicates The Market Range in Between For That Particular Day!
The Blue And Red Arrow Path Showing The Direction of The NIFTY 50 For That Day.
Note : Those Levels Are For That Particular Day Only.
Please Note That The Only Purpose of The Information On This Page is Purely Educational.
We Are Not Registered with SEBI; Therefore, Before Making Any Financial Decisions OR Investing, Please Consult with A SEBI-Qualified Financial Advisor. We Don't Have Any Responsibility For Your Profits OR Losses.
I Would Welcome Your Participation And Support in the Form of Likes, Comments, And Follow us to Offer Some Encouragement.
Thank You.

CNXFINANCE, FINNIFTY Analysis For Feb 26th!Hello Traders,
Here is a Brief Overview About The Analysis of FINNIFTY For Feb 26th,
There Are Total of 2 Support Zones Which You Need To Look For And 2 Resistance Zones And To Be Mentioned One Grey Area And We Have one Imbalance Zones!
Important Level To Be Mentioned : 20700, If it Crosses It's Trending Otherwise, Downside OR Consolidate a Bit.
The Horizontal Lines From Volume To Volume And OI To OI Indicates The Market Range in Between For That Particular Day!
The Blue And Red Arrow Path Showing The Direction of The FINNIFTY For That Day.
Note : Those Levels Are For That Particular Day Only.
Please Note That The Only Purpose of The Information On This Page is Purely Educational.
We Are Not Registered with SEBI; Therefore, Before Making Any Financial Decisions OR Investing, Please Consult with A SEBI-Qualified Financial Advisor. We Don't Have Any Responsibility For Your Profits OR Losses.
I Would Welcome Your Participation And Support in the Form of Likes, Comments, And Follow us to Offer Some Encouragement.
Thank You.

Nifty50 Daily Chart Analysis as of February 23, 2024 Nifty50 Daily Chart Analysis as of February 23, 2024
Disclaimer: I am not a financial advisor and this is not financial advice. Please do your own research before making any investment decisions.
Overall:
The Nifty 50 closed at 22,213 on February 23, 2024, marginally down by 0.02% from the previous day's close.
Despite the minor dip, the index has been on an upward trajectory since February 19th, gaining around 1.3% in the last five days.
This positive movement suggests a potential bullish trend, supported by a healthy recovery from the 21-day EMA and higher highs formation.
Key Technical Indicators / Technical Analysis:
The Nifty 50 is in an overall uptrend.
Moving Averages: The Nifty 50 is currently trading above its 50-day and 200-day moving averages, indicating a possible uptrend in the near future.
Relative Strength Index (RSI): The RSI is currently at 53.8, indicating that the index is neither overbought nor oversold. This suggests that there could be further upside potential.
MACD: The MACD is currently above the signal line, indicating a bullish momentum. The MACD indicator is positive, indicating a potential continuation of the uptrend in the medium to long term.
The Nifty 50 is currently trading above its 20-day and 50-day exponential moving averages (EMAs), indicating a bullish trend.
Key observations:
The Nifty has been following a trendline since January 20, 2024, suggesting a potential upside.
The 22,150-22,200 range remains a major resistance zone, while 21,000 is a crucial support level.
A breach above 22,300 could lead to further gains towards 22,500 and 22,600.
Support and Resistance Levels:
Immediate Resistance: The immediate hurdle for the Nifty 50 is seen at 22,300, followed by 22,500.
Immediate Support: The immediate support is at 22,000, with a crucial level at 21,875, which coincides with the 20-day EMA and Thursday's low.
Expert Opinions:
Several technical analysts believe that the Nifty 50 has formed a bullish reversal pattern on the daily chart, suggesting a potential move above 22,500.
However, some experts caution that the 22,300 level could be a significant short-term obstacle and recommend waiting for a confirmation breakout before taking any aggressive positions.
Overall, the technical analysis of the Nifty 50 Daily Chart as of February 23, 2024, suggests a cautiously optimistic outlook. While the index faces some immediate hurdles, the overall trend appears to be bullish. Investors should carefully consider their risk tolerance and investment goals before making any trading decisions.
Important to remember:
This information is based on past data and should not be considered financial advice.
Market conditions can change rapidly, and it is important to do your own research before making any investment decisions.
I hope this information is helpful. Please let me know if you have any other questions.
Disclaimer: I am not a financial advisor and this information should not be considered financial advice. Please consult with a qualified financial advisor before making any investment decisions.
Happy learning with trading. Cheers!🥂

A Higher High or All Time High?NIFTY 50 Index recently jumped up to set all time high. Looking at the index chart(s), a Flag and Pole pattern appears to be forming after this rally. A consolidated range break is imminent and we may start to see establishment of green zone after series of red hurdles. A bit of observation while staying patient will be the best therapy to see the picture unfold and give a direction of where the market wants to move.

NIFTY 50 Analysis For Feb 23rd!Hello Traders,
Here is a Brief Overview About The Analysis of NIFTY 50 For Feb 23rd,
There Are Total of 3 Support Zones Which You Need To Look For And Same 2 Resistance Zones And To Be Mentioned One Grey Area And We Have 3 Imbalance Zones!
The Horizontal Lines From Volume To Volume And OI To OI Indicates The Market Range in Between For That Particular Day!
The Blue Arrow Path Showing The Direction of The NIFTY 50 For That Day.
Note : Those Levels Are For That Particular Day Only.
Please Note That The Only Purpose of The Information On This Page is Purely Educational.
We Are Not Registered with SEBI; Therefore, Before Making Any Financial Decisions OR Investing, Please Consult with A SEBI-Qualified Financial Advisor. We Don't Have Any Responsibility For Your Profits OR Losses.
I Would Welcome Your Participation And Support in the Form of Likes, Comments, And Follow us to Offer Some Encouragement.
Thank You.

CNXFINANCE, FINNIFTY Analysis For Feb 23rd!Hello Traders,
Here is a Brief Overview About The Analysis of FINNIFTY For Feb 23rd,
There Are Total of 2 Support Zones Which You Need To Look For And 2 Resistance Zones And To Be Mentioned One Grey Area And We Have 2 Imbalance Zones!
Important Level To Be Mentioned : 20600, If it Crosses It's Trending Otherwise, Downside OR Consolidate a Bit.
The Horizontal Lines From Volume To Volume And OI To OI Indicates The Market Range in Between For That Particular Day!
The Blue Path Showing The Direction of The FINNIFTY For That Day.
Note : Those Levels Are For That Particular Day Only.
Please Note That The Only Purpose of The Information On This Page is Purely Educational.
We Are Not Registered with SEBI; Therefore, Before Making Any Financial Decisions OR Investing, Please Consult with A SEBI-Qualified Financial Advisor. We Don't Have Any Responsibility For Your Profits OR Losses.
I Would Welcome Your Participation And Support in the Form of Likes, Comments, And Follow us to Offer Some Encouragement.
Thank You.


Nifty closing above 22200 is a good psychological win of BullsDespite giving a red candle and negative closing of Nifty after making a new high of 22297.5 the closing the week above 22200 is a good psychological win of Bulls. This indicates that the rally has not lost steam. Profit booking was seen in a lot of scripts which brought the index down however the psychological level of 22200 was not broken. The supports for Nifty are at 22002, 21882, 21596 to 21547 is a very strong support zone for Nifty now. The resistances on the upper side for Nifty are at 22249 and 22297. The channel top currently seems to be near 22514.

NIFTY 50 23 FEB 24 (INTRADAY)1.Yesterday nifty closed extremely bullish and today opened gap up above previous 2 days high , so this high area will act as support and nifty may start going up from this area, so one can long in intraday for at least 100 points in nifty.
2. Global markets are also bullish.
3. Bank Nifty & Fin Nifty is also strong.
Support Zone Nifty 50- 22217-22250
Upside target in intraday 22350-22400.

Bulls fightback after bears had engulfed previous day's candle.What we saw today in Nifty was a remarkable fight back by bulls after bears had yesterday made an engulfing of previous Two days candled. Not only that the Nifty ended at 22217 recovering from day's low of 21875 which is a strong 342 point recovery from day's lows. Yesterday there was a bearish engulfing but what we had maintained is that today's candle has to close below the lows of yesterday. This means a follow up candle is required to confirm a break out or a break down. That is why we put a lot of emphasis on CLOSING and FOLLOW UP CANDLE. . Nifty has first time given a closing above 22200 today and it is very important for the bulls to close the week tomorrow above this psychological level.
Future resistances for Nifty are at: 22252, 22350 and 22412.
Support Levels for Nifty are near: 21997, 21876 and 21520.

NIFTY 50 Analysis For Feb 22nd!Hello Traders,
Here is a Brief Overview About The Analysis of NIFTY 50 For Feb 22nd,
There Are Total of 3 Support Zones Which You Need To Look For And Same 2 Resistance Zones And To Be Mentioned One Grey Area And We Have 5 Imbalance Zones!
The Horizontal Lines From Volume To Volume And OI To OI Indicates The Market Range in Between For That Particular Day!
The Blue And Red Arrow Path Showing The Direction of The NIFTY 50 For That Day.
Note : Those Levels Are For That Particular Day Only.
Please Note That The Only Purpose of The Information On This Page is Purely Educational.
We Are Not Registered with SEBI; Therefore, Before Making Any Financial Decisions OR Investing, Please Consult with A SEBI-Qualified Financial Advisor. We Don't Have Any Responsibility For Your Profits OR Losses.
I Would Welcome Your Participation And Support in the Form of Likes, Comments, And Follow us to Offer Some Encouragement.
Thank You.

CNXFINANCE, FINNIFTY Analysis For Feb 22nd!Hello Traders,
Here is a Brief Overview About The Analysis of FINNIFTY For Feb 22nd,
There Are Total of 2 Support Zones Which You Need To Look For And Same 3 Resistance Zones And To Be Mentioned One Grey Area And We Have 2 Imbalance Zones!
Important Level To Be Mentioned : 20700, If it Crosses It's Trending Otherwise, Downside OR Consolidate a Bit.
The Horizontal Lines From Volume To Volume And OI To OI Indicates The Market Range in Between For That Particular Day!
The Blue And Red Arrow Path Showing The Direction of The FINNIFTY For That Day.
Note : Those Levels Are For That Particular Day Only.
Please Note That The Only Purpose of The Information On This Page is Purely Educational.
We Are Not Registered with SEBI; Therefore, Before Making Any Financial Decisions OR Investing, Please Consult with A SEBI-Qualified Financial Advisor. We Don't Have Any Responsibility For Your Profits OR Losses.
I Would Welcome Your Participation And Support in the Form of Likes, Comments, And Follow us to Offer Some Encouragement.
Thank You.

Nifty 50 Daily Chart Analysis - February 21, 2024Technical Analysis:
Candle Pattern: The daily chart for February 21st shows a "Bearish Engulfing" pattern. This indicates a potential reversal in the upward trend, as the current day's candle completely engulfs the previous day's price range.
Moving Averages: All major moving averages are still bullish, but the recent candle suggests a possible slowdown in the upward momentum.
Support and Resistance:
Immediate support: 21,920
Key support: 21,600
Resistance: 22,450 - 22,500
Indicators:
RSI: Currently at 67, nearing overbought territory, suggesting a potential pullback.
MACD: Still bullish, but the histogram shows a weakening momentum.
Key Observations:
The Nifty 50 has been consolidating near the recent highs for the past few days.
The Bearish Engulfing pattern suggests a potential pullback in the near term.
Overbought technical indicators also suggest a potential correction.
However, the long-term trend remains upward, supported by bullish moving averages.
Other Observations:
The market opened higher but faced selling pressure later in the day, leading to the Bearish Engulfing pattern.
FII activity shows some reduction in short positions, suggesting cautious optimism.
The IPO of Purv Flexipack on February 27th could potentially impact market volatility.
Overall:
The Nifty 50 is currently at a crossroads. While the technical indicators still favor the upward trend, the Bearish Engulfing pattern and overbought conditions raise concerns about a potential pullback. The next few days will be crucial to see if the market can maintain its momentum or succumb to selling pressure.
Important Note:
This analysis is for informational purposes only and should not be considered financial advice. Please consult a qualified financial advisor before making any investment decisions.

NIFTY 50 Analysis For Feb 21st!Hello Traders,
Here is a Brief Overview About The Analysis of NIFTY 50 For Feb 21st,
There Are Total of one Support Zones Which You Need To Look And To Be Mentioned One Grey Area And We Have one Imbalance Zone!
The Horizontal Lines From Volume To Volume And OI To OI Indicates The Market Range in Between For That Particular Day!
The Blue Arrow Path Showing The Direction of The NIFTY 50 For That Day.
Note : Those Levels Are Only For That Particular Day.
Please Note That The Only Purpose of The Information On This Page is Purely Educational.
We Are Not Registered with SEBI; Therefore, Before Making Any Financial Decisions OR Investing, Please Consult with A SEBI-Qualified Financial Advisor. We Don't Have Any Responsibility For Your Profits OR Losses.
I Would Welcome Your Participation And Support in the Form of Likes, Comments, And Follow us to Offer Some Encouragement.
Thank You.

CNXFINANCE, FINNIFTY Analysis For Feb 21st!Hello Traders,
Here is a Brief Overview About The Analysis of FINNIFTY For Feb 21st,
There Are Total of 2 Support Zones Which You Need To Look For And Same 2 Resistance Zones And To Be Mentioned One Grey Area And We Have 4 Imbalance Zones!
Important Level To Be Mentioned : 20800, If it Crosses It's Trending Otherwise, Downside OR Consolidate a Bit.
The Horizontal Lines From Volume To Volume And OI To OI Indicates The Market Range in Between For That Particular Day!
The Blue Arrow Path Showing The Direction of The FINNIFTY For That Day.
Note : Those Levels Are For That Particular Day Only.
Please Note That The Only Purpose of The Information On This Page is Purely Educational.
We Are Not Registered with SEBI; Therefore, Before Making Any Financial Decisions OR Investing, Please Consult with A SEBI-Qualified Financial Advisor. We Don't Have Any Responsibility For Your Profits OR Losses.
I Would Welcome Your Participation And Support in the Form of Likes, Comments, And Follow us to Offer Some Encouragement.
Thank You.

Bearish Engulfing Candle may take Nifty down.Bearish Engulfing Candle engulfed previous two Green Candle in Nifty chart today and may take Nifty down bringing in some consolidation and correction if we get a confirmation red candle tomorrow. If we get a closing below 21997 tomorrow bears may rejoice. The supports for Nifty in case of negative closing tomorrow will be at 21997, 21793, The zone between 21573 and 21410 has many supports including 50 days EMA and Mid-channel support. A closing below 21410 will elevate the mood of bears who will try to pull Nifty further down to next support levels of 21148 and 20770. In case 20770 is broken 200 days support of Nifty will be near 20114. On the upper side 22449 will remain an important resistance. Channel top seems to be near 23K but Nifty will need a lot of consolidation and little bit of correction before we can reach there.
