Nifty Analysis EOD – June 18, 2025 – Wednesday🟢 Nifty Analysis EOD – June 18, 2025 – Wednesday 🔴
⚖️ Dhamakedar Start, But Indecisive Close – Weekly Expiry Caution Ahead
Nifty opened with a 65-point gap-down at 24,788.35, but what followed was a power-packed bullish start — within just 25 minutes, it surged over 150 points, hitting a day high of 24,947.55.
However, the euphoria didn’t last.
As the session progressed, the index gradually gave up all its gains, slipped below the previous day’s low, and finally found support at 24,750, a critical level. By the end of the day, Nifty settled around the opening zone at 24,812.05, just +23 points above open, while net change remained −41.35 points from the previous close.
The day showcased both strength and weakness — a typical "everyone-expected-fall-but-it-didn't-fall-enough" kind of day. The long upper wick reflects failed attempts by bulls, while the lack of breakdown keeps the bears in check.
Tomorrow is weekly expiry — caution is advised.
🕯 5 Min Time Frame Chart with Levels
🕯 Daily Time Frame Chart
🕯 Daily Candle Breakdown
Open: 24,788.35
High: 24,947.55
Low: 24,750.45
Close: 24,812.05
Change: −41.35 (−0.17%)
📊 Candle Structure Breakdown
Real Body: 23.70 pts → ✅ Green Candle (tiny body)
Upper Wick: 135.50 pts
Lower Wick: 37.90 pts
🔍 Interpretation
Strong bullish momentum early on, but buyers failed to hold above 24,900.
Long upper wick signals supply or profit-booking at higher levels.
Price closed near open despite wide range → indecision between bulls and bears.
🕯 Candle Type
🟨 Spinning Top – A textbook indecisive candle, often seen at turning points or during pauses in trend.
📌 Key Insight
Buyers couldn’t reclaim or close above 24,950 — resistance strengthened.
Support held at 24,750 — but barely.
Watch 24,950 on upside and 24,750 on downside — a breakout from either may decide expiry-day trend.
🛡 5 Min Intraday Chart
⚔️ Gladiator Strategy Update
ATR: 252.34
IB Range: 170.65 → Medium IB
Market Structure: ⚖️ Balanced
Trades:🚫 Short Trigger at 12:45 : Trapped - SL Hit
📌 Support & Resistance Zones
Resistance Levels
24,894 ~ 24,882
24,972 ~ 25,000
25,060 ~ 25,080
25,102 ~ 25,125
Support Levels
24,825 ~ 24,847
24,725 ~ 24,735
24,660
24,590
💭 Final Thoughts
When price travels 200 points but closes flat, it tells you something: Smart money is waiting.Weekly expiry ahead could bring unexpected moves.✅ Stay nimble. Stay alert.
🧠 “When in doubt, let the market shout — not whisper. Listen for the breakout.”
✏️ Disclaimer
This is just my personal viewpoint. Always consult your financial advisor before taking any action.
Nifty50

HDFCBANK - For my Indian Viewers!So an Indian Viewer has asked for this, so looking onto it, the heavyweight of sector NIFTY would see a move as stated!

Resistance zones and Geo-political instability acting up.Geo-Political instability and resistance zone are acting up together to stop Nifty and not allowing it to close above 25K. As the world is looking at developments in Iran Vs Israel conflict with beated heart market today gave up some gains from yesterday. The only index looking strong is IT index right now. Avoid taking very long positions unless you are very sure of the company. Yesterday also Nifty failed to close above 25K opened briefly near 25K today and then moved downwards. Lot will be decided in the short term by the developments that happen tonight. Important G7 meet and US Federal reserve Rate Cut meet is also to happen later in the week. These 2 global factors will decide fate of the market in the short term. Local factors are all in line and nothing to worry for Indian markets on that front.
The supports for Nifty remain at: 24713 (Trend line support), 24425 (Mother line support of Daily chart), next support is near 23917, 23806 (Father line support of daily chart is in place). Closing below 23906 can lead to further down side and in such a scenario Nifty can fall further towards 23500 or 23047 levels. If we get a closing below that we will give updates regarding the same.
Resistances for Nifty remain at: 24982 (Today's high), 25112 and trend line resistance of 25251. When we get a closing above 25251 we will update you regarding the further upward resistnace levels.
Disclaimer: The above information is provided for educational purpose, analysis and paper trading only. Please don't treat this as a buy or sell recommendation for the stock or index. The Techno-Funda analysis is based on data that is more than 3 months old. Supports and Resistances are determined by historic past peaks and Valley in the chart. Many other indicators and patterns like EMA, RSI, MACD, Volumes, Fibonacci, parallel channel etc. use historic data which is 3 months or older cyclical points. There is no guarantee they will work in future as markets are highly volatile and swings in prices are also due to macro and micro factors based on actions taken by the company as well as region and global events. Equity investment is subject to risks. I or my clients or family members might have positions in the stocks that we mention in our educational posts. We will not be responsible for any Profit or loss that may occur due to any financial decision taken based on any data provided in this message. Do consult your investment advisor before taking any financial decisions. Stop losses should be an important part of any investment in equity.

Solid V Shaped recovery within the Parallel channel for NiftyNifty recovered sharply within the parallel channel. The reasons that can be attributed are inherent strength in the Indian market and swift recovery in IT, Infra, Metal, commodities, Realty, Mid and Small cap browsers. The closing of Nifty was at 24946 which is just above the mother line which is at 24908. The same mother line provided the support to Nifty in the last few hours of trade when there was some intraday profit booking pressure.
Nifty Supports remain at: 24908 (Mother line Support), 24836, 24690 (Father Line Support), 24555 (Channel Bottom Support) and 24480 recent low. Below 24880 Nifty will be very weak and Bears in that scenario can drag Nifty further down to 24195 or 23957. These are the levels as of now. If we go below these levels in unlikely circumstances we will update the levels once we get there.
Nifty Resistances remain at: 24973, 25106 (Mid Channel Resistance) and 25231.Once we close above 25231 we will update further levels.
Disclaimer: The above information is provided for educational purpose, analysis and paper trading only. Please don't treat this as a buy or sell recommendation for the stock or index. The Techno-Funda analysis is based on data that is more than 3 months old. Supports and Resistances are determined by historic past peaks and Valley in the chart. Many other indicators and patterns like EMA, RSI, MACD, Volumes, Fibonacci, parallel channel etc. use historic data which is 3 months or older cyclical points. There is no guarantee they will work in future as markets are highly volatile and swings in prices are also due to macro and micro factors based on actions taken by the company as well as region and global events. Equity investment is subject to risks. I or my clients or family members might have positions in the stocks that we mention in our educational posts. We will not be responsible for any Profit or loss that may occur due to any financial decision taken based on any data provided in this message. Do consult your investment advisor before taking any financial decisions. Stop losses should be an important part of any investment in equity.

Tensions in the Middle East. (Levels to watch, things to do). Iran and Israel situation is tense. Lot of investors have lot of questions in mind. I am trying to provide my opinion for the same in the video. I am trying to give my Technical and Political commentary on the situation in this educational video. The political commentary is based on my 15+ years of experience in the Middle East and is my personal opinion. I hope this will answer a lot of questions for you. I have also tried to give Techincal support and resistance levels for Nifty. In the 10 minute I have tried to cover as many points as I can. Along with the list of things to do as an investor. I hope this will help many of you.
As it was expected there was a deep fall in the market due to Israel Vs Iran tensions. US is also a direct or indirect party to the situation and if there is further escalation other global powers will mostly get involved. Due to the this situation market opened gap down at 24473. What we saw post that is Indian market recovered smartly from that situation to close at 24718. That is a huge 245 point recovery to end the day. This is why colour of the candles throughout the day (As this is an hourly chart are green despite we ended in red. (That is a classic Technical lesson for understanding candle sticks analytics). The closing is above the father line support of 24674 which is a good sign as this will be our support (Strong support for Monday.) I have spent more than 15 years in the Middle East and happen to know a little bit out of my personal experience, having interacted with a lot of locals. Thus I am trying to answer a few questions that might be coming in the minds of may investors including myself.
Q&A
The Question now are we out of danger?
Answer: Not yet.
Question 2: Why we are not out of danger?
Ans: The geo-political situation is very tense. The scale of Israeli attack was massive and there are clear and present chances of Iran counter attack which has already begun. Israel will respond again and Trump has already said that the next attacks by Israel will be even more fierce. No Iran is no palestine and there would be many countries that might support Iran. Specially China has already hinted support. Russia another ally is busy with Ukraine but you never know.
Question 3: How it goes for the other Middle Eastern countries?
Ans: There are lot of countries with US and Western bases on them. If Iran attacks them there are chances of other Western countries getting into the act too. In addition to some Middle Eastern countries getting into the act for the purpose of self defence. Thus over the weekend the things can get either very tense.
Question 4: What happens to India and Indian markets?
Ans: Today Indian markets have shown a lot of resilience. Global meltdown can affect us to for sure. But as we are neutral (As of now as it seems). The damage to our market hopefully will be minimal. Moreover recovery will be swift once the situation becomes less tense.
Question 5: What should investors do?
Ans: Long term investors can hold on to their long term positions in blue chip stocks. Keep stop losses and trailing stop losses in place for the mid-cap and small cap stocks. If some stop losses are hit or trailing stop losses are hit, you can always buy again as market is not going anywhere. The dip that we might potentially see can be an opportunity for long term investors for bottom fishing again and recalibrating their portfolios. (You can use the current situation to realign your portfolio for buying the trending stocks which have giving good results this quarter or have been giving good results since last few quarters.) Get rid of the stocks that have been dragging your portfolio down. Market has provided another opportunity for a fresh start.
Things you can do:
1) Gold and Silver are always a great option when it comes to uncertain times.
2) Do not give a knee jerk reaction in selling off your winners.
3) Watch the global updates and keep stop losses and trailing stop losses accordingly.
4) Re-calibrate your portfolio
5) If you are sitting on cash use the dip for investing in stocks with long term perspective.
The support for Nifty Remain at: 24674 (Father line support), 24640 (Mid-channel support), 24492 (Trend line support), 24382, 24208 and finally 24077 (Channel Bottom Support). a closing below 24077 will enable and empower bears to Pull Nifty further down.
Resistances for Nifty remain at: 24752, 24818, 24906 (Mother line Resistance), 25043, 25138 and finally 25223 (Channel top Resistnace). Above 25223 Bulls will potentially take over the market.
To know more about Mother Father and Small Child theory, Parallel Channel, Technical and Fundamental analysis and to learn it to master it. Read my book. The Happy Candles Way To Wealth Creation available on Amazon in Paperback and Kindle version. The book is one of the highest rated books in the category and many readers consider it as a Hand Book for Equity investment.
Disclaimer: The above information is provided for educational purpose, analysis and paper trading only. The political commentary is based on personal views and analysis. Please don't treat this as a buy or sell recommendation for the stock or index. The Techno-Funda analysis is based on data that is more than 3 months old. Supports and Resistances are determined by historic past peaks and Valley in the chart. Many other indicators and patterns like EMA, RSI, MACD, Volumes, Fibonacci, parallel channel etc. use historic data which is 3 months or older cyclical points. There is no guarantee they will work in future as markets are highly volatile and swings in prices are also due to macro and micro factors based on actions taken by the company as well as region and global events. Equity investment is subject to risks. I or my clients or family members might have positions in the stocks that we mention in our educational posts. We will not be responsible for any Profit or loss that may occur due to any financial decision taken based on any data provided in this message. Do consult your investment advisor before taking any financial decisions. Stop losses should be an important part of any investment in equity.

Things heating up between Iran and US. Market takes a nose dive.There is a news of things heating up between Iran and US with regards to Nuclear negotiations. It seems US has asked for reduction of staff at few embassies across the Middle East. In addition to the tragic plane crash in Ahmedabad also might have affected the sentiment. Market had already nosedived before the tragedy struck so it is hard to say it had any effect. Only logical explanation seems to be the Iran related escalation. On the technical Nifty was not able to hold above 25200 levels even after multiple attempts. This suggests upside-down there were currently no takes for the upside such scenario only leads to a correction and market diving to find a concrete bottom before beginning the next upward movement. The geo-political developments should be closely watched to speculate about further moves of market.
The zone between 24818 to 24672 has multiple supports including trend line support and mid-channel support and Father line support at 24672 as it can be seen in the chart. A closing below 24672 will only give the advantage to the bears who can further drag the Nifty towards 24492, 24382 or 24208 (Channel bottom support). Things get worse beyond this point but we will only talk about it if we get a closing below this level.
Resistance on the upside remain at 24902, 24974 (Mother line Resistance), 25043, 25138 and 25223. If we get a closing above 25223 then the channel top will be around 25337. Regarding the levels above 25337 we will post once we reach that stage.
Disclaimer: The above information is provided for educational purpose, analysis and paper trading only. Please don't treat this as a buy or sell recommendation for the stock or index. The Techno-Funda analysis is based on data that is more than 3 months old. Supports and Resistances are determined by historic past peaks and Valley in the chart. Many other indicators and patterns like EMA, RSI, MACD, Volumes, Fibonacci, parallel channel etc. use historic data which is 3 months or older cyclical points. There is no guarantee they will work in future as markets are highly volatile and swings in prices are also due to macro and micro factors based on actions taken by the company as well as region and global events. Equity investment is subject to risks. I or my clients or family members might have positions in the stocks that we mention in our educational posts. We will not be responsible for any Profit or loss that may occur due to any financial decision taken based on any data provided in this message. Do consult your investment advisor before taking any financial decisions. Stop losses should be an important part of any investment in equity.

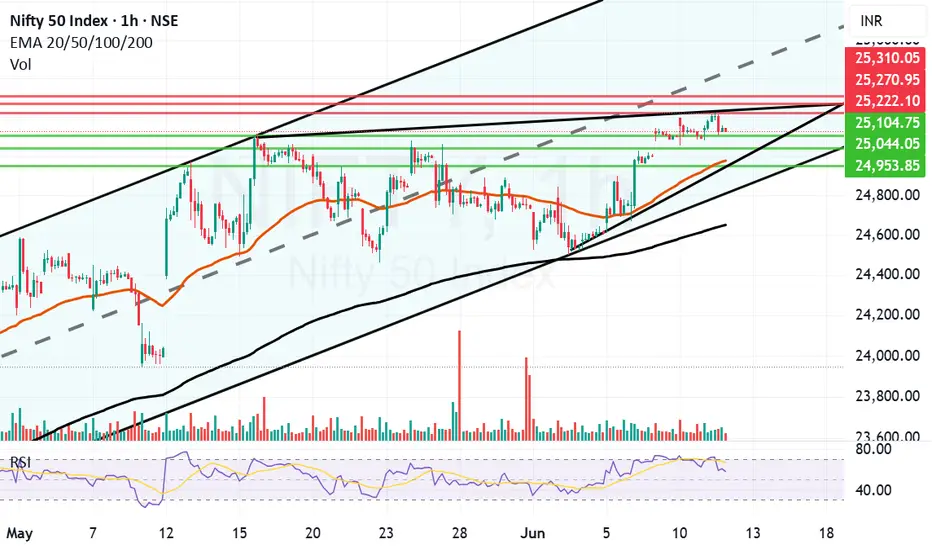
Nifty Facing resistnace above 25200 zoneToday Nifty closing above 25141 is a positive sign but it is evidently facing resistnace above 25200 zone. Nifty made a high of 25222 today but could not sustain at those levels and fell but eventually closed in the positive. The daily candle formed is an indecisive Doji.
IT Sector seems to be on the verge of a Reverse Head and Shoulder Breakout. If this breakout happens and Nifty gets support from other heavy weights we can see it growing further.
The resistances for Nifty now are at 25222, 25270 and 25310.
The supports for Nifty are at 25104, 25044, 24977 (Mother line support of Daily chart and 24953 Channel bottom. Things are in balance with shadow of the candle slightly positive.
Disclaimer: The above information is provided for educational purpose, analysis and paper trading only. Please don't treat this as a buy or sell recommendation for the stock or index. The Techno-Funda analysis is based on data that is more than 3 months old. Supports and Resistances are determined by historic past peaks and Valley in the chart. Many other indicators and patterns like EMA, RSI, MACD, Volumes, Fibonacci, parallel channel etc. use historic data which is 3 months or older cyclical points. There is no guarantee they will work in future as markets are highly volatile and swings in prices are also due to macro and micro factors based on actions taken by the company as well as region and global events. Equity investment is subject to risks. I or my clients or family members might have positions in the stocks that we mention in our educational posts. We will not be responsible for any Profit or loss that may occur due to any financial decision taken based on any data provided in this message. Do consult your investment advisor before taking any financial decisions. Stop losses should be an important part of any investment in equity.
BANKNIFTY is moving towards 59000The monthly Cash Data chart is forming a diametric pattern. Waves (a) through (f) have completed and we are currently in the middle of wave (g) of the diametric pattern.
This wave is moving towards 59,000

Nifty facing trendline resistance and RSI cooling down. Nifty had come close to overbought zone. Not that it was immensely overbought. It is also facing a trendline resistance which is hampering it's further progress. Bears are trying their best to bring it down while Bulls are trying to pull it above the trend line. The trade is in perfect balance right now. Once during the day Nifty had broken the trendline resistnace too as it made a high of 25199 but could not sustain the levels and was pulled down immediately. 25055 provided support and kept it Flat.
Supports for Nifty now remain at 25052, 24957, 24917 (Mother line of hourly chart), 24846 is another trend line support. Father line support is at 24614. Below this level bears will take over.
Resistances for Nifty remain at 25118, 25199 (Trend line resistance), A closing above 25199 will enable and empower bears as this will be a closing above mid channel resistance too. In such a scenario Bulls can further full Nifty upwards towards 25298 and 25387 levels.
Disclaimer: The above information is provided for educational purpose, analysis and paper trading only. Please don't treat this as a buy or sell recommendation for the stock or index. The Techno-Funda analysis is based on data that is more than 3 months old. Supports and Resistances are determined by historic past peaks and Valley in the chart. Many other indicators and patterns like EMA, RSI, MACD, Volumes, Fibonacci, parallel channel etc. use historic data which is 3 months or older cyclical points. There is no guarantee they will work in future as markets are highly volatile and swings in prices are also due to macro and micro factors based on actions taken by the company as well as region and global events. Equity investment is subject to risks. I or my clients or family members might have positions in the stocks that we mention in our educational posts. We will not be responsible for any Profit or loss that may occur due to any financial decision taken based on any data provided in this message. Do consult your investment advisor before taking any financial decisions. Stop losses should be an important part of any investment in equity.

NIFTY 50 Long term Analysis I had a VIew in September 2024 that NIfty Should Fall from Its Life time HIgh to the levels of 22000 which is a strong Support and Monthly EMI 20 in Sept 2024 was nearing 22000 levels.
Now as nifty has taken support from 22000 and have relied till 25000 now. in HTF it is sideways. Important levels above is 25250 and then 26000 (LTH) and on lower side 24000 & 22000.
US after trump is very volatile and now after trump and elon musk issue and off course trade war with mostly china may drive the US market down as it is already overvalued and effects could be seen here in India market
Market Cap to GDP ratio of US (190%) & India (125%) is very High Still.
Nifty 50 analysis :
If Nifty from here if breaks 25250 level and sustain there it will face resistance @ 26000 (LTF) and if it is able to break it and sustain over it. It should zoom to 30000 levels in next 10-12 months
if nifty is not able to hold 25250 and gets rejection from here it should get it support @ 24000 but if it is not able to hold on to it. The Next Level will be 22000 again which is a very strong support but it is been tested already twice.
I have view here that Economic Conditions, US Market, Wars & Other Factors if not favourble at that time Nifty can Test 19500 Levels and curruntly 3 Month EMA 20 also is Calling the market to hand shake once @ 19500 Very Strong 3 Months Demand Zone.
This should also take 10-12 months from here.
Lets see where nifty 50 takes us 30000 or 19500.
;)

SBIN Weekly Levels and reportLook at the Weekly Chart:
This will show you how SBIN’s price has moved each week.
Identify Support and Resistance:
Support is where the price usually doesn’t fall below (like a floor).
Resistance is where the price often doesn’t go higher than (like a ceiling).
Example: If SBIN’s price bounced off ₹590 a few times, that’s support. If the price keeps struggling around ₹640-650, that’s resistance.
Check for Fibonacci Levels (Optional):
You can use a tool that shows you Fibonacci retracement levels. It helps find where prices might bounce or reverse.
Key levels to watch for are 38.2%, 50%, and 61.8% retracements from a big move (up or down).
Draw Trendlines:
If SBIN has been moving up, draw a line connecting the lows to see where it might find support in the future.
If it’s in a downtrend, connect the highs to see where resistance might be.
Check the Moving Averages:
The 50-week and 200-week moving averages can show if the stock is generally moving up or down.
If SBIN is above the 50-week average, it might be in a bullish (up) trend.
If it’s below the 200-week average, it might be in a bearish (down) trend.
Look for Round Numbers:
Prices like ₹600, ₹650, ₹700 are often seen as psychological levels. Traders often watch these prices because they’re easy to remember.
Example:
If SBIN recently bounced off ₹590 or ₹600 multiple times, that’s support.
If it keeps facing resistance around ₹640 or ₹650, those are resistance levels.
Final Thoughts:
If SBIN’s price breaks above resistance (say ₹650), it might go higher.
If it falls below support (say ₹590), it might drop further.


Market Outlook – Nifty Near Critical Levels! Caution Advised
Nifty Weekly Wrap-Up:
The Nifty 50 index closed the week at 25,003, posting a solid gain of +250 points from last week's close. It touched a high of 25,029 and a low of 24,502 during the week.
But here’s the twist—while the uptrend looks strong, we’re now at a crucial inflection point on the weekly chart.
Technical Outlook – Is a Bearish “M” Pattern Forming?
On the weekly timeframe, Nifty is at a level where a bearish M-pattern could potentially develop. To complete this pattern, the index could pull back towards support levels at:
24,414
24,200
24,000
If the selling deepens, the final support zone lies between 23,900–23,700, where a bounce-back is likely.
Bullish Scenario – Can Nifty Break Out?
If Nifty holds above 25,000 for at least 2 consecutive sessions, it could trigger a short-covering rally, paving the way for a move toward key resistance zones at:
25,400
25,565
26,100
Next Week’s Expected Range: 24,500 – 25,500
This range should see most of the action next week. If you're holding long positions, now is a great time to:
✔️ Lock in profits
✔️ Trail stop-losses
✔️ Prepare cash reserves for potential dip-buying opportunities
Global Watch – S&P 500 Hits Key Resistance
The S&P 500 closed near 6,000, up 100 points for the week. But heads up—it’s now testing a strong Fibonacci resistance at 6,013.
A rejection here could lead to a correction toward 5,900–5,850, a dip of 1.5–2.5%. If this unfolds alongside a Nifty pullback, it would align perfectly with our support targets around 24,400–24,500.
Final Takeaway:
Markets are looking stretched. While momentum remains positive, profit booking at higher levels is essential. Don’t get caught unprepared in case of a reversal. Stay tactical, stay liquid.
Smart money is already locking in gains. Are you?

$NIFTY: New highs incoming; 27500 can be cycle highsNSE:NIFTY the index from India which holds the top 50 stocks in India. IN the chart below we have overlayed the SP:SPX index. The NSE:NIFTY and $S&P500 have been in lockstep for more than 5 years as shown in the chart below. The indices are just 2.5% away from their ATH. Even with these levels the RSI for NSE:NIFTY is 61 and 58 in case of $SPX.
The RSI is far from overbought condition. So, this rally which started in NSE:NIFTY can have more legs. With Global liquidity on the rise and RBI easing policy rates the NSE:NIFTY can reach its all-previous highs of the Fib retracement levels. The previous peak was 0.786 Fib retracement level which on this upward sloping chart can be as high as 27500 which can indicate another 10% upside.
Verdict : Stay long $NIFTY. More upside possible. RSI still not overbought.

50 bps Repo Rate Cut boosts Nifty. Can it fly further now?The market was expecting a Repo Rate Cut From RBI. The expectation was for 25bps but what we got today from RBI was a bumper 50 bps rate cut. This propelled Nifty to close above much coveted level of 25K as Nifty managed to close at 25003. Now Nifty has entered a critical resistance zone. This zone starts from around 25037 to 25146. Closing above 25146 is mandatory for Nifty to fly further and gain further momentum. Last 4 weeks or so Nifty has been returning back from this zone. We can see this in the weekly chart of Nifty. With rate cut the chances for Nifty to fly above this most important levels has increased a lot.
The resistances for Nifty Now Remain at: 25037, 25146 (Important Trend line Resistance, Bulls will be very active above this level.), 25473, 25804 and 26277. Further levels will be given once we get a closing above 26277.
The supports for Nifty remain at: 24642, 24425, 23904, 23597 (Most important Mother Line of Weekly Candles). Below this level Nifty will become very week again and bears can drag Nifty further down towards 23201 (Important Trend Line Support). If this is broken in unlikely global or local geo-political event then Nifty can further fall to 22169 or even 21671 levels in unlikely scenario of major geo-political event unfolding.
Disclaimer: The above information is provided for educational purpose, analysis and paper trading only. Please don't treat this as a buy or sell recommendation for the stock or index. The Techno-Funda analysis is based on data that is more than 3 months old. Supports and Resistances are determined by historic past peaks and Valley in the chart. Many other indicators and patterns like EMA, RSI, MACD, Volumes, Fibonacci, parallel channel etc. use historic data which is 3 months or older cyclical points. There is no guarantee they will work in future as markets are highly volatile and swings in prices are also due to macro and micro factors based on actions taken by the company as well as region and global events. Equity investment is subject to risks. I or my clients or family members might have positions in the stocks that we mention in our educational posts. We will not be responsible for any Profit or loss that may occur due to any financial decision taken based on any data provided in this message. Do consult your investment advisor before taking any financial decisions. Stop losses should be an important part of any investment in equity.

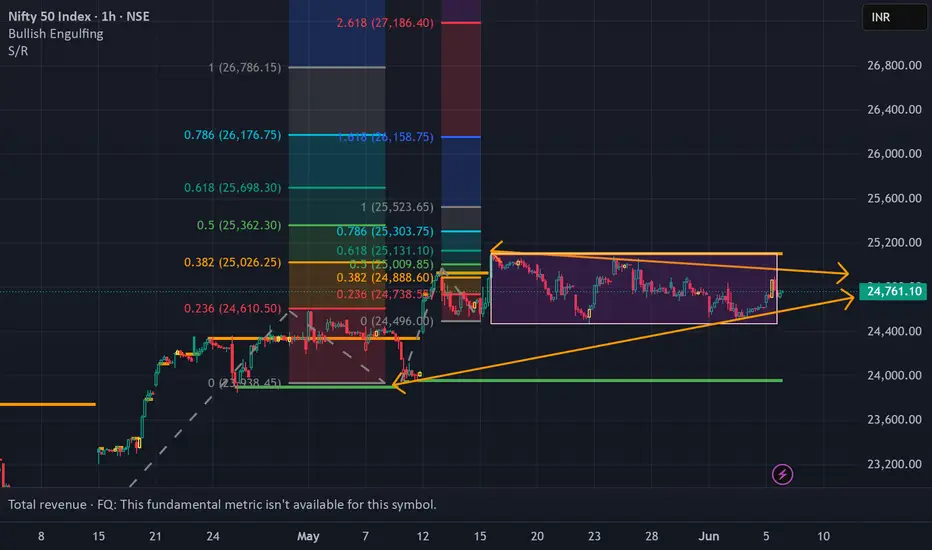
Nifty50 Index MovementNSE:NIFTY Index is indicating an Upward Movement. The Rectangular Pattern needs to be broken and move upwards which is what is expected. We could soon expect 26k Range.
More over, if the RBI Moneytary policy today make any rate cut, this will accelerate the Movement.
This is truely for Educational Purpose and if the graph goes as expected we can expect good movement for Nifty 50 stocks Primarily.
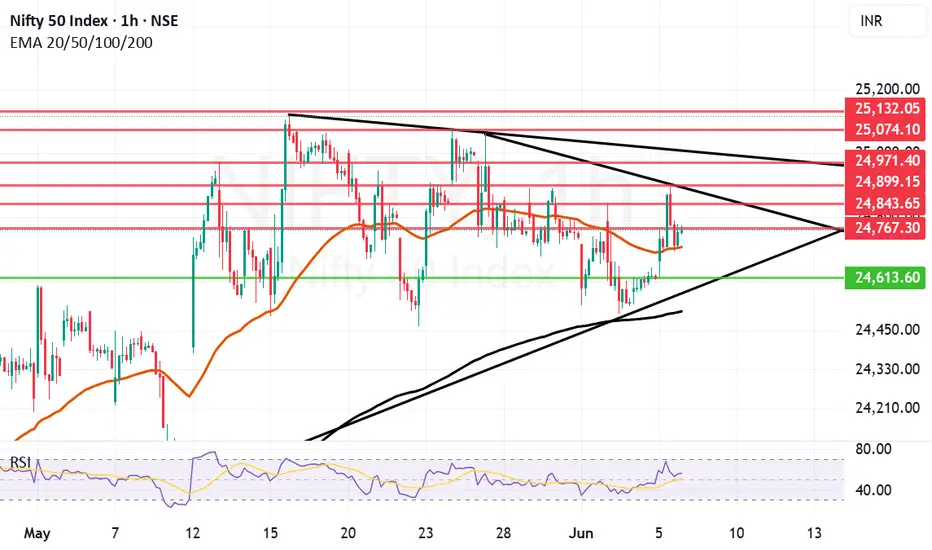
Nifty bounce between Trendline resistance and Mother lineWe Saw a jump of 130 points in Nifty today. The jump could have been higher if trend line resistance would not have come into play. This trend line resistance which came into effect is exactly around 24899 as it can be seen in the chart which was also the day's high. After making this high Nifty fell again until Mother line support present near 24706 again came into act for Nifty to close near 24750.
Thus the supports for Nifty now remain at: 24706 (Mother Line Support), 24613 (Low of today) and Father line Support near 24508. Below 24508 there will be further weakness and Bears will take control of the market.
The Resistances for Nifty now remain at: 24767, 24843, 24899 (trend line resistance), and 24971(Another Trend line resistance). Above 24971 closing Nifty will gain strength again and Bears can pull the market upwards towards 25074 or 25132. Closing above 25132 will be very good for the market as there seems to be a pure Bull territory above this zone.
Disclaimer: The above information is provided for educational purpose, analysis and paper trading only. Please don't treat this as a buy or sell recommendation for the stock or index. The Techno-Funda analysis is based on data that is more than 3 months old. Supports and Resistances are determined by historic past peaks and Valley in the chart. Many other indicators and patterns like EMA, RSI, MACD, Volumes, Fibonacci, parallel channel etc. use historic data which is 3 months or older cyclical points. There is no guarantee they will work in future as markets are highly volatile and swings in prices are also due to macro and micro factors based on actions taken by the company as well as region and global events. Equity investment is subject to risks. I or my clients or family members might have positions in the stocks that we mention in our educational posts. We will not be responsible for any Profit or loss that may occur due to any financial decision taken based on any data provided in this message. Do consult your investment advisor before taking any financial decisions. Stop losses should be an important part of any investment in equity.
nifty rangeHere’s a professional and engaging **TradingView post description** for a **Nifty range-bound market** scenario:
---
📊 **Nifty Index – Range-Bound Consolidation Ahead?** 🧭
Nifty is currently trading within a defined range, indicating indecision in the market. The index is facing resistance near **25000** and finding support around **24500**.
📌 **Key Observations:**
* Price action suggests a sideways trend with no clear breakout yet.
* Volumes are relatively lower, reinforcing the consolidation phase.
🛑 **Resistance:** 25000
✅ **Support:** 24500
🔍 A breakout on either side could trigger the next directional move. Until then, traders should focus on **range-bound strategies** like buying near support and selling near resistance, with tight stop-losses.
💬 What’s your view on Nifty's next move? Drop your analysis in the comments!
\#Nifty50 #NiftyAnalysis #NiftyRange #StockMarketIndia #TradingView #TechnicalAnalysis #NiftyOutlook #NSEIndia #BankNifty #PriceAction #NiftyLevels

Bull Rally Losing steam as international factors weigh in. The Bull rally that we saw in Nifty in the last one month or so is losing a little steam as international factors related to escalating Russia and Ukraine war and International Tariff war start to weigh in. This made it difficult for Nifty to hold on to levels above 25000 after making a high of 25116 in the current rally. After making a high it is any substantial rally would try to consolidate and find a reasonable bottom from where it can launch again. Verifying a solid support is necessary for rally to move forward.
The supports for Nifty currently are at: 24515, 24185 (Mother line important support), 23945, 23689 (Father line important support). If 23689 is broken the bears will be very active again and can potentially drag down nifty to 23214, 22902 or even 22666. So 24185 and 23689 are important levels for Nifty to hold.
The Resistances for Nifty currently are at: 24838, 25116 (Important Resistance level, recent high). Sustaining above 25116 and Nifty closing above it can enable next leg of the rally which can take us in future to next resistance levels of 25438, 25641, 25845 and 26K+ levels.
The market might be speculating Russian response to Ukraine Drone attack. The scale of Russian attack if it happens will determine the movement of market. The local factors are mostly in favour of Indian markets. So long term investors should not worry. Traders and short term investors should avoid taking unnecessary risk as situation on international front. Geo-Political risk in the subcontinent, at Israel front and Between Russia and other EU nations should be on the hindsight of any decision making. Additionally there are rising number of COVID cases in India which can also become a factor which can effect market sentiment.
Disclaimer: The above information is provided for educational purpose, analysis and paper trading only. Please don't treat this as a buy or sell recommendation for the stock or index. The Techno-Funda analysis is based on data that is more than 3 months old. Supports and Resistances are determined by historic past peaks and Valley in the chart. Many other indicators and patterns like EMA, RSI, MACD, Volumes, Fibonacci, parallel channel etc. use historic data which is 3 months or older cyclical points. There is no guarantee they will work in future as markets are highly volatile and swings in prices are also due to macro and micro factors based on actions taken by the company as well as region and global events. Equity investment is subject to risks. I or my clients or family members might have positions in the stocks that we mention in our educational posts. We will not be responsible for any Profit or loss that may occur due to any financial decision taken based on any data provided in this message. Do consult your investment advisor before taking any financial decisions. Stop losses should be an important part of any investment in equity.

Nifty Bounces from Channel Bottom. Amidst escalation in Ukraine and Russia tussle with Ukraine going on major Drone offensive and Russia likely to respond anytime this week. The escalation can lead to NATO involvement and this can spell a major downside for Global market. The above is just speculation and things can take a different trajectory as well. During such global negative news Indian markets made a low of 24526 but recovered 190 points to close near 24716. This shows the strength of Indian market and shows that we are quiet buoyant.
Resistance for Nifty Remain near: 24763 (Mother Line of Hourly Chart), 24887, 25041 (Mid channel resistance and 25151.
Supports For Nifty Currently remain at: 24637, 24519 (Parallel Channel Bottom) and 24474 (Father Line of Hourly Chart).
If we get a closing below 24474 Bears will have an upper hand and can drag market further down we give the downside levels if we reach there. If we get a closing above 25151 Bulls Will have an Upper hand and can pull the index further upwards we give further upside levels once we reach there.
Disclaimer: The above information is provided for educational purpose, analysis and paper trading only. Please don't treat this as a buy or sell recommendation for the stock or index. The Techno-Funda analysis is based on data that is more than 3 months old. Supports and Resistances are determined by historic past peaks and Valley in the chart. Many other indicators and patterns like EMA, RSI, MACD, Volumes, Fibonacci, parallel channel etc. use historic data which is 3 months or older cyclical points. There is no guarantee they will work in future as markets are highly volatile and swings in prices are also due to macro and micro factors based on actions taken by the company as well as region and global events. Equity investment is subject to risks. I or my clients or family members might have positions in the stocks that we mention in our educational posts. We will not be responsible for any Profit or loss that may occur due to any financial decision taken based on any data provided in this message. Do consult your investment advisor before taking any financial decisions. Stop losses should be an important part of any investment in equity.

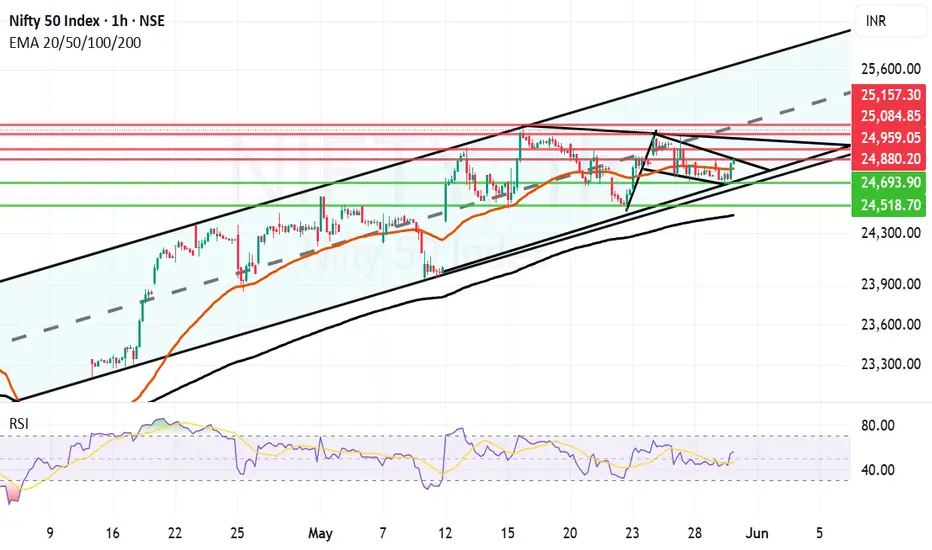
Flag and Pole kind of structure forming in Nifty. There is a very positive looking flag and pole kind of structure forming in Nifty hourly chart. This is within a parallel channel which Nifty has been following since April 15th 2025. This Flag and Pole breakout will come into effect if and only if we get a closing above 24880.
In case of flag and pole breakout happening the future resistances will be near 24959, 25084 and 25157. 25157 again will be a major resistance as it will be the mid of the channel.
The supports for Nifty in case the flag and pole breakout does not take effect are at 24804 (Mother line of hourly chart) 24693, 24518 and finally 24439.
Below 24439 bears can take over the market. Above 25157 Bulls can take over the market. Shadow of the candle is effectively neutral to positive.
Disclaimer: The above information is provided for educational purpose, analysis and paper trading only. Please don't treat this as a buy or sell recommendation for the stock or index. The Techno-Funda analysis is based on data that is more than 3 months old. Supports and Resistances are determined by historic past peaks and Valley in the chart. Many other indicators and patterns like EMA, RSI, MACD, Volumes, Fibonacci, parallel channel etc. use historic data which is 3 months or older cyclical points. There is no guarantee they will work in future as markets are highly volatile and swings in prices are also due to macro and micro factors based on actions taken by the company as well as region and global events. Equity investment is subject to risks. I or my clients or family members might have positions in the stocks that we mention in our educational posts. We will not be responsible for any Profit or loss that may occur due to any financial decision taken based on any data provided in this message. Do consult your investment advisor before taking any financial decisions. Stop losses should be an important part of any investment in equity.
Nifty feeling pressure, unable to sustain above 25K levels.Nifty not able to sustain levels above 25K is not a good news. Nifty has to sustain above 25094 level on daily and 25208 on weekly closing for further upward move. Market is not showing confidence due to daily tariff related news coming for global Power house US. So Volatility will remain for a while till everything falls in place.
Right now Nifty is resting near trend line support levels of 24731. If 24731 is broken Bears can drag Nifty towards 24469, 24067 (Mother line Support), 23899 or even 23637 (Father line support). If Nifty can sustain above 25094 then there is a possibility for up move towards 25208 or even 25446 levels. Things are delicately poised right now and proper Bear Vs Bull Tussle is going on.
Shadow of the candle is neutral to negative but any positive news on global front can change the tide in favour of Bulls.
Disclaimer: The above information is provided for educational purpose, analysis and paper trading only. Please don't treat this as a buy or sell recommendation for the stock or index. The Techno-Funda analysis is based on data that is more than 3 months old. Supports and Resistances are determined by historic past peaks and Valley in the chart. Many other indicators and patterns like EMA, RSI, MACD, Volumes, Fibonacci, parallel channel etc. use historic data which is 3 months or older cyclical points. There is no guarantee they will work in future as markets are highly volatile and swings in prices are also due to macro and micro factors based on actions taken by the company as well as region and global events. Equity investment is subject to risks. I or my clients or family members might have positions in the stocks that we mention in our educational posts. We will not be responsible for any Profit or loss that may occur due to any financial decision taken based on any data provided in this message. Do consult your investment advisor before taking any financial decisions. Stop losses should be an important part of any investment in equity.

Nifty Trying to Forge ahead after taking Mother Line Support.Nifty is trying to move upwards after taking Mother line support. However there are strong resistances which Nifty needs to conquer in order to move ahead substantially. These resistances are near 25094 and 25208.
Closing above 25208 will confirm the current trend which can tae Nifty close to 26K with other resistances at 25446, 25649 and 25810. Supports for Nifty currently are near 24820 (Mother line support), 24469, 24356 (Father line support) and 23899.
The direction of arrow is clear for medium term unless the arrow is broken on the down side. Nifty is currently forming a positive higher highs, higher lows pattern which is again a positive sign.
Disclaimer: The above information is provided for educational purpose, analysis and paper trading only. Please don't treat this as a buy or sell recommendation for the stock or index. The Techno-Funda analysis is based on data that is more than 3 months old. Supports and Resistances are determined by historic past peaks and Valley in the chart. Many other indicators and patterns like EMA, RSI, MACD, Volumes, Fibonacci, parallel channel etc. use historic data which is 3 months or older cyclical points. There is no guarantee they will work in future as markets are highly volatile and swings in prices are also due to macro and micro factors based on actions taken by the company as well as region and global events. Equity investment is subject to risks. I or my clients or family members might have positions in the stocks that we mention in our educational posts. We will not be responsible for any Profit or loss that may occur due to any financial decision taken based on any data provided in this message. Do consult your investment advisor before taking any financial decisions. Stop losses should be an important part of any investment in equity.
