NIFTY ANALYSIS FOR 14th September 2023-FOR EDUCATION PURPOSENIFTY ANALYSIS FOR 14th September 2023-FOR EDUCATION PURPOSE
This video is for educational purpose and my personal view . We are NOT SEBI registered Advisor, we only give the level on our practical trading experience. Kindly take the trade according to your risk and reward position and consulting your advisor. It is advisable to take the advice of SEBI registered advisor.
@vijayanjum
#nse
#nsebse
#Nifty
#niftyfifty
#bankniftytrading
#nfitybank
#niftypredictionfortomorrow
#niftyoptions
#NiftyBank
#nifty50
#nifty500
#niftytomorrow
#niftytoday
#NiftyCE
#bankniftyoptions
#sensex
#sensexindia
#sensextoday
#bankniftytips
#bankniftyanalysis
#bankniftytrading
#bankniftyoptions
#finnifty
#bankniftystrategies
#niftystrategies
#bse#bseindia
#bsesensex
#nsenifty
#nsebse
#nseindia
#STOCKMARKETEDUCATION
#STOCKMARKETUPTODATE
#STOCKMARKETTODAY
#stockmarkets
#tommorrowMarketPrediction
#nfityoutlookfornextweek
#bankniftyoutlookfornext week
#bankniftyoutlookformonday
#niftyforecast
#bankniftyforecast
#niftyshareprice
#bankniftyshareprice
#tommorrowniftyprediction
#tommorrobankniftypredicton
#niftytargettommrrow
#bankniftytargettommrrow
#bankniftylive
#banknifty
#bankniftyoptions
#bankniftystrategies
#bankniftyfuture
#bankniftyoptionstrategy
#bankniftycalls
#bankniftyintraday
#bankniftylivetrading
#bankniftyweeklyexpiry
#bankniftycrash
#bankniftytomorrow
#bankniftypredictions
#bankniftychart
#bankniftytips
#bankniftypremium
#bankniftyoptions
#bankniftyfuture
#bankniftytomorrowprediction
#bankniftyoption
#niftyweeklyexpiry
#stockmarketinindia
#derivatives
#niftypredictions
#niftytips
#bank nifty analysis,
#bank nifty prediction for tomorrow,
#bank nifty analysis for 13 july,
#bank nifty tomorrow,
#nifty prediction for tomorrow,
#nifty prediction,
#nifty analysis,
#banknifty tomorrow,
#bank nifty tomorrow analysis,
#nifty tomorrow,
#bank nifty analysis for tomorrow,
#nifty analysis for tomorrow,
#stock market crash,
#stock market latest news today,
#bank nifty live,
#live trading bank nifty,
#nifty live trading,
#live trading,
#bank nifty live trading
Nifty50

Nifty 50I took a trade based on My custom indicator at 5 mint chart, at the closing of the candle, at 11:05 Am, Nifty 14 Sep 19900 CE at a price Rs 133 with a stop loss of 15 points on option chart with No target, hold the position till Exit signal on My custom Indicator or till 15:10, 3:10 Pm.

NIFTY ANALYSIS FOR 13th September 2023-FOR EDUCATION PURPOSENIFTY ANALYSIS FOR 13th September 2023-FOR EDUCATION PURPOSE
This video is for educational purpose and my personal view . We are NOT SEBI registered Advisor, we only give the level on our practical trading experience. Kindly take the trade according to your risk and reward position and consulting your advisor. It is advisable to take the advice of SEBI registered advisor.
@vijayanjum
#nse
#nsebse
#Nifty
#niftyfifty
#bankniftytrading
#nfitybank
#niftypredictionfortomorrow
#niftyoptions
#NiftyBank
#nifty50
#nifty500
#niftytomorrow
#niftytoday
#NiftyCE
#bankniftyoptions
#sensex
#sensexindia
#sensextoday
#bankniftytips
#bankniftyanalysis
#bankniftytrading
#bankniftyoptions
#finnifty
#bankniftystrategies
#niftystrategies
#bse#bseindia
#bsesensex
#nsenifty
#nsebse
#nseindia
#STOCKMARKETEDUCATION
#STOCKMARKETUPTODATE
#STOCKMARKETTODAY
#stockmarkets
#tommorrowMarketPrediction
#nfityoutlookfornextweek
#bankniftyoutlookfornext week
#bankniftyoutlookformonday
#niftyforecast
#bankniftyforecast
#niftyshareprice
#bankniftyshareprice
#tommorrowniftyprediction
#tommorrobankniftypredicton
#niftytargettommrrow
#bankniftytargettommrrow
#bankniftylive
#banknifty
#bankniftyoptions
#bankniftystrategies
#bankniftyfuture
#bankniftyoptionstrategy
#bankniftycalls
#bankniftyintraday
#bankniftylivetrading
#bankniftyweeklyexpiry
#bankniftycrash
#bankniftytomorrow
#bankniftypredictions
#bankniftychart
#bankniftytips
#bankniftypremium
#bankniftyoptions
#bankniftyfuture
#bankniftytomorrowprediction
#bankniftyoption
#niftyweeklyexpiry
#stockmarketinindia
#derivatives
#niftypredictions
#niftytips
#bank nifty analysis,
#bank nifty prediction for tomorrow,
#bank nifty analysis for 13 july,
#bank nifty tomorrow,
#nifty prediction for tomorrow,
#nifty prediction,
#nifty analysis,
#banknifty tomorrow,
#bank nifty tomorrow analysis,
#nifty tomorrow,
#bank nifty analysis for tomorrow,
#nifty analysis for tomorrow,
#stock market crash,
#stock market latest news today,
#bank nifty live,
#live trading bank nifty,
#nifty live trading,
#live trading,
#bank nifty live trading

NIFTY updateNifty is not done yet as per this count and there's clearly more upside to be seen in coming weeks.
Alternatively an expanded flat in red wave iV cannot be ruled out for now, which however would still lead to more upside later.
I will update the chart as it develops further.
Thanks for reading!

#NIFTY INTRADAY TRADE SETUP Greetings Folks,
today i have prepared a setup of NIFTY
the analysis is as follows
- the market was undecisive today
- made a pattern with dynamic support and resistance
- it can breakout either side, either use a retest entry or a good volume breakout as confirmation
dont play with fire, always use predefined stoploss

Correction in Banknifty. Zig Zag, flat, triangle, Elliott Wave Analysis:-
A wave seems to be a Zig-Zag A wave .
B wave to be a connecting wave .
C wave to be extended wave of Zig-Zag C wave
If it didn't break 46369, if broken the 46369 then the flat takes place and zig zag leave the place.
.
View 1:-
Regular flat
If it did not break B wave and breaks the low of A wave then the flat is regular flat and it may be considered as a C wave of previous zig zag wave ..
View 2:-
Triangle pattern
Either the B wave high has crossed or not it the C wave didn't break the low of A wave and it consolidates between A and B wave's .This would lead to Triangle pattern .
I'm not a SEBI registered advisor.
Kindly before taking a trade do your research/ consult your financial advisor.

nifty pre market analysis12 SEP ANALYSIS:
Daily analysis:
PS-Position size
Nifty opens:
side: if it gives breakout buy(50)
gapup: see further priceaction
gapdown: will see further price-action, will sell if gives breakdown

Consolidation needs after making a historic new high. Nifty made a new high today and crossed 20K for the first time making a high of 20008.15 however Nifty could not sustain the levels and closed below 20000 at 19996.35. Point number 1 is Closing above 20008.15 is important now to grow further. Second point it RSI in the hourly chart indicates that the index is overbought. On daily charts the indicates that there is some more legroom for Nifty to go ahead perhaps towards 20203 and 20400 levels in the medium term. Supports for Nifty are at 19867, 19720 and 19516. Final support for Nifty closing below which the trend can change is 19385 (Major Support). Some correction or consolidation before rampaging ahead will not be such a great thing for sustainable progress. There is long way to go but let us not get carried away. Alway have a feet on the ground approach guard your capital by by putting stop losses and guard your profits by putting trailing stop losses. In uncharted territories Stop losses and trailing stop losses will always prove to be your best friends.
NIFTY ANALYSIS FOR 12th September 2023-FOR EDUCATION PURPOSENIFTY ANALYSIS FOR 12th September 2023-FOR EDUCATION PURPOSE
This video is for educational purpose and my personal view . We are NOT SEBI registered Advisor, we only give the level on our practical trading experience. Kindly take the trade according to your risk and reward position and consulting your advisor. It is advisable to take the advice of SEBI registered advisor.
@vijayanjum
#nse
#nsebse
#Nifty
#niftyfifty
#bankniftytrading
#nfitybank
#niftypredictionfortomorrow
#niftyoptions
#NiftyBank
#nifty50
#nifty500
#niftytomorrow
#niftytoday
#NiftyCE
#bankniftyoptions
#sensex
#sensexindia
#sensextoday
#bankniftytips
#bankniftyanalysis
#bankniftytrading
#bankniftyoptions
#finnifty
#bankniftystrategies
#niftystrategies
#bse#bseindia
#bsesensex
#nsenifty
#nsebse
#nseindia
#STOCKMARKETEDUCATION
#STOCKMARKETUPTODATE
#STOCKMARKETTODAY
#stockmarkets
#tommorrowMarketPrediction
#nfityoutlookfornextweek
#bankniftyoutlookfornext week
#bankniftyoutlookformonday
#niftyforecast
#bankniftyforecast
#niftyshareprice
#bankniftyshareprice
#tommorrowniftyprediction
#tommorrobankniftypredicton
#niftytargettommrrow
#bankniftytargettommrrow
#bankniftylive
#banknifty
#bankniftyoptions
#bankniftystrategies
#bankniftyfuture
#bankniftyoptionstrategy
#bankniftycalls
#bankniftyintraday
#bankniftylivetrading
#bankniftyweeklyexpiry
#bankniftycrash
#bankniftytomorrow
#bankniftypredictions
#bankniftychart
#bankniftytips
#bankniftypremium
#bankniftyoptions
#bankniftyfuture
#bankniftytomorrowprediction
#bankniftyoption
#niftyweeklyexpiry
#stockmarketinindia
#derivatives
#niftypredictions
#niftytips
#bank nifty analysis,
#bank nifty prediction for tomorrow,
#bank nifty analysis for 13 july,
#bank nifty tomorrow,
#nifty prediction for tomorrow,
#nifty prediction,
#nifty analysis,
#banknifty tomorrow,
#bank nifty tomorrow analysis,
#nifty tomorrow,
#bank nifty analysis for tomorrow,
#nifty analysis for tomorrow,
#stock market crash,
#stock market latest news today,
#bank nifty live,
#live trading bank nifty,
#nifty live trading,
#live trading,
#bank nifty live trading

NIFTY INTRADAY LEVELS FOR 11/09/2023BUY ABOVE - 19860
SL - 19830
TARGETS - 19900,19950,20000
SELL BELOW - 19820
SL - 19850
TARGETS - 19765,19730,19680
Previous Day High - 19860
Previous Day Low - 19730
I am sharing NIFTY levels this levels acts as important support & resistance for intraday. if you want to trade with this levels wait for 15 min Candle closing above that levels. You can trade with breakout and reversal both.
In this channel, I share my expertise in trading strategies, technical analysis, and market trends to help you make informed decisions in your trading ventures.
Stay tuned for daily updates, in-depth market analyses, and real-time trading scenarios to witness firsthand how we transform from Zero to Hero in the trading world. My Only aim is to empower you with the knowledge and skills necessary to navigate the complexities of the financial markets successfully.
Based on price action major support & resistance's are here, the red lines acts as resistances, the green lines acts as supports. If the price breaks the support/resistance, it will move to the next support/resistance line. White lines indicates previous day high & low, high acts as a resistance & low acts as a support for next day.
Please NOTE: this levels are for intraday trading only.
Disclaimer - All information on this page is for educational purposes only,
we are not SEBI Registered, Please consult a SEBI registered financial advisor for your financial matters before investing And taking any decision. We are not responsible for any profit/loss you made.
Request your support and engagement by liking and commenting & follow to provide encouragement
HAPPY TRADING 👍

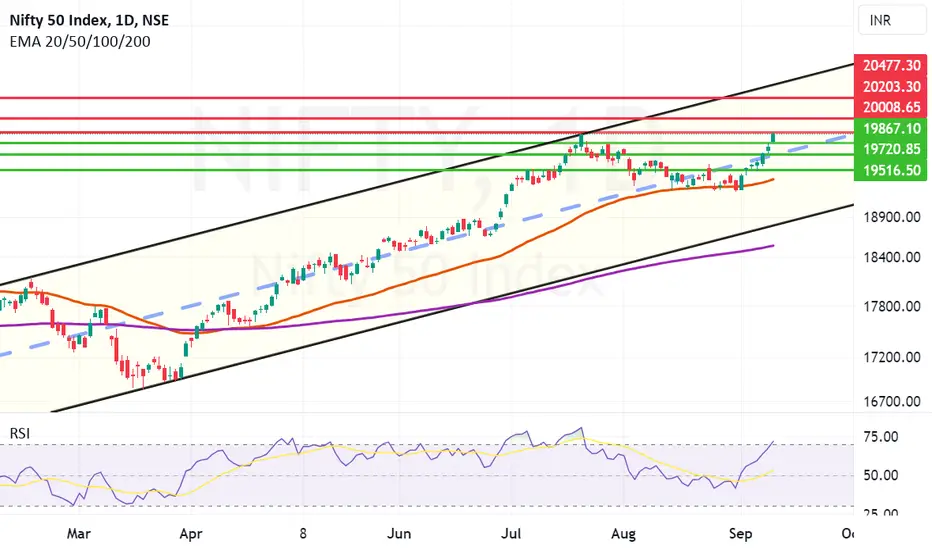
NIFTY back in the channel NSE:NIFTY From the 15-31 March reversal, Nifty remained in uptrend and created the channel.
Between 4-14 July tried to break out from the upper end of the channel and moved out on 17th July, but soon derailed and got inside the channel, eventually also broke down the lower end of the channel around 14-18 August.
Today it is trying to get into the channel, and if remains successfully inside the channel, 20500 can be touched in September expiry, while giving good opportunity for put writing.

Indian Oil: % years Inverse Head and Shoulder BreakoutIOC has been in an Inverted H&S pattern formation since March 2018 which it completed in July 2023. Inverted H&S patterns often implicate a bullish run post pattern breakout and they become crucial specially when the pattern is in formation phase for dew years.
IOC replicates a similar view and the stock has given a breakout in May 2023.
The run still continues supported with high crude oil prices as well. With a long term view the stock seems to go upto 129 levels in few months from now. (Given the pattern is observed in monthly chart)

A proper Breakout above the mid channel resistance for NiftyNifty has given a proper Breakout above the mid channel resistance showing bullish momentum. 20,000 points on Nifty along with G-20 can be the theme for the next week. For this to happen there are 2 important resistances which Nifty has to cross. These resistances are 19867 and 19991. Supports on the lower side for Nifty in case the breakout fails will be at 19720, 19516, 19360 and 19223. Trend changes to negative in case we get a closing below 19223.

NIFTY ANALYSIS FOR 11th September 2023-FOR EDUCATION PURPOSENIFTY ANALYSIS FOR 11th September 2023-FOR EDUCATION PURPOSE
This video is for educational purpose and my personal view . We are NOT SEBI registered Advisor, we only give the level on our practical trading experience. Kindly take the trade according to your risk and reward position and consulting your advisor. It is advisable to take the advice of SEBI registered advisor.
@vijayanjum
#nse
#nsebse
#Nifty
#niftyfifty
#bankniftytrading
#nfitybank
#niftypredictionfortomorrow
#niftyoptions
#NiftyBank
#nifty50
#nifty500
#niftytomorrow
#niftytoday
#NiftyCE
#bankniftyoptions
#sensex
#sensexindia
#sensextoday
#bankniftytips
#bankniftyanalysis
#bankniftytrading
#bankniftyoptions
#finnifty
#bankniftystrategies
#niftystrategies
#bse#bseindia
#bsesensex
#nsenifty
#nsebse
#nseindia
#STOCKMARKETEDUCATION
#STOCKMARKETUPTODATE
#STOCKMARKETTODAY
#stockmarkets
#tommorrowMarketPrediction
#nfityoutlookfornextweek
#bankniftyoutlookfornext week
#bankniftyoutlookformonday
#niftyforecast
#bankniftyforecast
#niftyshareprice
#bankniftyshareprice
#tommorrowniftyprediction
#tommorrobankniftypredicton
#niftytargettommrrow
#bankniftytargettommrrow
#bankniftylive
#banknifty
#bankniftyoptions
#bankniftystrategies
#bankniftyfuture
#bankniftyoptionstrategy
#bankniftycalls
#bankniftyintraday
#bankniftylivetrading
#bankniftyweeklyexpiry
#bankniftycrash
#bankniftytomorrow
#bankniftypredictions
#bankniftychart
#bankniftytips
#bankniftypremium
#bankniftyoptions
#bankniftyfuture
#bankniftytomorrowprediction
#bankniftyoption
#niftyweeklyexpiry
#stockmarketinindia
#derivatives
#niftypredictions
#niftytips
#bank nifty analysis,
#bank nifty prediction for tomorrow,
#bank nifty analysis for 13 july,
#bank nifty tomorrow,
#nifty prediction for tomorrow,
#nifty prediction,
#nifty analysis,
#banknifty tomorrow,
#bank nifty tomorrow analysis,
#nifty tomorrow,
#bank nifty analysis for tomorrow,
#nifty analysis for tomorrow,
#stock market crash,
#stock market latest news today,
#bank nifty live,
#live trading bank nifty,
#nifty live trading,
#live trading,
#bank nifty live trading

expanding flat in APPLEElliott Wave Analysis:-
View:-
A irregular flat has formed and currently the C wave is forming.
if it didn't break 123 level then this will be expanded flat
and if it breaks the level then it will be expanded running flat which may extend to 108.
we can accumulate little here and a bit more in level 2 and bit more in level 3.
3 crucial level's ;-
level 1:- 169
level 2:- 140-152
level 3:- 104
An alternative view will be published.
I'm not a SEBI registered advisor.
Kindly before taking a trade do your research/ consult your financial advisor.

Bullish Breakout faces one major resistance.Bullish Breakout faces one major and steep resistance near 19736. If this resistance is crossed pathway towards 20K clears again. With resistances remaining at 19811, 19866, 19991 and finally 20019. Supports for Nifty on the lower side remains at 19674, 19590, 19514 and 19445. Things are looking good right now but these hurdles mentioned above need to be crossed.

NIFTY ANALYSIS FOR 8th September 2023-FOR EDUCATION PURPOSENIFTY ANALYSIS FOR 8th September 2023-FOR EDUCATION PURPOSE
This video is for educational purpose and my personal view . We are NOT SEBI registered Advisor, we only give the level on our practical trading experience. Kindly take the trade according to your risk and reward position and consulting your advisor. It is advisable to take the advice of SEBI registered advisor.
@vijayanjum
#nse
#nsebse
#Nifty
#niftyfifty
#bankniftytrading
#nfitybank
#niftypredictionfortomorrow
#niftyoptions
#NiftyBank
#nifty50
#nifty500
#niftytomorrow
#niftytoday
#NiftyCE
#bankniftyoptions
#sensex
#sensexindia
#sensextoday
#bankniftytips
#bankniftyanalysis
#bankniftytrading
#bankniftyoptions
#finnifty
#bankniftystrategies
#niftystrategies
#bse#bseindia
#bsesensex
#nsenifty
#nsebse
#nseindia
#STOCKMARKETEDUCATION
#STOCKMARKETUPTODATE
#STOCKMARKETTODAY
#stockmarkets
#tommorrowMarketPrediction
#nfityoutlookfornextweek
#bankniftyoutlookfornext week
#bankniftyoutlookformonday
#niftyforecast
#bankniftyforecast
#niftyshareprice
#bankniftyshareprice
#tommorrowniftyprediction
#tommorrobankniftypredicton
#niftytargettommrrow
#bankniftytargettommrrow
#bankniftylive
#banknifty
#bankniftyoptions
#bankniftystrategies
#bankniftyfuture
#bankniftyoptionstrategy
#bankniftycalls
#bankniftyintraday
#bankniftylivetrading
#bankniftyweeklyexpiry
#bankniftycrash
#bankniftytomorrow
#bankniftypredictions
#bankniftychart
#bankniftytips
#bankniftypremium
#bankniftyoptions
#bankniftyfuture
#bankniftytomorrowprediction
#bankniftyoption
#niftyweeklyexpiry
#stockmarketinindia
#derivatives
#niftypredictions
#niftytips
#bank nifty analysis,
#bank nifty prediction for tomorrow,
#bank nifty analysis
#bank nifty tomorrow,
#nifty prediction for tomorrow,
#nifty prediction,
#nifty analysis,
#banknifty tomorrow,
#bank nifty tomorrow analysis,
#nifty tomorrow,
#bank nifty analysis for tomorrow,
#nifty analysis for tomorrow,
#stock market crash,
#stock market latest news today,
#bank nifty live,
#live trading bank nifty,
#nifty live trading,
#live trading,
#bank nifty live trading

Nifty looking Bullish but approaching a major resistance zone. Nifty is looking Bullish but approaching a major resistance zone. The zone between 19637 and 19680 is a strong resistance for Nifty. Once we get a closing above 19680 the channel towards 19764, 19811, 19866 and previous high of Nifty 19991 and new high will open up. Until then the supports for Nifty will be 19585 (Not a strong support) and 19492. The zone between 19469 and 19430 is now a strong support zone. Overall sentiment of Nifty is looking bullish but lot of sectors and indices are starting to look a little bit overbought on RSI so please keep your stop losses handy.

NIFTY ANALYSIS FOR 7th September 2023-FOR EDUCATION PURPOSENIFTY ANALYSIS FOR 7th September 2023-FOR EDUCATION PURPOSE
This video is for educational purpose and my personal view . We are NOT SEBI registered Advisor, we only give the level on our practical trading experience. Kindly take the trade according to your risk and reward position and consulting your advisor. It is advisable to take the advice of SEBI registered advisor.
@vijayanjum
#nse
#nsebse
#Nifty
#niftyfifty
#bankniftytrading
#nfitybank
#niftypredictionfortomorrow
#niftyoptions
#NiftyBank
#nifty50
#nifty500
#niftytomorrow
#niftytoday
#NiftyCE
#bankniftyoptions
#sensex
#sensexindia
#sensextoday
#bankniftytips
#bankniftyanalysis
#bankniftytrading
#bankniftyoptions
#finnifty
#bankniftystrategies
#niftystrategies
#bse#bseindia
#bsesensex
#nsenifty
#nsebse
#nseindia
#STOCKMARKETEDUCATION
#STOCKMARKETUPTODATE
#STOCKMARKETTODAY
#stockmarkets
#tommorrowMarketPrediction
#nfityoutlookfornextweek
#bankniftyoutlookfornext week
#bankniftyoutlookformonday
#niftyforecast
#bankniftyforecast
#niftyshareprice
#bankniftyshareprice
#tommorrowniftyprediction
#tommorrobankniftypredicton
#niftytargettommrrow
#bankniftytargettommrrow
#bankniftylive
#banknifty
#bankniftyoptions
#bankniftystrategies
#bankniftyfuture
#bankniftyoptionstrategy
#bankniftycalls
#bankniftyintraday
#bankniftylivetrading
#bankniftyweeklyexpiry
#bankniftycrash
#bankniftytomorrow
#bankniftypredictions
#bankniftychart
#bankniftytips
#bankniftypremium
#bankniftyoptions
#bankniftyfuture
#bankniftytomorrowprediction
#bankniftyoption
#niftyweeklyexpiry
#stockmarketinindia
#derivatives
#niftypredictions
#niftytips
#bank nifty analysis,
#bank nifty prediction for tomorrow,
#bank nifty analysis for 13 july,
#bank nifty tomorrow,
#nifty prediction for tomorrow,
#nifty prediction,
#nifty analysis,
#banknifty tomorrow,
#bank nifty tomorrow analysis,
#nifty tomorrow,
#bank nifty analysis for tomorrow,
#nifty analysis for tomorrow,
#stock market crash,
#stock market latest news today,
#bank nifty live,
#live trading bank nifty,
#nifty live trading,
#live trading,
#bank nifty live trading

Next 3 resistances very critical for nifty. Next 3 resistances very critical for Nifty to reach 20K levels. These resistances are at 19585, 19646 and finally 19680. Crossing these zones will trigger further euphoria in Nifty and we may see it go towards 19764 and it may even the previous highs. however lot of indices like small and Mid cap are nearing or already reached the overbought zones so investors should remain cautious and use trailing stop losses which can be best friends who protect capital and profits. Supports on the lower side are 19525, 19492, 19455 to 19421 zone can also be good support. Below 19421 the Nifty will again become weak and bears will try to regain the controls.

MAHLOGMAHLOG Just today crossed 200 EMA , And is ready for the very long target.
And also create a CUP pattern.

#NIFTY Intraday Support and Resistance Levels - 05/09/2023Nifty will be gap up opening in today's session. After opening nifty sustain above 19560 level and then possible upside rally up to 19680 in today's session. in case nifty trades below 19510 level then the downside target can go up to the 19390 level.

Good Breakout in Nifty sustaining above 19492 will be important.Nifty gave very good closing above a trend line which was blocking Nifty since it made the new high. Now sustaining above 19492 will be very important. If Nifty sustains the level the next targets for Nifty will be 19545, 19588, 19646, 19680 and above. Supports on the lower side are 19492, 19455, 19410 and finally 19395.
