How India's Market performed during war like situtation ?espite facing wars, cross-border tensions, and unexpected shocks, the Indian stock market has consistently demonstrated remarkable resilience.
🔹 Kargil War (May–July 1999)
Index declined 9.3% from 1,084 to 916 but rebounded sharply — hitting 1,201 the next month, and soaring 40%+ by war's end.
🔹 Surgical Strikes (September 2016)
Short-term 1–2% dip, with a deeper 12.9% correction by November 2016. But markets recovered strongly, rallying 22%+ over the next 3 months.
🔹 Cross-border Tensions (February 2019)
Small dip of 1–2%, with Nifty swiftly rebounding from 10,500 levels in February to above 12,100 by June.
📊 The message is clear:
Short-term volatility happens.
Long-term resilience wins.
Stay invested. Stay informed.
Trust the process.
Nifty50

Despite Geo-Political tensions, Nifty closes above Mother line. It was quite remarkable for Nifty to close above the Mother line (50 Hours EMA) despite the Geo-Political tensions and brewing storm of escalations at border. This shows the character of not only Indian market but the resilience of India as a nation. In yesterday's post itself we had mentioned that strong technical resistance has been reached. Add the tension and intent of India to fight against terrorism so it was a perfect recipe for a major fall. Which may happen if things escalate further next week but recovering from 23847 and to close above 24K at 24039 shows that when things will be back to normal the indices will bounce back. Resistance for Nifty now remain at 24096, 24335 and 24504. Supports for Nifty remain at 23914 (Major Mother line support) of 50 Hours EMA, 23800, 23530 and finally 23363.
While Long term players, FII, HNI and DII look at such opportunities to invest for Retail trader it becomes very difficult to control their emotions in such an environment of Geo-political pressure and then we saw a huge fall in the market. The opportunity was seized by both DII and FII with both hands as both turned net buyers for Rs.6492+ Crores. So traders / investors should always avoid knee jerk reactions. Who knows what happens during the weekend the support and resistance levels to watch out for are already mentioned in the message.
Disclaimer: The above information is provided for educational purpose, analysis and paper trading only. Please don't treat this as a buy or sell recommendation for the stock or index. The Techno-Funda analysis is based on data that is more than 3 months old. Supports and Resistances are determined by historic past peaks and Valley in the chart. Many other indicators and patterns like EMA, RSI, MACD, Volumes, Fibonacci, parallel channel etc. use historic data which is 3 months or older cyclical points. There is no guarantee they will work in future as markets are highly volatile and swings in prices are also due to macro and micro factors based on actions taken by the company as well as region and global events. Equity investment is subject to risks. I or my clients or family members might have positions in the stocks that we mention in our educational posts. We will not be responsible for any Profit or loss that may occur due to any financial decision taken based on any data provided in this message. Do consult your investment advisor before taking any financial decisions. Stop losses should be an important part of any investment in equity.
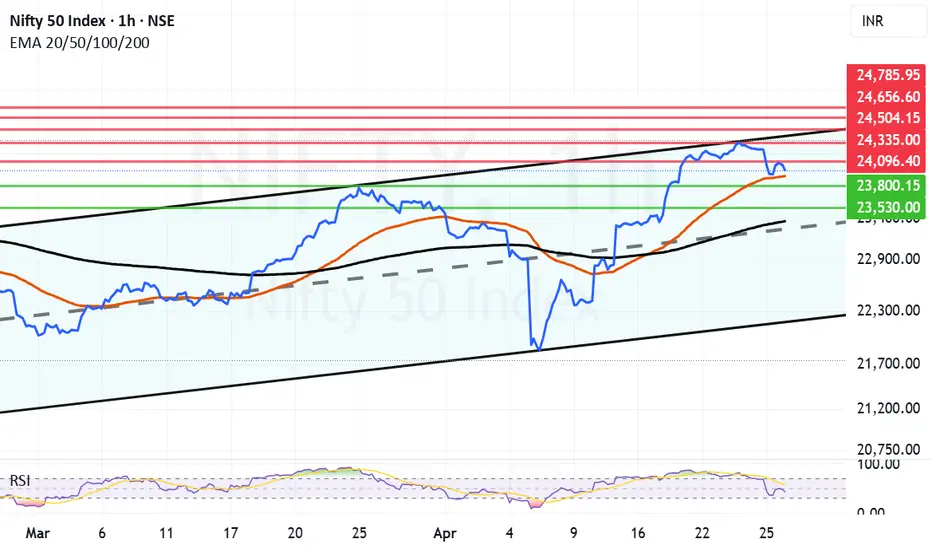
Nifty has hit a channel top with geopolitical events unravellingNifty was swiftly recovering after the Tariff war induced fall. On technical front Nifty has hit a channel top In the hourly line chart. Chanel tops are not easy to conquer and we saw Nifty retrieving today from there. Adding pressure to the rally is the Geo-Political situation after the Dastardly Pahalgam Terrorist Attack. If there is any action by India like Balakot (Swift and fast) any way it will be denied by Pakistan so nothing much will happen to Index. If there is only Political/Geopolitical long term steps taken again it will have less effect on the market. Market may decline drastically only if there is a full blown war between the 2 countries or more than 2 countries. (Possibility of that happening is less but we never know). Not much is in our hand if such a scenario arises. FIIs were seen buying big today so that is something to watchout in the coming days.
Technical Supports for Nifty remain at: 24096, 23882 (Mother Line Support), 23800 and 23316 (Father Line Support). (Mid channel support is also around 23300) so this zone presents a strong support zone.
Technical Resistances Remain at: 24335 (Major Channel Top Resistance), 24504, 24656 and 24785.
Disclaimer: The above information is provided for educational purpose, analysis and paper trading only. Please don't treat this as a buy or sell recommendation for the stock or index. The Techno-Funda analysis is based on data that is more than 3 months old. Supports and Resistances are determined by historic past peaks and Valley in the chart. Many other indicators and patterns like EMA, RSI, MACD, Volumes, Fibonacci, parallel channel etc. use historic data which is 3 months or older cyclical points. There is no guarantee they will work in future as markets are highly volatile and swings in prices are also due to macro and micro factors based on actions taken by the company as well as region and global events. Equity investment is subject to risks. I or my clients or family members might have positions in the stocks that we mention in our educational posts. We will not be responsible for any Profit or loss that may occur due to any financial decision taken based on any data provided in this message. Do consult your investment advisor before taking any financial decisions. Stop losses should be an important part of any investment in equity.

1/A wave done on the upside. 2/B down underway?Too early to say but NSE:NIFTY seem to have completed wave 1/A and has potentially started wave 2/B down which should hit 23400-23300 zone at the minimum, which happens to be 38.6% retracement of the rise 1/A.

Nifty - Ready to ride to 30k?Alright guys, I’ve been getting this a lot — ‘What’s up with Nifty 50- Though am a pure crypto guy but onto the request i would analyse the index, and i feel its very bullish! And i searched some problem is there if someone analyse it - Its just a educational chart!! So the alleged doesnt disturb me lol.
This is a market profile
After a sharp correction earlier in April, the index formed a base with tightly packed POCs and balanced value areas between 22,400–23,400 levels. This region acted as a strong accumulation zone. Post that, a sharp breakout above the previous VAH (Value Area High) occurred, and price has now cleanly auctioned above 24,000. What’s impressive is the most recent structure: the POC, VAL, and VAH have all shifted higher in alignment, suggesting that acceptance at higher prices is taking place. The current POC at around 24,100 further validates that market participants are comfortable building volume at elevated levels. Unless we fall back below 23,800–23,900 (which is now a key demand zone), Nifty 50 is showing strength and could attempt the 24,400–24,600 range in the upcoming sessions.

Another remarkable leap by Nifty. Channel top approaching. Nifty gained some serious ground again today closing 273.9 points up from previous close. The zone between 24202 and 24479 is the zone which stand between full blown Bull rally and some consolidation. The regressing parallel channel which started after Nifty made a high 26277 can be overcome if we get a closing above 24366. Immediate resistance is near 24202 before we reach there. Once we get a weekly closing above 24479 Bulls will take total control of the market. In such a scenario the Nifty can find resistance near 24830 before it can regain 25K levels.
If Nifty fails to conquer 24202, 24366 or 24479 then the supports will be near 23786. Bears can come back in picture if we get a closing above 23786. In such a scenario Mother and Father lines of hourly chart will play the supporting role at 23411 and 23101. Again near 23101 in addition to the Father line there is also Mid-Channel support thus this level should be considered a major support zone.
Since RSI of hourly chart is above 80 there is a chance of slight correction and consolidation which should also be looked at while taking fresh positions. RSI above 80 indicates that the positions might be just slightly be in the overbought zone.
Disclaimer: The above information is provided for educational purpose, analysis and paper trading only. Please don't treat this as a buy or sell recommendation for the stock or index. The Techno-Funda analysis is based on data that is more than 3 months old. Supports and Resistances are determined by historic past peaks and Valley in the chart. Many other indicators and patterns like EMA, RSI, MACD, Volumes, Fibonacci, parallel channel etc. use historic data which is 3 months or older cyclical points. There is no guarantee they will work in future as markets are highly volatile and swings in prices are also due to macro and micro factors based on actions taken by the company as well as region and global events. Equity investment is subject to risks. I or my clients or family members might have positions in the stocks that we mention in our educational posts. We will not be responsible for any Profit or loss that may occur due to any financial decision taken based on any data provided in this message. Do consult your investment advisor before taking any financial decisions. Stop losses should be an important part of any investment in equity.

Nifty Closes 1000 Points Higher – Will It Catch Up with BNFIn a strong move, Nifty 50 surged by 1000 points to close at 23,851, compared to last week’s close. The index made a weekly high of 23,872 and a low of 23,207. As highlighted in last week's analysis, a breakout above 23,400 could push Nifty toward 23,900 — a target it missed by just 23 points.
However, an intriguing divergence has emerged between Nifty and Bank Nifty. While Bank Nifty has scaled a new all-time high, Nifty still trades significantly below its previous all-time high of 26,277. This sets the stage for an interesting dynamic: Will Nifty rally to close the gap, or will Bank Nifty face a correction?
What to Expect Next Week?
For the upcoming week, Nifty is expected to trade in a range between 23,200 and 24,414. Despite the bullish signals on the daily and weekly timeframes, the monthly chart remains weak, indicating that volatility is likely to persist until a broader trend confirmation.
S&P 500 Outlook: Bounce or Breakdown?
The S&P 500 index saw a mild pullback, closing around 80 points lower from the previous week’s close of 5,363. Our “sell on rise” strategy mentioned last week worked well, as the index dipped post-rally.
Now, things get technically interesting. On the weekly chart, the S&P 500 is forming a potential bullish W pattern and an inside bar. A breakout above the previous week's high of 5,481 could trigger upward targets of 5,551, 5,637, and 5,679.
However, on the downside, a break below 5,115 would reintroduce bearish pressure, which could have negative ripple effects across global markets.
Key Market Takeaways:
Nifty 50: Strong rally, but still below ATH. Watch 23,200–24,414 range next week.
Bank Nifty: At ATH, diverging from Nifty – crucial to monitor.
S&P 500: At a technical crossroads – potential for breakout or breakdown

SBI: Inverse H&S BreakoutThe Inverse Head and Shoulders pattern is a bullish reversal chart pattern that signals a potential trend reversal from bearish to bullish. It consists of three key components:
Structure of the Pattern:
Left Shoulder: A price decline followed by a temporary rally.
Head: A deeper decline forming the lowest point, followed by another rally.
Right Shoulder: A decline similar in size to the left shoulder but not as deep as the head, followed by a move higher.
Neckline: A resistance level that connects the highs of the two rallies after the left shoulder and head.
The Inverse Head and Shoulders pattern in SBI, with a neckline at ₹783, indicates a potential bullish reversal. The stock has formed a well-defined left shoulder, head, and right shoulder, suggesting that selling pressure is weakening. The target price for this breakout is ₹900 calculated by measuring the distance from the head’s low to the neckline and projecting it upwards. If the stock sustains above the neckline, it could gain further momentum. However, traders should consider placing a stop-loss at 730 to manage risk in case of a failed breakout.

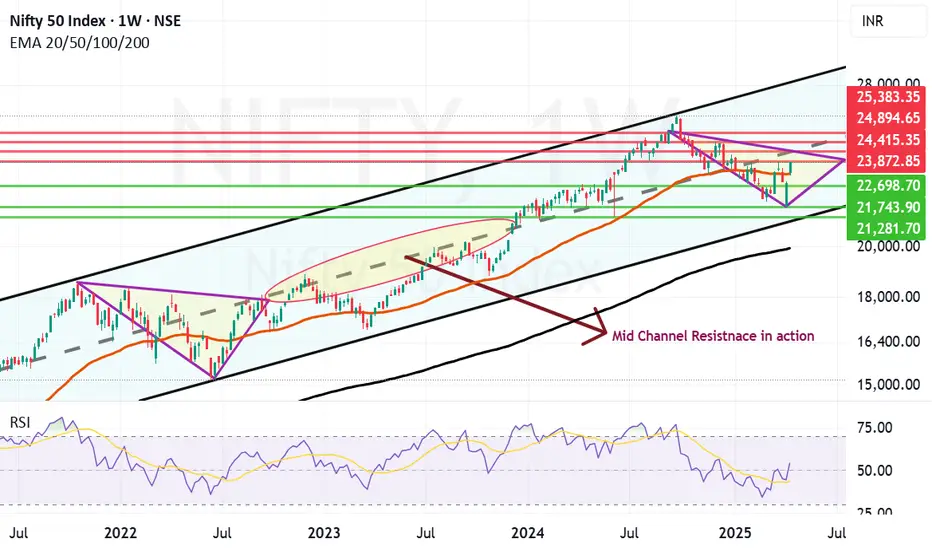
Nifty Parallel Channel and how things are shaping up. Nifty has closed strongly above the Mother line of Weekly chart this week. This should be considered a solid come back by Indian markets after the Trump Tariff induced fall. Indian economy is showing it's capability to bounce back on the back of strong rally in most of the sectors other than IT. Uncertainty in IT still looms as below par results that have started coming for might TCS and INfosys. We have a long weekend and uncertainties due to various announcements by global leaders regarding Tariffs can still spoil the party so one needs to be cautious in carrying huge positions over night and over the week especially in F&O trades.
Nifty travelling in a Parallel channel depicted above since 2020 is just below its Mid channel resistance at 24415. If you want to see the power of Mid Channel resistnace look at how it stopped Nifty between August 22 to December 23 below it. So Mid-channel resistnace should never be taken lightly. The area is depicted in the chart for your better understanding. Even before we reach that point of major resistance, Nifty has to counter strong resistance which was high of today and this week at 23872. Closing above 24415 can enable and empower Bulls to further push Nifty towards 24894, 25K and 25383 levels if the rally continues.
To know more about Parallel channel and how this Technical tool can be used to create wealth in stock market , you need to read my book The Happy Candles Way To Wealth creation. It is a highly rated book have a look at various reviews of the readers on Amazon. Both paperback and Kindle versions of the same are available on Amazon.
Nifty supports in case it is not able to cross and close above the resistnace zone of 23872 and 24415 will be 23272 (Strong Mother Line Weekly Support or 50 Weeks EMA) and 22698. A closing below 22698 in case of some adverse news or global development can empower the bears and can have potential to drag Nifty towards recent low of 21743 or 52 week low of 21281.
As of now things looking good but we have to wait and see the global and local developments over the weekend.
Disclaimer: The above information is provided for educational purpose, analysis and paper trading only. Please don't treat this as a buy or sell recommendation for the stock or index. The Techno-Funda analysis is based on data that is more than 3 months old. Supports and Resistances are determined by historic past peaks and Valley in the chart. Many other indicators and patterns like EMA, RSI, MACD, Volumes, Fibonacci, parallel channel etc. use historic data which is 3 months or older cyclical points. There is no guarantee they will work in future as markets are highly volatile and swings in prices are also due to macro and micro factors based on actions taken by the company as well as region and global events. Equity investment is subject to risks. I or my clients or family members might have positions in the stocks that we mention in our educational posts. We will not be responsible for any Profit or loss that may occur due to any financial decision taken based on any data provided in this message. Do consult your investment advisor before taking any financial decisions. Stop losses should be an important part of any investment in equity.
Nifty near the trendline resistance now after another good day.Nifty has cleared the 200 days EMA or the Father line on Daily chart. But in the hourly chart depicted here has hit a resistance zone which happens to be a trend line resistance.
RSI of Nifty is currently above 73 and the scope for upside is there but limited. With a shortened week tomorrow we will have a weekly closing. So a positive closing tomorrow can place us in a good space for a next week. However with everchanging trade war scenario it is difficult to guess if investors will encash their long positions or carry them forward into the next week.
The next resistances for Nifty remain at 23456, 23621, 23713, 23784 and 23915 before Nifty regains 24K levels. The support zones for Nifty remain at 23292, 23156, (Mother and Father lines of hourly chart are close by near) 23017 and 22980. So this zone will be a strong support. A closing below 22980 can drag Nifty down towards 22771 or even 22361 region.
Also one must keep an eye on Reliance result tomorrow. As it is a index power house it can single handedly make or break the weekly closing. Flat or positive closing tomorrow will be very helpful for the bull run to continue.
Disclaimer:The above information is provided for educational purpose, analysis and paper trading only. Please don't treat this as a buy or sell recommendation for the stock or index. The Techno-Funda analysis is based on data that is more than 3 months old. Supports and Resistances are determined by historic past peaks and Valley in the chart. Many other indicators and patterns like EMA, RSI, MACD, Volumes, Fibonacci, parallel channel etc. use historic data which is 3 months or older cyclical points. There is no guarantee they will work in future as markets are highly volatile and swings in prices are also due to macro and micro factors based on actions taken by the company as well as region and global events. Equity investment is subject to risks. I or my clients or family members might have positions in the stocks that we mention in our educational posts. We will not be responsible for any Profit or loss that may occur due to any financial decision taken based on any data provided in this message. Do consult your investment advisor before taking any financial decisions. Stop losses should be an important part of any investment in equity.

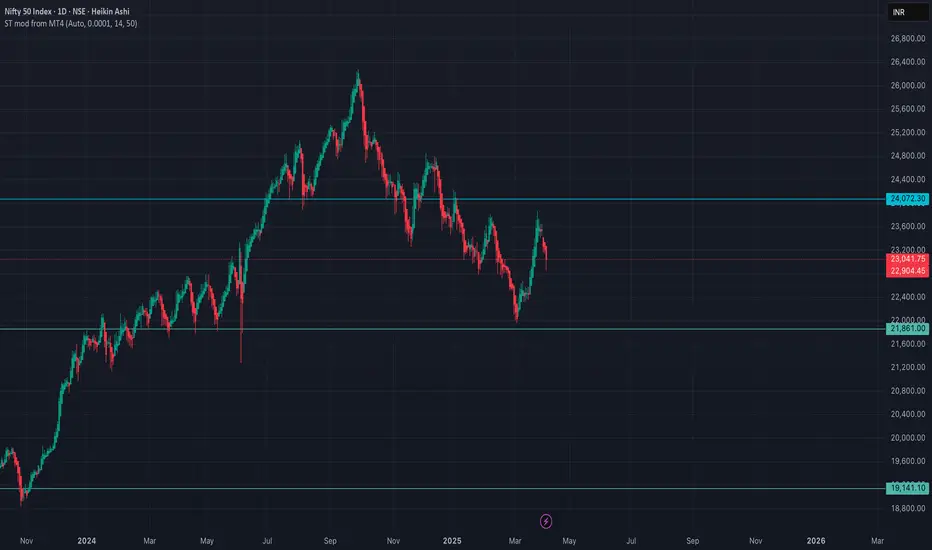
March Pain Point in $NSE:NIFTY | Best Support is Coming !NSE:NIFTY
Hi
Green Area Is Best Time to Accumulate Stocks.
Best Support, and Stocks with Low Beta are the Gems So Accumulate them with Nifty Supports.
Too Much is Happening, like Nifty Rebalancing, Nifty50 Next Rebalancing, Global Sentiments with Indian Govt Love for Tax Policy.
Be Prudent !
Let Them Short and Long on the Other Side.
Make Good Position on Nifty Stock !
thanks

Resistance Zone approaching. Can the bulls defy the odds?Nifty is rallying for the last few days along with global markets due to relief provided by US President Donald Trump due to Tariff pause but we are approaching a zone where the maniac rise might halt or it might take some time to relax and catch a breath or two.
The zone of concern starts from Father line of daily chart which is near 23360. Once we get a closing above this point the zone between 23569 and 23893 will be little difficult to cross as it has the trend line resistance. Once we get a closing above 23893 the Bulls can be in very strong space where they can try to pull the market further 500/800 points upwards.
However we comment about it when we reach there. The support for Nifty in case the Father line or the Resistance zone of 23569/23893 plays a spoil sport will be 23174, 23039 (Strong Mother Line Support of Daily chart).
If the Mother line is broken and we get a weekly closing below the same Bears will come back into action and can try to drag the Nifty towards 22675, 22353 and finally 21737.
Disclaimer:The above information is provided for educational purpose, analysis and paper trading only. Please don't treat this as a buy or sell recommendation for the stock or index. The Techno-Funda analysis is based on data that is more than 3 months old. Supports and Resistances are determined by historic past peaks and Valley in the chart. Many other indicators and patterns like EMA, RSI, MACD, Volumes, Fibonacci, parallel channel etc. use historic data which is 3 months or older cyclical points. There is no guarantee they will work in future as markets are highly volatile and swings in prices are also due to macro and micro factors based on actions taken by the company as well as region and global events. Equity investment is subject to risks. I or my clients or family members might have positions in the stocks that we mention in our educational posts. We will not be responsible for any Profit or loss that may occur due to any financial decision taken based on any data provided in this message. Do consult your investment advisor before taking any financial decisions. Stop losses should be an important part of any investment in equity.

Nifty 50 @ 22800 Crucial Support / Resistance LevelThere was a Head & Shoulder Pattern in Making and 22800 was a Support for NIFTY 50 but Due to TTT Trump Terrif Threats there was a Gap down and it Kissed 22000 Again.
A Massive Support and Power is Generated from 22000 and now Nifty is @ 22800 which was Support and now acting as Resistance.
It is again at the point where it left the continuation of Head & Shoulder Pattern which is 22800
if Nifty gets a good support @ 22800 now it can first phase Rally till 23800 and then continue for its journey towards 25800. should be there by 2-3 more months.
I see a support @ 22800 coz
1. Continuation of H&S Pattern
2. RSI Daily is near 50 and could get a bullish crossover with RSI MOVING AVERAGE
3. MACD is also showing signs for turning Green and crossover with its MA
Lets See!

Nifty in the Short Term can try to stage further recovery. After the drastic Trump Tariff war shock Nifty is trying to recover it's lost territory closing at 22828. Right now the Nifty is trapped between Mother and Father lines of its Hourly chart. The supports for Nifty remain at 22761 (Mother Line Support), 22675, 22353 and 21859. Below 21859 Nifty becomes very week again. The resistance for Nifty on the upper side remain at 22924 (Strong Father line Resistance), 23174 (Strong Trend line Resistance), 23384, 23569 and finally 23783. Above 23783 closing Nifty will become very Bullish.

Recovery by Nifty, Resistance zone ahead. (Economic commentary)Nifty has given a strong closing amidst global uncertainty. The uncertainty and heavy volatility will remain in the market so traders are requested to be very cautious especially with regards to Futures and Options. Any positive news can trigger a huge upside at the same time any negative news can trigger a huge downside as well.
India is silently staying neutral and trying to chart it's own deal should be seen as a positive view for long term investors. The focus of Indian investors should remain on companies which procure local raw material and supply it locally these will be the safest bets. MET has predicted a normal Monsoon for India with 103% rainfall which can another shot in the arm for Local markets. FMCG, Specialty Chemicals and Fertilizers, Banks and Financial services should be the sectors to focus.
Along with these sectors commodities and Consumption and can also be the theme as these are dark horses which can benefit from volatility. As Crude is sliding down the companies related to energy and those which are dependent on Oil & Gas, Energy for power and raw material can also benefit. The choice of the stocks should be smart at this juncture to reap rewards.
Long term investors should use this opportunity to invest in Blue chips and High Dividend Yield PSUs and other companies if they are sitting on cash. If not you can use these times to reshuffle your portfolios and align them as per the changing needs of the time. Neutral stance from India can even benefit it by getting FDI (Foreign Direct Investment) if Indian Governments plays it's cards smartly. Too much fog, mist and clouds around on global economy currently for investors to get a clear vision of sunrise sectors. Geo-political uncertainties are also blinding and making the objects in front of us look fuzzy. Investors need to keep patience, avoid speculation and let the dust settle. Even after reconsideration of changing global scenarios Indian GDP will still clock 6%+ so do not have much to worry in the long term. This volatility too shall pass and horizon will definitely be visible in the near future.
To know about how to select good companies to invest in read my book THE HAPPY CANDLES WAY TO WEALTH CREATION. It will help you in making solid triumphant decisions during these uncertain times. It teaches you Behavioural Finance, Fundamental Analysis, Technical Analysis, Profit Booking and many such important topics. The book is one of the highest rated in it's category. The book is available in Amazon in Paperback and Kindle version. You can also contact me directly for getting the same.
Nifty supports remain at: 22270, 21743 (Channel Bottom Support), 21281 (52 week Low support), 20745 and 20236. Below 20236 weekly closing the bears can try to Bring Nifty down to 200 Weeks EMA or the FATHER LINE which is at 19893.
Nifty Resistances remain at: 22913, 23249 MOTHER LINE which will be a (Major resistance), 23499 (Strong Trend line resistance), Above 23499 Bulls can become more active and try to Pull Nifty upwards towards 23894, 24334, 24831 and 25419. After we get a monthly closing above 25419 we can think of regaining 26K levels.
Short Term Outlook : Brace for massive volatility.
Medium Term Outlook: Range Bound Nifty.
Long Term Outlook: Still Very Strong.
Disclaimer: The above information is provided for educational purpose, analysis and paper trading only. Please don't treat this as a buy or sell recommendation for the stock or index. The Techno-Funda analysis is based on data that is more than 3 months old. Supports and Resistances are determined by historic past peaks and Valley in the chart. Many other indicators and patterns like EMA, RSI, MACD, Volumes, Fibonacci, parallel channel etc. use historic data which is 3 months or older cyclical points. There is no guarantee they will work in future as markets are highly volatile and swings in prices are also due to macro and micro factors based on actions taken by the company as well as region and global events. Equity investment is subject to risks. I or my clients or family members might have positions in the stocks that we mention in our educational posts. We will not be responsible for any Profit or loss that may occur due to any financial decision taken based on any data provided in this message. Do consult your investment advisor before taking any financial decisions. Stop losses should be an important part of any investment in equity.

India along with the globe stages a recovery. Indian markets staged a recovery along with it's global peers. Although the market moved 374 points upwards. After making a high of 22697 the market closed at 22535 which is 162 points down. Which means it has formed a Bullish Doji. Now Doji candle irrespective of the colour means uncertainty, until we clear the Doji top further upside will not be possible. The doji top resistance is at 22697 and Doji bottom support is at 22270.
Doji works like a cage. The bird will fly either side once the cage is broken.
To know more about the kind of candles, Mother, Father lines, behavioural finance, Technical analysis, fundamental analysis read my book: The Happy Candles Way to Wealth creation.
Nifty Supports remain at: 22270 (Doji cage support), 21743 current low of Trump Tantrum, 21289, 20790 (Channel Bottom support) and 20320.
Nifty Resistances remain at: 22697 (Doji cage resistance), 23061 Mother line resistance, 23376 Father line resistance and 23894 recent market high.
Disclaimer: The above information is provided for educational purpose, analysis and paper trading only. Please don't treat this as a buy or sell recommendation for the stock or index. The Techno-Funda analysis is based on data that is more than 3 months old. Supports and Resistances are determined by historic past peaks and Valley in the chart. Many other indicators and patterns like EMA, RSI, MACD, Volumes, Fibonacci, parallel channel etc. use historic data which is 3 months or older cyclical points. There is no guarantee they will work in future as markets are highly volatile and swings in prices are also due to macro and micro factors based on actions taken by the company as well as region and global events. Equity investment is subject to risks. I or my clients or family members might have positions in the stocks that we mention in our educational posts. We will not be responsible for any Profit or loss that may occur due to any financial decision taken based on any data provided in this message. Do consult your investment advisor before taking any financial decisions. Stop losses should be an important part of any investment in equity.

Nifty 50 Forecast with NEoWave(Update)While many analysts thought that the NIFTY50 correction was over, the index is still moving towards the specified targets. The reason I did not update the index was that we had not yet received confirmations of the end of the correction.
It seems that the minimum target for the NIFTY50 index is the same number as I mentioned earlier and after reaching the target, we will check whether the correction is over or will continue to decline.
The pattern is still diametric and we only changed the position of the labels (c)-(d)-(e). If 23879 is broken strongly, we can say that the NIFTY50 correction is over.
Previous analysis

Nifty recovers from lows of the day. But not out of danger yet.Nifty as expected suffered heavy losses due to Trump Tariff Tornado which has engulfed the global markets. The good thing which is the silver lining in the cloud was that it recovered from the lows of the day by a lot. The lowest point of today or perhaps the year 2025 so far was 21743 and we closed the day at 22161. Which is about 418 points. However we are not out of the woods yet. We will hopefully see bottom formation later during this week or the next if this lowest point is already not the bottom. The support levels for Nifty remain at 21743, 21289, 20790 and 20320. Resistance for Nifty will be at 22266, 22711, 23083 and 23384. Above 23384 closing Nifty will be back to the bulls territory and we can hope for a recovery towards 24K first and then 25K.
As of now the ball is still in Trump's court as the world sizzles with his Whims and fancies. China is planning a stimulus package for its industry and High level cabinet meeting is going on in India as I write this to counter the effects of Trump Tariff and swift recovery of our economy in addition to minimising the effect of damage.
The best strategy is to wait out the Trump Storm reassess the situation once bottom is formed. Those who have liquidity this is a good oppertunity to go long after bottom fishing.
Disclaimer: The above information is provided for educational purpose, analysis and paper trading only. Please don't treat this as a buy or sell recommendation for the stock or index. The Techno-Funda analysis is based on data that is more than 3 months old. Supports and Resistances are determined by historic past peaks and Valley in the chart. Many other indicators and patterns like EMA, RSI, MACD, Volumes, Fibonacci, parallel channel etc. use historic data which is 3 months or older cyclical points. There is no guarantee they will work in future as markets are highly volatile and swings in prices are also due to macro and micro factors based on actions taken by the company as well as region and global events. Equity investment is subject to risks. I or my clients or family members might have positions in the stocks that we mention in our educational posts. We will not be responsible for any Profit or loss that may occur due to any financial decision taken based on any data provided in this message. Do consult your investment advisor before taking any financial decisions. Stop losses should be an important part of any investment in equity.

Trump Tariffs send global Markets into free fall. Trump Tariff announcements has sent the global markets into free fall. The reaction has sent global markets into knee jerk reaction. Global trade will axis will realign because of these actions of US. As per the analysis of many experts the disadvantages to India are limited. There are opportunities galore in sectors like Pharma and Textile etc. The support levels for Nifty currently are at 22338, 21983, 21289, 20095 and finally 19864. The resistances for Nifty are 23037, 23266 and 23894. Long term Resistance for Nifty remain at 24831 and 25K levels.
Short term outlook for Nifty is weak. In the medium term Nifty can remain range bound and Long term outlook for Nifty still remains strong. Investors with Long term outlook can search for Bottom Fishing opportunities in Blue chip stocks which are available at good prices.
Focus should be on India centric themes where products and companies are less dependent on exports specially to US. Having said that it can be a blessing in disguise for sectors like Pharma and Textile. If Indian leadership can turn this obstacle into oppertunity by taking the right steps it can be a curse in disguise. Investors can also look at collecting some ETFs international as well as local as a long term investment.
In cricket matches sometimes losing a toss can be a blessing in disguise this is something like that.
Disclaimer: The above information is provided for educational purpose, analysis and paper trading only. Please don't treat this as a buy or sell recommendation for the stock or index. The Techno-Funda analysis is based on data that is more than 3 months old. Supports and Resistances are determined by historic past peaks and Valley in the chart. Many other indicators and patterns like EMA, RSI, MACD, Volumes, Fibonacci, parallel channel etc. use historic data which is 3 months or older cyclical points. There is no guarantee they will work in future as markets are highly volatile and swings in prices are also due to macro and micro factors based on actions taken by the company as well as region and global events. Equity investment is subject to risks. I or my clients or family members might have positions in the stocks that we mention in our educational posts. We will not be responsible for any Profit or loss that may occur due to any financial decision taken based on any data provided in this message. Do consult your investment advisor before taking any financial decisions. Stop losses should be an important part of any investment in equity.

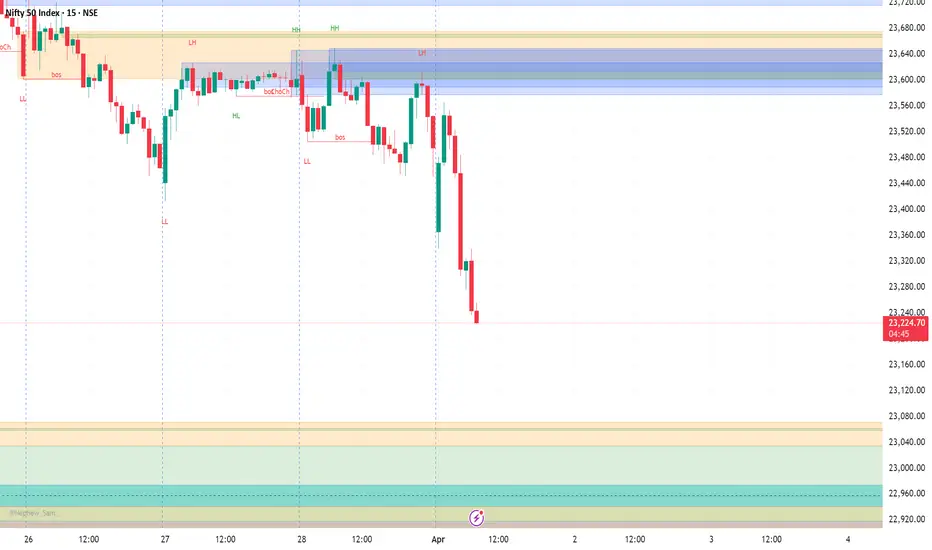
levels to watch It's clear that analysts, the media, and others who seek the spotlight often try to explain why the markets moved in a certain direction. The irony, however, is that these explanations usually come after the market has already moved, making it obvious that they’re just linking the moves to some news event.
If you pay close attention, you'll realize that technical tools can provide valuable insights ahead of time, helping you predict how the market will behave and where it’s likely headed. For those who’ve read my past articles, you’ll notice I’ve already highlighted key levels for the Nifty index and the potential targets it could reach.
Whether there were tariffs or not, the market was bound to drop. But as I pointed out, the crash is being blamed on the tariffs.
As long as the markets remain below the 24,000 level, we can expect them to target 21,800 and possibly even lower in the coming weeks.
I had booked profits for some of my stocks around the 21,800 level and re-entered short positions at 23,800.
5 waves down in NIFTY. Potential downside aheadNSE:NIFTY has a 5 wave down formation as of now in daily which potentially means that the recent rise could have been a counter-trend and the primary trend remains downward. A breach of 23676 should be another confluence for downside view.

Nifty is holding on above the Father line but by a thin margin.After reaching a weekly high of 23869 Nifty decided to fall back in search of its support zone. Currently it is holding above the Father line in the daily chart which is at 23406. Below the Father line there is Mother line waiting to support Nifty at 23114 in case the weakness seen on Friday persists. We will be in trouble again in case we get a daily or weekly closing below this level. In such a scenario the supports for Nifty will be at 22827, 22294 and 21939. In case the Nifty is able to gain momentum again the resistances it will face will be near 23536, 23671 and 23864. Closing above 23869 will enhance the short term momentum in Nifty which can lead it to 24K+ levels.
To know more about supports, Resistances, investing in stocks based on sector index, Trend lines Parallel Channels, Mother, Father and small Child Theory, Behavioural finance, Fundamental analysis, Technical analysis, Profit booking etc. Read my book The Happy Candles Way to Wealth creation. It is as on date one of the highest rated books on Amazon. The paperback version and Kindle can be bought through Amazon. You can also contact me to buy the same.
Things are slightly off balance with shadow of the candle just slightly in favour of bears as of now but Bulls will definitely try and retake the advantage back to their side given a slight opportunity. So the Bull and Bear tussle to continue into April and may escalate given Trump Tarif announcements and upcoming result season.
Disclaimer: The above information is provided for educational purpose, analysis and paper trading only. Please don't treat this as a buy or sell recommendation for the stock. No one can guarantee any success in highly volatile market or otherwise. There is also chance of bias in our opinion. The supports and resistances indicated are based on data which has a cycle time of being 3 months or older so it is not necessary that it will work. The author or Smart Investment will not be responsible for any Profit or loss that may occur due to any financial decision taken based on any data provided in this message.

nifty50 directioncurrent scenario suggest price to follow the bearish trend as todays low was broken after a early morning pullback that infuse the liquidity more on the supply side than demand and we saw a big red bar it is likely to come back at the area around 23000 to 22950 with minor intraday pullbacks