Nifty Analysis EOD – August 4, 2025 – Monday🟢 Nifty Analysis EOD – August 4, 2025 – Monday 🔴
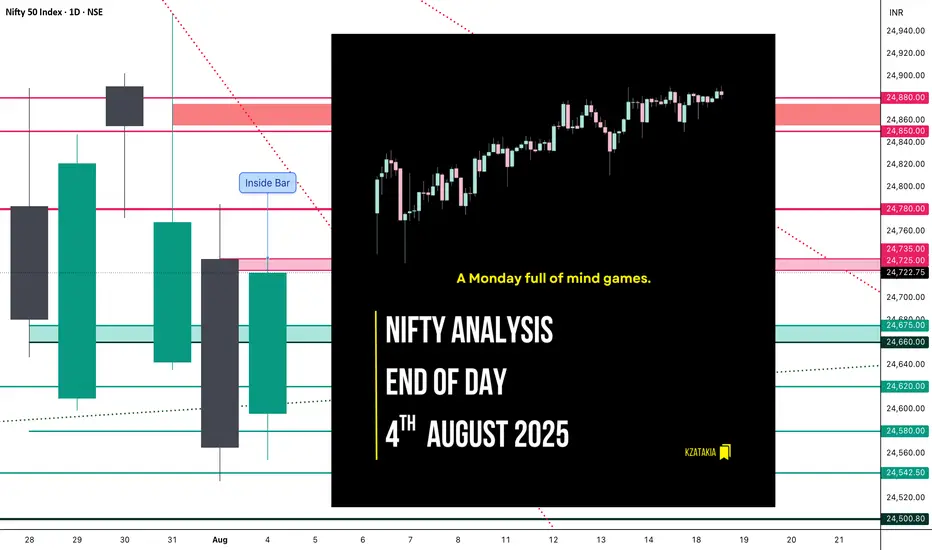
A Monday full of mind games.
Nifty opened with a slight positive gap and immediately tested the TC of CPR, but that optimism didn’t last long — sharp rejection took it to day’s low (24,554). What followed was a rollercoaster: a 100-point recovery, a 50-point pullback — all within 10 minutes. This wild price action defined the rest of the day.
Throughout the session, Nifty remained trapped within the CPR zone. Both sides experienced multiple fakeouts, especially around initial balance (IB) zones. Even when prices nudged toward R1, repeated failed attempts to break above reflected the market’s indecisiveness. The day finally closed near the high, but conviction was still lacking.
Many option buyers likely struggled due to deceptive shadows and unexpected fractal breakouts. The entire price action stayed within Friday’s range — forming an Inside Bar structure on the daily chart. This suggests a potential range breakout trade tomorrow.
The market faced resistance near the Fibonacci 0.618–0.786 retracement of the prior fall — aligning with 24,740–24,780 zones. A close above 24,780 tomorrow could shift momentum back in the bulls’ favour. If not, bears still hold the upper ground.
📈 5 Min Time Frame Chart with Intraday Levels
📉 Daily Time Frame Chart with Intraday Levels
📊 Daily Candle Breakdown
Open: 24,596.05
High: 24,736.25
Low: 24,554.00
Close: 24,722.75
Change: +157.40 (+0.64%)
Candle Type:
🟢 Bullish Marubozu-like — reflects a strong control by buyers after early weakness.
Structure Breakdown:
Real Body: 126.70 pts (Bullish)
Upper Wick: 13.50 pts (Minor resistance near close)
Lower Wick: 42.05 pts (Early dip got bought aggressively)
Key Insight:
Closed near the high of the day — positive bias for tomorrow
Inside Bar formed – Expect a breakout trade
24,780+ closing will turn sentiment bullish
🛡 5 Min Intraday Chart
⚔️ Gladiator Strategy Update
ATR: 209.36
IB Range: 115.95 → Medium
Market Structure: Balanced
Trade Summary:
🕚 11:30 AM – Long Entry → SL Hit
🕛 12:30 PM – Long Entry → SL Hit
🕐 13:10 PM – Short Entry → SL Hit
Tough day — strategy got chopped in noise-heavy moves.
🔍 Support & Resistance Levels
Resistance Zones:
24,725 ~ 24,735
24,780 ~ 24,795
24,860 ~ 24,880
Support Zones:
24,675 ~ 24,660
24,620
24,542 ~ 24,535
24,500
24,470 ~ 24,460
💭 Final Thoughts
"Markets love to test your patience before they reward your conviction."
Today was a lesson in restraint — avoid overtrading when structure lacks clarity. Inside bar gives us a clean slate for tomorrow. Let price lead.
✏️ Disclaimer
This is just my personal viewpoint. Always consult your financial advisor before taking any action.
Nifty50intraday
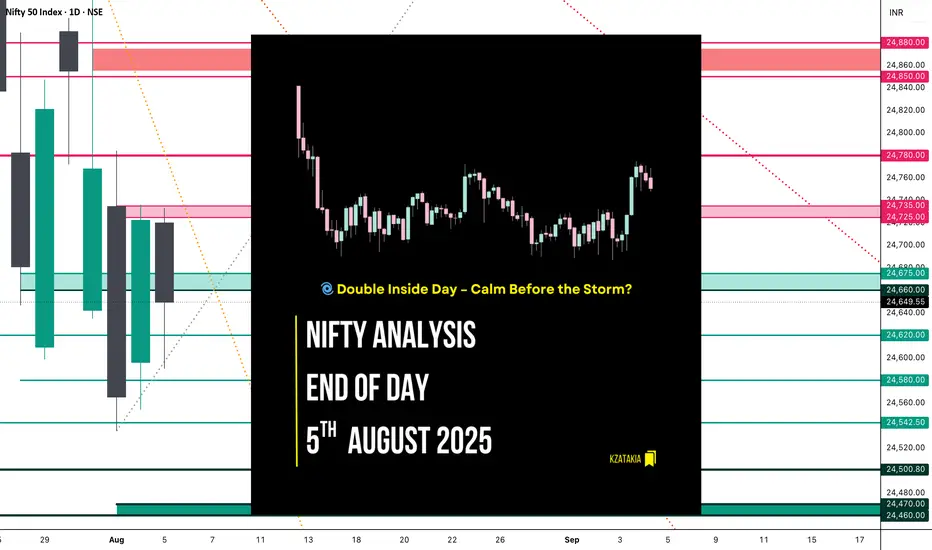
Nifty Analysis EOD – August 5, 2025 – Tuesday 🟢 Nifty Analysis EOD – August 5, 2025 – Tuesday 🔴
🌀 Double Inside Day – Calm Before the Storm?
📊 Nifty Summary
In the wind of negative news, yet Nifty starts neutral at the resistance zone of 24,725 ~ 24,735 but was unable to hold there and fell 140 points within the first 45 minutes.
After this initial sell-off, Nifty found support around 24,590, which coincided with yesterday's Fib 0.786 level, R1, and Previous Week Low (PWL).
These levels were well-defended throughout the session. Near the end, the index recovered ~80 points and closed at 24,649.55, close to yesterday’s Fib 0.5.
Can we consider today's move a retracement or a pullback of yesterday's move?
Same as Monday, today’s action stayed inside the previous session’s range, forming an Inside Bar. Now it appears as a Double Inside Bar on the daily chart.
📉 5 Min Time Frame Chart with Intraday Levels
📉 Daily Time Frame Chart with Intraday Levels
🕯 Daily Candle Breakdown
Open: 24,720.25
High: 24,733.10
Low: 24,590.30
Close: 24,649.55
Change: −73.20 (−0.30%)
Candle Structure Breakdown:
🔴 Red Candle (Close < Open):
24,720.25 − 24,649.55 = 70.70 points
🔼 Upper Wick:
24,733.10 − 24,720.25 = 12.85 points
🔽 Lower Wick:
24,649.55 − 24,590.30 = 59.25 points
Interpretation:
After a flat open, the index tried to move higher but faced resistance near 24,730, then reversed.
Buying interest was seen near the 24,590 zone, but sellers remained in control.
It closed below the open with a decent lower wick, indicating some buying support but overall weakness.
Candle Type:
🕯 A pullback candle with a moderate real body and long lower wick – suggests buyers attempted to support the fall, but sellers dominated.
🛡 5 Min Intraday Chart
⚔️ Gladiator Strategy Update
ATR: 202.71
IB Range: 139.95 → 🟠 Medium
Market Structure: Balanced
Trade Summary:
❌ No entry triggered by system
📌 Support & Resistance Levels
🔼 Resistance Zones:
24,725 ~ 24,735
24,780 ~ 24,795
24,860 ~ 24,880
🔽 Support Zones:
24,675 ~ 24,660
24,620
24,542 ~ 24,535
24,500
24,470 ~ 24,460
🧠 Final Thoughts
Today's double inside bar structure signals contraction and indecision — markets are waiting for a decisive breakout.
“The tighter the coil, the bigger the breakout.”
Keep an eye on these tight ranges. Patience before power!
✏️ Disclaimer
This is just my personal viewpoint. Always consult your financial advisor before taking any action.
Nifty Analysis EOD – August 1, 2025 – Thursday🟢 Nifty Analysis EOD – August 1, 2025 – Thursday 🔴
🎢 Illusion Rally: What You See, Isn’t What It Was!
🧾 Nifty Summary
As we all expected, a negative gap-down opening occurred due to external news. Nifty opened 183 points lower, tested the 24,660–24,675 support zone, then rebounded sharply after a symmetrical triangle + VWAP breakout. The rally pierced through all key levels like a hot knife through butter, topping at 24,950, only to reverse with equal intensity. Closed at 24,765.
📌 Despite the technical structure, today’s move had no clear technical reasoning — more likely triggered by a mix of tariff news, confidence in Modi, weekly + monthly expiry, and manipulation.
📌 in spite of a bullish candle, strong upper rejection from 24,950 hints weakness. Candle appears bullish on colour, but bears dominated intraday close — forming a bearish Moboroshi Candle (illusion of strength).
📌 Bearish Moboroshi Candle Structure : close > open and close < Previous Close
🔍 Intraday Walk
📉 Gap down of 183 pts
🟢 Support held at 24,660–24,675
🔺 Symmetrical triangle + VWAP breakout
🚀 Sharp upmove to 24,950 zone
🔁 Reversal with same intensity
📉 Closed at 24,765 — below prior close
🖼 5 Min Time Frame Chart with Intraday Levels
📉 Daily Time Frame Chart with Intraday Levels
🕯 Daily Candle Breakdown
Open: 24,642.25
High: 24,956.50
Low: 24,635.00
Close: 24,768.35
Change: −86.70 (−0.35%)
Candle Structure:
✅ Green Candle (Close > Open) → +126.10 pts real body
⬆️ Upper Wick → 188.15 pts (Very Long)
⬇️ Lower Wick → 7.25 pts (Tiny)
Interpretation:
Opened near yesterday's low
Intraday sharp rally towards 24,950+
Faced strong selling at highs
Closed above open, but way below high — signals clear rejection
Candle Type:
📌 Bearish Moboroshi Candle — Appears bullish but hides weakness
🧠 Buyers strong initially, but sellers took control at the top
Key Insight:
Bulls need decisive close above 24,880–24,910
Else, expect drift back toward 24,660–24,675
🛡 5 Min Intraday Chart
⚔️ Gladiator Strategy Update
ATR: 208.29
IB Range: 93.95 → Medium
Market Structure: Unbalanced
Trades Triggered:
✅ 10:40 AM – Long Entry → Trailing Target Hit (R:R – 1:6.25)
📌 Trade Summary: Big R:R win today on breakout with trailing logic execution!
🧱 Support & Resistance Levels
🔺 Resistance Zones:
24,820 ~ 24,830
24,850
24,880 ~ 24,890
24,910
🔻 Support Zones:
24,780
24,725 ~ 24,715
24,660 ~ 24,650
24,620 ~ 24,600
💭 Final Thoughts
"When the move can’t be explained, the best position is caution."
Today's market behavior reinforces the idea that not all moves are technical. Keep your tools sharp, but don’t ignore contextual chaos.
✏️ Disclaimer
This is just my personal viewpoint. Always consult your financial advisor before taking any action.

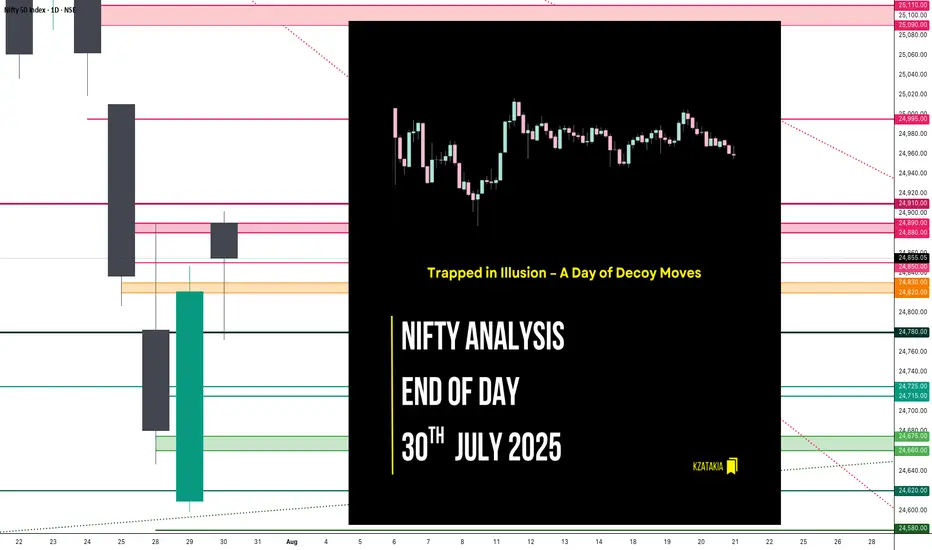
Nifty Analysis EOD – July 30, 2025 – Wednesday🟢 Nifty Analysis EOD – July 30, 2025 – Wednesday 🔴
Trapped in Illusion – A Day of Decoy Moves
Nifty moved 130 points today, falling short of the 2-week average range of 196 points. It formed its IB by 11:40 AM, marking the day's high and low early. For the rest of the session, it hovered between the IB high and the previous day high, eventually closing near the mean.
Despite a close below the open, Nifty managed a green close vs. the previous day—making it a classic "moboroshi candle" day, where visuals deceive sentiment.
📉 Intraday 5 Min Time Frame Chart
🪜 Intraday Walk
IB formed by 11:40 AM
False breakout on both sides trapped traders badly
Nifty stayed stuck between IB high and PDH
Closed slightly above the previous close, but below open
Eyes on breakout of 24,910 for targets of 24,995 and 25,090–25,110
🔄 Trend & Zone Update
📈 Resistance Zone Shifted To: 25,110 ~ 25,090
📉 Support Zone Shifted To: 24,520 ~ 24,480
🕯 Daily Time Frame Chart with Intraday Levels
🕯️ Daily Candle Breakdown
Candle Type: Small Red Hammer‑Like Candle (Decoy / Moboroshi)
Today’s OHLC:
🟢 Open: 24,890.40
🔺 High: 24,902.30
🔻 Low: 24,771.95
🔴 Close: 24,855.05
📈 Change: +33.95 (+0.14%)
📌 Candle Structure:
Real Body: 35.35 pts (Small bearish body)
Upper Wick: 11.90 pts (Very small)
Lower Wick: 83.10 pts (Long)
📌 Key Observations:
Buyers stepped in near 24,770 zone
Closed near open but slightly lower → mild net selling
Long lower wick indicates dip buying support
📌 Implication:
Buyers defended 24,770–24,780 zone
A reclaim of 24,900–24,920 may resume bullish move
A close below 24,770 weakens support
🛡 5 Min Intraday Chart
🛡️ Gladiator Strategy Update
ATR: 195.72
IB Range: 78.15 → Medium
Market Structure: Balanced
💥 Trades Triggered:
🕙 10:25 AM – Short Entry → SL Hit
📌 Trade Summary:
False IB breakouts on both sides led to a stop loss hit—typical trap in a tight consolidation phase.
📌 Support & Resistance Levels
📈 Resistance Zones:
24,880 ~ 24,890
24,910
24,995
25,090 ~ 25,110
📉 Support Zones:
24,830 ~ 24,820
24,780
24,725 ~ 24,715
24,660 ~ 24,650
🔮 What’s Next? / Bias Direction
Awaiting breakout above 24,910 for potential targets of 24,995 and 25,090–25,110. Consolidation may reward patient breakout players in upcoming sessions.
🧠 Final Thoughts
“Structure is key. When levels work, respect them. When they break, adapt.”
Today's range was narrow, but traps show signs of buildup. Be ready when the market unwinds.
✏️ Disclaimer
This is just my personal viewpoint. Always consult your financial advisor before taking any action.
Nifty Analysis EOD – July 25, 2025 – Friday🟢 Nifty Analysis EOD – July 25, 2025 – Friday 🔴
"When the tide goes out, you discover who’s been swimming naked." – Warren Buffett
Nifty GapDowns Below Key Support and Slips Further
The market opened with a sharp GapDown, breaching the previous day's low and instantly shedding 150 points within the first hour. Nifty attempted to find footing near the crucial 21st July low zone of 24,850–24,880, but the support gave way, slipping an additional 50 points.
The day mostly drifted around these lower levels with bearish dominance. Though bulls made an effort to recover late in the session, it lacked strength. The index finally settled at 24,837, decisively closing below the 21st July low — signalling a deeper structural breakdown.
📉 Trend & Zone Update
Resistance Zone Shifted To: 25,144 ~ 25,155
Support Zone Shifted To: 24,729 ~ 24,755
📊 What If Plans – 28th July Outlook
🅰️ Plan A (Contra Long Setup)
If market opens inside the previous day range and finds support at 24,815 ~ 24,850
Then potential targets are 24,920, 24,965, and 25,020
🅱️ Plan B (Trend is Friend – Short Continuation)
If market opens inside range and faces resistance around 24,965 ~ 24,995
Then aim for 24,850, 24,815, 24,780, and 24,730
⏸️ On-the-Go Plan
If market Gaps Up/Down outside previous day’s range
Then wait for the Initial Balance (IB) to form and act based on structure and S/R levels.
🕯 Daily Time Frame Chart with Intraday Levels
🕯 Daily Candle Breakdown
Open: 25,010.35
High: 25,010.35
Low: 24,806.35
Close: 24,837.00
Candle Structure
Body: Strong red candle (−173.35 pts)
Upper Wick: None (open = high)
Lower Wick: 30.65 pts
Interpretation:
A textbook bearish Marubozu — shows sellers had control throughout.
Bears stepped in immediately from open, preventing any bullish response.
Minimal lower wick implies limited buyer defense even at the session low.
Key Insight:
Bears are in command; bulls must reclaim 25,000+ quickly to prevent further downside.
If 24,800–24,820 breaks, eyes shift to 24,700–24,750 zone next.
🛡 5 Min Intraday Chart
⚔️ Gladiator Strategy Update
ATR: 192.95
IB Range: 87.4 → Medium
Market Structure: Imbalanced
Trades Triggered:
🕙 10:10 AM – Short Entry → 🎯 Target Hit (1:2.4 R:R)
🧭 Support & Resistance Levels
Resistance Zones
24,920
24,965
24,995 ~ 25,018
25,080
25,140 ~ 25,155
Support Zones
24,780
24,755 ~ 24,729
24,640
📌 Final Thoughts
When strong candles appear back-to-back with no meaningful recovery in between, it’s not just a correction — it’s a statement. In this market phase, reacting to price structure rather than assumptions will keep you on the right side. Stay nimble, stay prepared.
✏️ Disclaimer
This is just my personal viewpoint. Always consult your financial advisor before taking any action.

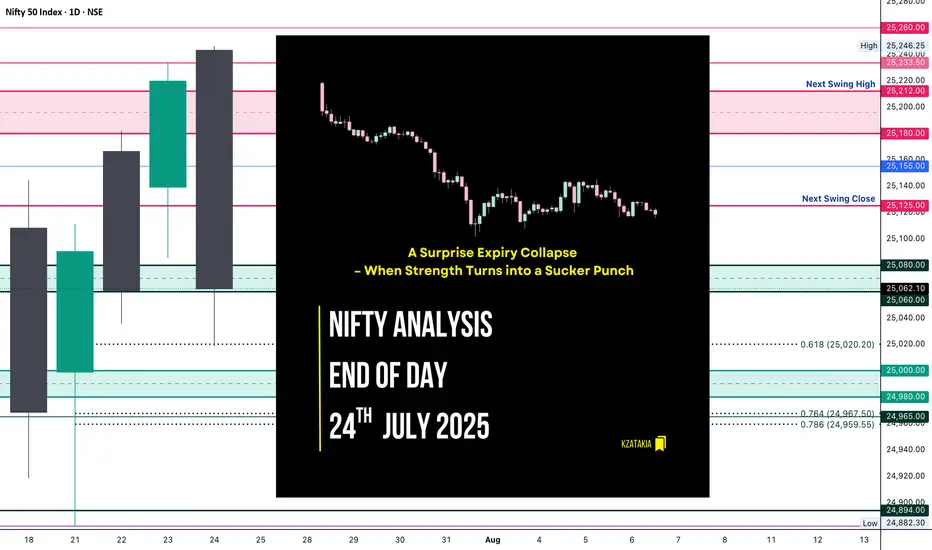
Nifty Analysis EOD – July 24, 2025 – Thursday 🟢 Nifty Analysis EOD – July 24, 2025 – Thursday 🔴
📉 A Surprise Expiry Collapse – When Strength Turns into a Sucker Punch
Today’s session was an unexpected twist.
Nifty opened above the previous day’s high, giving early hope to the bulls—but within the first hour, it slipped to 25,155 and formed its IB. What followed was a sharp 136-point fall, breaking not just yesterday’s low, but also the July 22nd low. This sudden bearish momentum was completely news-driven, and expiry-day long unwinding only added fuel to the fire.
Despite a strong close yesterday, today’s fall erased all of July 23rd’s gains and brought us right back to July 22nd’s close—neutralizing the recent upward effort.
The day closed at 25,062, marginally above key support. Technically, today’s low respected the 0.618 Fib retracement level drawn from July 21st’s low to July 23rd’s high—so a dead cat bounce is possible if no further bad news hits. But if we open below 25,050 tomorrow, expect more downside pressure toward 24,960–24,890 zones.
🕯 5 Min Time Frame Chart with Intraday Levels
🕯 Daily Time Frame Chart with Intraday Levels
🕯 Daily Candle Breakdown
Open: 25,243.30
High: 25,246.25
Low: 25,018.70
Close: 25,062.10
Change: −157.80 (−0.63%)
Candle Structure Analysis:
🔴 Body: Large red body (181.2 pts) shows strong intraday selling.
☁️ Upper Wick: Tiny (2.95 pts) → sellers dominated from the start.
🌊 Lower Wick: Moderate (43.4 pts) → small recovery near close.
Candle Type:
Almost a bearish Marubozu — clear domination by sellers with barely any upper shadow, signaling intense sell pressure.
Key Insight:
Bulls lost control after open.
Bears took charge below 25,155.
Close near support, but bias cautious.
Bulls must reclaim 25,150+ for recovery, else 25,000 may give way.
🛡 5 Min Intraday Chart
⚔️ Gladiator Strategy Update
ATR: 185.97
IB Range: 83.55 → Medium
Market Structure: Balanced
Trades Triggered:
⏰ 10:05 AM – Short Entry → SL Hit
⏰ 11:10 AM – Short Entry → Target Hit (1:3.6 Risk:Reward)
📊 Support & Resistance Levels
Resistance Zones:
25,125
25,155
25,180 ~ 25,212
25,233
Support Zones:
25,080 ~ 25,060
25,020
25,000 ~ 24,980
24,967 ~ 24,959
24,882
🔮 What’s Next?
A gap-up or stable open may trigger a dead cat bounce toward 25,150–25,180.
A gap-down below 25,050 confirms bearish continuation → next targets: 24,960 / 24,890.
Watch price action around the 25,020–25,060 zone closely.
🧠 Final Thoughts
“Markets are never wrong – opinions often are.”
— Jesse Livermore
Today was a reminder of how expiry day surprises and news flows can flip the narrative. Stay flexible, and keep a bias—but not a blind one.
✏️ Disclaimer
This is just my personal viewpoint. Always consult your financial advisor before taking any action.
Nifty Analysis EOD – July 23, 2025 – Wednesday 🟢 Nifty Analysis EOD – July 23, 2025 – Wednesday 🔴
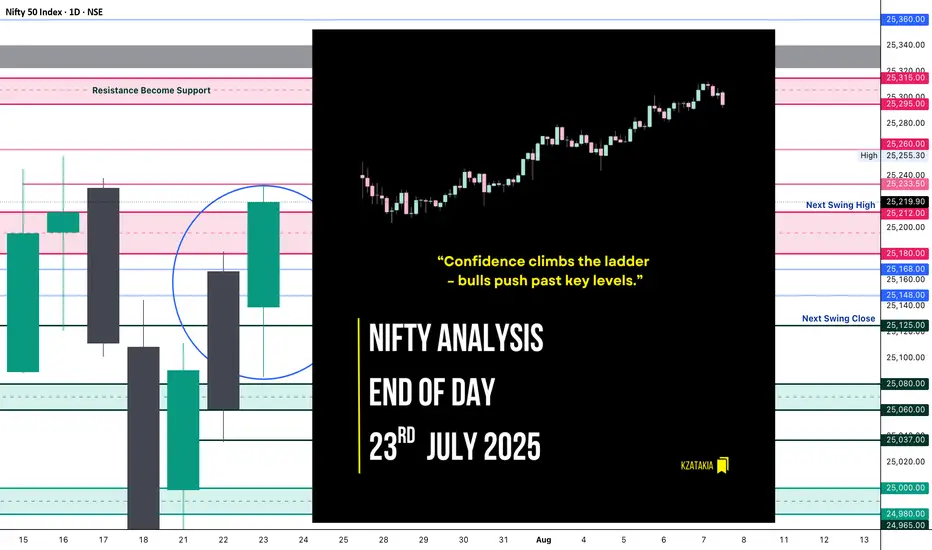
“Confidence climbs the ladder – bulls push past key levels.”
Nifty opened with a Gap Up of 78 points and initially retraced 54 points, finding solid footing around the CPR Zone. Once reclaimed VWAP, the index climbed in a methodical, low-volatility uptrend, breaking one resistance after another: CDH, R1, 25150, PDH, and the key zone 25200~25212 — finally touching the anticipated resistance at 25333, and closing just below that at 25219.90, close to the day’s high.
📌 Flashback from Yesterday's Note:
“If this is truly a retracement, 25K must hold in upcoming sessions, and bulls will need to reclaim 25,200 to regain their grip.”
👉 This expectation played out to perfection today — gradual yet confident bullish strength led Nifty to reclaim 25200 and close above it.
🔍 Today’s close of 25220 is higher than the last 7 sessions, suggesting a bullish shift in structure. However, bulls now face the real test — breaching the 25300 ~ 25350 resistance zone.
🕯 5 Min Time Frame Chart with Intraday Levels
🕯 Daily Time Frame Chart with Intraday Levels
🕯️ Daily Candle Breakdown
Open: 25,139.35
High: 25,233.50
Low: 25,085.50
Close: 25,219.90
Change: +159.00 (+0.63%)
Candle structure analysis:
Real body: Green body = 80.55 pts → strong bullish body
Upper wick: 13.60 pts → very small
Lower wick: 53.85 pts → moderate
Candle Interpretation:
The session opened stable, dipped to 25,085, but strong buyers showed up, helping price climb throughout the day and close near high. A firm green candle, signaling buyers in control.
Candle Type:
A Bullish Marubozu–like candle, not perfectly clean but represents strong continuation momentum.
Key Insight:
Close above 25200 confirms a bullish grip
If price holds above 25220–25250, next push could be towards 25280–25330
Immediate support now moves to 25,120–25,140
🛡 5 Min Intraday Chart
⚔️ Gladiator Strategy Update
ATR: 181.35
IB Range: 64.35 → Medium
Market Structure: Balanced
Trades Triggered:
⏱️ 10:45 AM – Long Entry → Trailing SL Hit (1:2.65 RR)
🔁 Support & Resistance Levels
Resistance Zones:
25,180 ~ 25,212
25,233
25,260
25,295 ~ 25,315
25,340 ~ 25,322 (Gap Zone)
Support Zones:
25,168
25,125
25,080 ~ 25,060
25,037
🧠 Final Thoughts
“Momentum is not magic—it’s built one level at a time.”
Bulls showed strength with control and consistency today. With 25200 reclaimed, they now hold the ball — next challenge lies at the gates of 25300–25350. Will they break through or pause for breath? Tomorrow holds the answer.
✏️ Disclaimer:
This is just my personal viewpoint. Always consult your financial advisor before taking any action.
Nifty Analysis EOD – July 22, 2025 – Tuesday🟢 Nifty Analysis EOD – July 22, 2025 – Tuesday 🔴
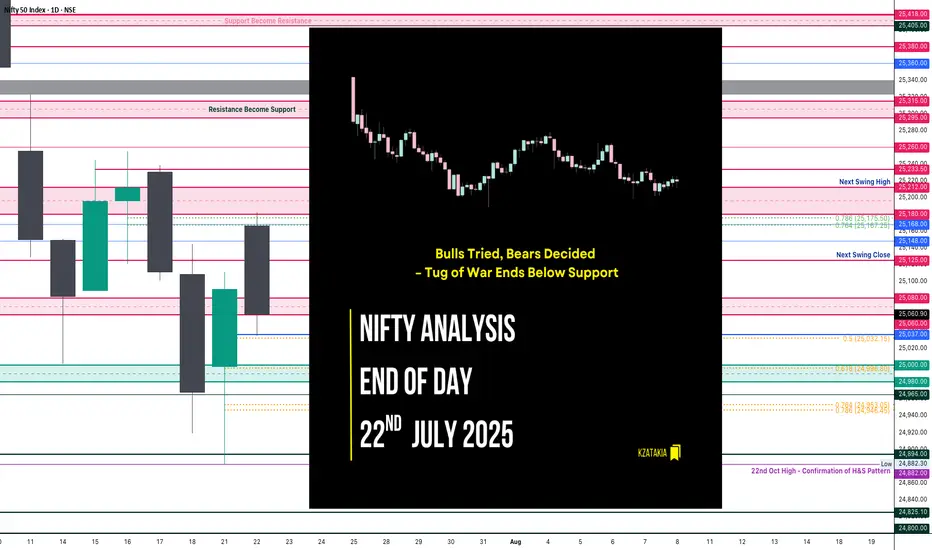
"Bulls Tried, Bears Decided – Tug of War Ends Below Support"
Nifty opened with an 88-point gap-up, continuing the bullish sentiment, right at the resistance zone of 25,180 ~ 25,212. However, the market opened at the high (OH) and quickly slipped around 100 points to form the Initial Balance (IB). After a brief bounce back to the mean, it faced resistance, leading to a breakdown of IB and further losses of 77 points.
A supportive bounce emerged near 25,060 ~ 25,080, but the price was pushed down again by PDH + VWAP + R1. The day closed below PDC and under the support zone at 25,065, showing bearish dominance despite a volatile tug-of-war between bulls and bears.
Today’s low tested the 0.5 Fibonacci retracement level (from yesterday’s low to today’s high). If this is truly a retracement, 25K must hold in upcoming sessions, and bulls will need to reclaim 25,200 to regain their grip.
🕯 5 Min Time Frame Chart with Intraday Levels
🕯 Daily Time Frame Chart with Intraday Levels
📊 Daily Candle Breakdown
Open: 25,166.65
High: 25,182.00
Low: 25,035.55
Close: 25,060.90
Change: −29.80 (−0.12%)
Candle Structure:
Real Body: Red (−105.75 pts) → Decent bearish body
Upper Wick: 15.35 pts → Small
Lower Wick: 25.35 pts → Moderate
Interpretation:
Price opened strong but faced selling near 25,180, leading to a steady drop throughout the session. The lower wick shows some buying attempt near 25,035, but the close below open signals bears dominated.
Candle Type:
Bearish candle with moderate lower wick – resembles a Bearish Engulfing setup after a green candle, suggesting profit-booking or fresh selling.
Key Insight:
Sellers defending 25,180–25,200 firmly
Holding above 25,030–25,050 is critical; breaking this could retest 24,950–25,000
Bulls must reclaim 25,120–25,150 for momentum revival
🛡 5 Min Intraday Chart
⚔️ Gladiator Strategy Update
ATR: 182.32
IB Range: 92.6 → Medium
Market Structure: Balanced
Trades Triggered:
10:45 AM – Short Trade → Trailing SL Hit (1:0.8)
12:45 PM – Long Trade → SL Hit
📌 Support & Resistance Levels
Resistance:
25,080 ~ 25,060
25,125
25,168
25,180 ~ 25,212
Support:
25,037
25,000 ~ 24,980
24,965
24,894 ~ 24,882
24,825
24,800 ~ 24,768
🧠 Final Thoughts:
"Markets often dance between zones of power — where bulls flex and bears press. It's not chaos, it's the choreography of sentiment."
The 25,000–25,212 zone continues to be the battlefield. Let’s see who seizes the upper hand tomorrow.
✏️ Disclaimer:
This is just my personal viewpoint. Always consult your financial advisor before taking any action.
Nifty Analysis EOD – July 21, 2025 – Monday 🟢 Nifty Analysis EOD – July 21, 2025 – Monday 🔴
“Shock, Squeeze, and a Strong Close — Bulls Reclaim 25K”
Today’s move was nothing short of shocking. In the first 45 minutes, Nifty plunged more than 150 points, breaking through key levels and touching 24,882. But what followed was a V-shaped recovery that caught both Friday’s shorts and those who shorted below PDC/PDL completely off guard.
The index powered up to mark a day high of 25,080, and sustained above CPR and VWAP throughout most of the session. A final push came around 2:55 PM, breaking the intraday trendline and CDH, registering a fresh high before closing near the top at 25,090.70.
✅ Bulls not only held 25K — they dominated the battlefield all day, recovering almost everything lost during Friday’s drop.
🕯 5 Min Time Frame Chart with Intraday Levels
🕯 Daily Time Frame Chart with Intraday Levels
🕯 Daily Candle Breakdown
Open: 24,999.00
High: 25,111.40
Low: 24,882.30
Close: 25,090.70
Change: +122.30 (+0.49%)
📊 Candle Structure Breakdown
Real Body: 91.70 points → strong bullish body
Upper Wick: 20.70 points → slight hesitation near highs
Lower Wick: 116.70 points → deep intraday buying from the lows
🔍 Interpretation
Mildly negative open, followed by a sharp 150-point fall
Buyers stepped in strongly near 24,880, triggering a sharp reversal
V-shape recovery sustained above CPR & VWAP, closing near high
Close is not just above open — it’s above Friday’s close and 25K mark
🕯 Candle Type
Hammer-like Bullish Reversal Candle — Long lower wick with green body, signaling strong dip buying and possible short-term trend reversal
📌 Key Insight
Strong defense at 24,880–24,900 created the base for reversal
Close above 25,090 shifts near-term bias in favor of bulls
25,110–25,140 is the next resistance to watch
As long as we stay above 24,900, buyers hold the edge
🛡 5 Min Intraday Chart
⚔️ Gladiator Strategy Update
ATR: 186.31
IB Range: 166.8 → Wide IB
Market Structure: 🟡 Balanced
📉 Trades Triggered:
10:09 AM – Long Trade → ❌ SL Hit
📌 Support & Resistance Levels
Resistance Levels:
25,080 ~ 25,060
25,125
25,168
25,180 ~ 25,212
Support Levels:
25,037
25,000 ~ 24,980
24,965
24,894 ~ 24,882
24,825
24,800 ~ 24,768
💭 Final Thoughts
🧠 “Volatility doesn’t confuse the market — it reveals who’s in control.”Today’s V-shaped reversal erased all doubts from Friday’s fall. Buyers didn’t just defend — they counterattacked and reclaimed 25K with authority.Follow-through above 25,125 on Monday could confirm trend resumption.
✏️ Disclaimer
This is just my personal viewpoint. Always consult your financial advisor before taking any action.

Nifty Analysis EOD – July 17, 2025 – Thursday🟢 Nifty Analysis EOD – July 17, 2025 – Thursday 🔴
📉 Sellers Grip Expiry Day — Big Move Loading?
Nifty started again with an OH (Open = High) formation and slipped down 94 points before 10:30 AM, marking the day’s low at 25,144. During this fall, it broke the support zone of 25,212 ~ 25,180. Although a retracement followed, it couldn’t sustain above the mean and eventually broke below the previous day’s low (PDL), closing at 25,111.45.
The weekly expiry was wild and volatile — especially from 12:30 to 2:30 PM. Interestingly, if we consider the total range of the last three sessions, it is just 166 points — well below average. This suggests a phase of consolidation. A significant move may emerge once Nifty decisively breaks the broader zone of 25,000 to 25,255.
🕯 5 Min Time Frame Chart with Intraday Levels
🕯 Daily Time Frame Chart with Intraday Levels
📊 Daily Candle Breakdown
Open: 25,230.75
High: 25,238.35
Low: 25,101.00
Close: 25,111.45
Change: −100.60 (−0.40%)
Candle structure breakdown:
Real body:
Red candle (Close < Open): 25,230.75 − 25,111.45 = 119.30 points → Decent-sized bearish body
Upper wick:
25,238.35 − 25,230.75 = 7.60 points → Very small
Lower wick:
25,111.45 − 25,101.00 = 10.45 points → Small
Interpretation:
Nifty opened slightly lower, made a weak attempt upward, then saw consistent selling throughout the day, closing near the session’s low. The negligible wicks indicate that sellers were in full control, and buyers had little room to fight back.
Candle Type:
A strong bearish candle (almost Marubozu) with very small wicks → Clear dominance by sellers.
Key Insight:
The test of the 25,100 zone again shows weakening bullish strength.
If the next session breaks below 25,100, the fall may extend toward 25,000–25,050.
For bulls to regain short-term momentum, a close above 25,200–25,220 is necessary.
🛡 5 Min Intraday Chart
⚔️ Gladiator Strategy Update
ATR: 176.62
IB Range: 60.85 → Medium IB
Market Structure: Balanced
Trades Triggered:
🕒 10:53 AM – Long Trade → Trailed SL Hit Profit (R:R = 1:0.42)
🧭 What’s Next? / Bias Direction
The market is coiling within a narrow range across multiple sessions, hinting at a potential breakout move.
📌 Watch Zone: 25,000 to 25,255
🔻 A break below 25,000 may open 24,950–24,900
🔺 A close above 25,260 could drive price toward 25,350+
Bias remains neutral-to-bearish unless bulls reclaim 25,220 decisively.
🧱 Support & Resistance Levels
Resistance Levels
25,168
25,180 ~ 25,212
25,260
25,295 ~ 25,315
Support Levels
25,125
25,080 ~ 25,060
25,000 ~ 24,980
24,965
🧠 Final Thoughts
"Structure is key. When levels work, respect them. When they break, adapt."
Three sessions of compression hint at expansion soon — stay alert and trade level-to-level with discipline.
✏️ Disclaimer
This is just my personal viewpoint. Always consult your financial advisor before taking any action.

Nifty Analysis EOD – July 16, 2025 – Wednesday🟢 Nifty Analysis EOD – July 16, 2025 – Wednesday 🔴
"Bounce Back with Caution: Bulls Show Up, But Still Not in Full Control"
Nifty started the day on a flat note, but the opening candle turned out to be the day’s high, and from there, it quickly lost 91 points, marking the day’s low at 25,121 within the first hour. The early pressure gave a bearish opening tone, but bulls gradually stepped in.
Around 11:45 AM, Nifty broke above the VWAP–Day Low range, crossed the CPR zone, and then pushed toward PDH. It did make one attempt to break PDH, but failed, resulting in a slow drift downward toward VWAP and CPR into the close. The day ended at 25,212.05, nearly at CPR — a zone of indecision.
📉 The structure shows sharp reversal from the lows, but also clear hesitation near resistance zones. The session was volatile, forming a typical pre-expiry pattern with mixed sentiment. Bulls must take charge tomorrow by crossing the 25,250–25,260 zone to regain strength.
🕯 5 Min Time Frame Chart with Intraday Levels
🕯 Daily Time Frame Chart with Intraday Levels
🕯 Daily Candle Breakdown
Open: 25,196.60
High: 25,255.30
Low: 25,121.05
Close: 25,212.05
Change: +16.25 (+0.06%)
📊 Candle Structure Breakdown
Real Body: 15.45 points → small green body
Upper Wick: 43.25 points
Lower Wick: 75.55 points → significant downside recovery
🔍 Interpretation
Market opened flat, dropped quickly to test 25,120 zone
Strong buying emerged after initial fall
Buyers lifted the index above CPR, but failed to hold breakout above PDH
Candle closes with long lower wick → buyers defended dip, but lacked closing dominance
🕯 Candle TypeSpinning Top with Long Lower Wick — often a neutral to mildly bullish candle, suggesting buying interest at lower levels, but with uncertain momentum.
📌 Key Insight
Bulls clearly defended the 25,120–25,125 support zone
Momentum will only resume above 25,250–25,260, leading to targets around 25,300–25,315
Failure to hold 25,120 could reopen downside toward 25,000–25,050
🛡 5 Min Intraday Chart
⚔️ Gladiator Strategy Update
ATR: 180.99
IB Range: 91.20 → Medium IB
Market Structure: 🟡 Balanced
Trades Triggered
11:34 AM – Long Trade → ✅ Target Achieved, Trailed SL Hit (R:R 1:2.42)
📌 Support & Resistance Zones
Resistance Levels
25,168
25,180 ~ 25,212
25,260
25,295 ~ 25,315
Support Levels
25,125
25,080 ~ 25,060
25,000 ~ 24,980
24,965
💭 Final Thoughts
“Structure is forming — but conviction is lacking. Let expiry day bring clarity. Above 25,260 we fly, below 25,120 we fall.”
✏️ Disclaimer
This is just my personal viewpoint. Always consult your financial advisor before taking any action.

Nifty Analysis EOD – July 15, 2025 – Tuesday🟢 Nifty Analysis EOD – July 15, 2025 – Tuesday 🔴
"Buyers Step Back with Conviction, Reclaim Lost Ground"
Nifty began the session with a flat-to-positive tone, and the first 5-minute candle confidently added 60 points, pushing the index toward 25,150 – aligning with the Previous Day High (PDH). However, the level couldn't hold on the first attempt and Nifty slipped back to the day's open. After a brief consolidation, bulls made a strong comeback.
The second push broke through the PDH, Day High, and the resistance zone of 25,180–25,212, and extended the move up to mark the day’s high at 25,245.20. Post that, the index hovered above the breakout zone and closed solidly at 25,195.80, showing strength and follow-through.
📈 The day’s structure was clean and directional — a healthy bounce and hold above critical levels, reinforcing the idea that buyers are regaining control after last week’s consolidation and weakness.
🕯 5 Min Time Frame Chart with Intraday Levels
🕯 Daily Time Frame Chart with Intraday Levels
🕯 Daily Candle Breakdown
Open: 25,089.50
High: 25,245.20
Low: 25,088.45
Close: 25,195.80
Change: +113.50 (+0.45%)
📊 Candle Structure Breakdown
Real Body: 106.30 points – strong green bullish body
Upper Wick: 49.40 points – profit-taking or resistance at highs
Lower Wick: 1.05 points – negligible dip from open
🔍 Interpretation
Opened flat and quickly built momentum.
Temporary pullback in first 15 minutes was bought into strongly.
Closed with a clean green body, showing clear intraday bullish intent.
Holding above the 25,180–25,212 zone is a big win for bulls.
🕯 Candle Type
Bullish Marubozu-like (strong green body with minimal lower wick) — shows conviction and potential start of a new upswing post recent chop.
📌 Key Insight
25,080–25,100 is now a key base and must be protected.
If Nifty can break and hold above 25,240–25,250, a move toward 25,295–25,315 looks likely.
Failure to hold above 25,180 would be first sign of hesitation.
🛡 5 Min Intraday Chart
⚔️ Gladiator Strategy Update
ATR: 186.18
IB Range: 67.35 → Medium IB
Market Structure: 🟢 Balanced
Trades Triggered
10:30 AM – Long Trade → ✅ Target Achieved, Trailed SL (R:R 1:2.48)
📌 Support & Resistance Zones
Resistance Levels
25,168
25,180 ~ 25,212
25,260
25,295 ~ 25,315
Support Levels
25,125
25,080 ~ 25,060
25,000 ~ 24,980
24,965
💭 Final Thoughts
"Trend is nothing without follow-through — today buyers showed up, but tomorrow they must push past 25,250 to prove it wasn't just a bounce."
✏️ Disclaimer
This is just my personal viewpoint. Always consult your financial advisor before taking any action.

Nifty Analysis EOD – July 14, 2025 – Monday🟢 Nifty Analysis EOD – July 14, 2025 – Monday 🔴
"Broken Support, Fought Resistance – Tug of War in Play"
Nifty began the day with a classic Open = High (OH) setup, instantly rejecting any bullish intent. The crucial support zone of 25,080–25,060 was taken out early, and the market went on to mark the day's low at 25,001.95, a level that quickly turned into a decisive battleground.
After a bounce from the low, 25,125 emerged as a stiff resistance that pushed the index back below the broken support zone. For most of the session, the same support zone turned into resistance — a textbook polarity flip. However, in the final hour, Nifty showed resilience and finally closed back above 25,080, ending the session at 25,082.30.
🔄 The structure was full of failed intraday breakouts, signaling confusion and conflict — likely fueled by a wider CPR, imbalanced market structure, and medium IB of 109 pts. It was a low-volatility session, but packed with psychological tests.
🕯 5 Min Time Frame Chart with Intraday Levels
🕯 Daily Time Frame Chart with Intraday Levels
🕯 Daily Candle Breakdown
Open: 25,149.50
High: 25,151.10
Low: 25,001.95
Close: 25,082.30
Change: −67.55 (−0.27%)
📊 Candle Structure Breakdown
Real Body: 67.20 points – small to moderate bearish body
Upper Wick: 1.60 points – negligible upside attempt
Lower Wick: 80.35 points – strong defense from day’s low
🔍 Interpretation
Opened higher but got instantly rejected (OH formation).
Sellers took charge early but failed to hold momentum all the way.
The long lower wick reflects buyer presence at key 25,000 zone.
The close below open but above reclaimed support suggests tug of war — with bulls slightly redeeming themselves by EOD.
🕯 Candle Type
Hammer-like red candle — while bearish on close, the long lower shadow indicates potential exhaustion of selling and hints at reversal if follow-through buying emerges next session.
📌 Key Insight
25,000–25,020 has emerged as crucial near-term support.
A strong open or close above 25,150–25,180 may confirm a bullish reversal setup.
Breakdown below 25,000 opens the door for a fall toward 24,950 or lower.
🛡 5 Min Intraday Chart
⚔️ Gladiator Strategy Update
ATR: 188.77
IB Range: 109.20 → Medium IB
Market Structure: 🔴 Imbalanced
Trades Triggered
09:50 AM – Long Trade → ❌ SL Hit
01:05 PM – Short Trade → ❌ SL Hit
📉 Tough day for directional trades — false breakouts dominated.
📌 Support & Resistance Zones
Resistance Levels
25,125
25,168
25,180 ~ 25,212
25,260
25,295 ~ 25,315
Support Levels
25,080 ~ 25,060
25,000 ~ 24,980
24,965
💭 Final Thoughts
“Reclaimed ground doesn’t mean victory – yet. Watch the next move. Rejection below 25,000 ends the bulls' narrative; a strong move above 25,180 rewrites it.”
✏️ Disclaimer
This is just my personal viewpoint. Always consult your financial advisor before taking any action.

Learning#02 : Fractals⛰️ Learning#02 : Fractals
The Cleanest Clue on a Cluttered Chart
If you like clean charts and smart price behaviour, Fractals are one of those tools that give subtle but powerful signals. They’re not magic. They simply reflect what price is telling you—if you’re willing to listen.
Let’s unpack the concept and learn how to use Fractals like a pro.
🔍 What Is a Fractal in Trading?
In technical analysis, a Fractal is a five-candle pattern that marks a local top or bottom in price. It’s a pure price-action signal that doesn’t rely on lagging indicators.
There are two types of Fractals:
Bearish Fractal (Top): The 3rd candle has the highest high, surrounded by two lower highs on each side.
Bullish Fractal (Bottom): The 3rd candle has the lowest low, flanked by two higher lows on each side.
These formations are Price's way of saying: *"I tried to go further, but couldn't."
📊 What Do Fractals Indicate?
A shift in short-term control (bulls vs. bears)
Minor support or resistance zones
Useful markers for entries, exits, or trailing stop levels
They don't guarantee reversals but are excellent at highlighting where price momentum may pause, reverse, or build structure.
📈 How to Use Fractals – A Practical Guide
Let’s be clear: Fractals are not trade signals by themselves.
Instead, they work best when used in confluence with your strategy. Think of them as tools that:
Help confirm breakout levels
Refine pullback entries
Guide you in drawing cleaner trendlines, fib zones, and support/resistance levels
Assist in identifying swing highs and lows for Dow Theory-style trend analysis
🔗 Fractals + Strategy = Smart Trading
Whether you trade breakouts or mean reversion, Fractals help clarify:
Which highs or lows matter
Where to place stop losses with structure-based logic
How to trail SL as the trade progresses
They quietly organize your chart into readable, tradeable levels.
🚀 Practical Uses of Fractals
Fractals are the first tool I add to any chart—they instantly reveal structure and guide every step of my analysis.
1. Breakout Confirmation
Wait for a candle to close above a bullish fractal high or below a bearish fractal low.
Useful when the market is trending or forming structures like double bottoms/tops.
2. Pullback with Confirmation
Use the fractal zone as a short-term S/R level. If price returns and shows signs of rejection (like an inside bar, wick rejections, or low volume), consider entries based on confirmation.
Great in sideways or swing environments.
3. Trend Structure Validation
Fractals reveal clear pivot highs/lows, helping:
Confirm higher highs/higher lows
Mark structure for trendline drawing
Validate Fib levels or S/R zones
4. Trailing Stop Loss
Update your SL to trail behind the most recent opposite-side fractals.
In longs: SL below new bullish fractals
In shorts: SL above new bearish fractals
This lets you stay in the move while managing risk like a pro.
How it’s Look Like on Chart
snapshot
⚠️ Common Mistakes to Avoid
Trading every fractal blindly
Ignoring price context or trend
Relying on fractals in low-volume, choppy markets
📝 Final Thoughts
Fractals are like breadcrumbs left by price action. They quietly point to areas where the market faced resistance or found support. Alone, they’re not enough. But in the hands of a price-action trader, they’re incredibly useful.
Used alongside market structure, confirmation signals, and clean charting habits, Fractals become:
Trend identifiers
Entry enhancers
Stop loss trail markers
⭐ Bonus Tip
Next time you mark a level, Fibonacci or draw a trendline, check if a Fractal confirms it. You’ll be surprised how often it does.
Trade simple. Trade clean.
— Kiran Zatakia

Nifty Analysis EOD – July 11, 2025 – Friday🟢 Nifty Analysis EOD – July 11, 2025 – Friday 🔴
"Smooth Slide, Silent Pressure – Bulls on the Edge"
Nifty opened with a 60-point gap-down, and despite an initial attempt to fill the gap with a 40-point bounce, the index couldn’t sustain. What followed was classic, smooth selling pressure — a slow bleed marked by 16 consecutive 5-minute candles that never broke the previous candle’s high.
There was no panic, just a persistent drift downward. The day’s structure was a silent yet firm rejection from higher levels, with 25,150 acting as an anchor for most of the session, eventually closing near 25,140.
📉 This session marks a revisit to the breakout zone of June 26–27.
Is this a false breakout or a healthy retest?
Only time — and a bounce or breakdown from 25,080–25,060 — will tell.
⚠️ If we close below 25,000, the entire bullish move from late June might be invalidated.
But a sharp bounce from the 25080–25060 zone could spark a hopeful reversal setup.
🕯 5 Min Time Frame Chart with Intraday Levels
🕯 Daily Time Frame Chart with Intraday Levels
🕯 Daily Candle Breakdown
Open: 25,255.50
High: 25,322.45
Low: 25,129.00
Close: 25,149.85
Change: −205.40 (−0.81%)
📊 Candle Structure Breakdown
Real Body: 105.65 points – clean bearish body
Upper Wick: 66.95 points – buyers rejected
Lower Wick: 20.85 points – weak defense at bottom
🔍 Interpretation
Price opened weak and stayed weak.
An intraday push to 25,320 was sharply sold into.
Closing near the day’s low shows full bear control.
Minimal bounce from day low indicates lack of bullish confidence.
🕯 Candle Type
A Bearish Rejection Candle – resembles an inverted hammer in a downtrend; suggests sellers still strong and bulls hesitant
📌 Key Insight
The zone of 25,320–25,350 has turned into firm intraday resistance.
25,100–25,130 is the immediate make-or-break support — below that lies 25,000–25,050.
For bulls to breathe again, we need a bounce and hold above 25,250–25,300.
🛡 5 Min Intraday Chart
⚔️ Gladiator Strategy Update
ATR: 193.17
IB Range: 78.45 → Medium IB
Market Structure: 🔴 Imbalanced
Trades Triggered
10:21 AM – Short Trade → 🎯 Trailing SL Hit (R:R 1:2.41)
📌 Support & Resistance Zones
Resistance Levels
25,168
25,180 ~ 25,212
25,260
25,295 ~ 25,315
Support Levels
25,125
25,080 ~ 25,060
25,000 ~ 24,980
24,965
💭 Final Thoughts
"It wasn’t a crash, it was a quiet rejection — and that makes it more dangerous. If bulls don’t show up now, bears might get bolder from here."
✏️ Disclaimer
This is just my personal viewpoint. Always consult your financial advisor before taking any action.

Nifty Analysis EOD – July 10, 2025 – Thursday🟢 Nifty Analysis EOD – July 10, 2025 – Thursday 🔴
"False Hopes, True Drop – Bears Tighten Their Grip"
Nifty opened with a mild 50-point gap-up, but within the very first minute, that optimism was crushed. It dropped nearly 100 points, breaching the previous day’s low, and entered the key support zone of 25405–25418, which held briefly for about half an hour.
But this wasn’t a day for bulls.
After a weak attempt to recover from the 25360 support (which held twice intraday), sellers regained momentum, dragged the index further down, and finally closed at the lowest point of the day – 25348.
🔸 Expiry volatility played its part — trapping option buyers and luring them into false reversals.
🔸 However, quick scalpers and intraday short-sellers likely capitalized well.
🔸 The structure was decisively bearish, with no meaningful intraday bounce.
Tomorrow becomes crucial.
Bulls have one last stronghold at the 25300 level.
Bears, already in charge, may extend the damage further if this breaks.
⚠️ Bias Levels:
🟢 Bullish above: 25420
🔴 Bearish below: 25290
⚪ Between = Neutral / Watch Mode
🕯 5 Min Time Frame Chart with Intraday Levels
🕯 Daily Time Frame Chart with Intraday Levels
🕯 Daily Candle Breakdown
Open: 25,511.65
High: 25,524.05
Low: 25,340.45
Close: 25,355.25
Change: −120.85 (−0.47%)
📊 Candle Structure Breakdown
Real Body: 156.40 points – large red candle
Upper Wick: 12.40 points – minimal bullish push
Lower Wick: 14.80 points – bears kept pressure till close
🔍 Interpretation
Bears took over early and never let go
The close at day low shows strong conviction from sellers
Lack of significant wicks → no real fight from bulls
🕯 Candle Type
Bearish Marubozu-style candle – clear sign of dominance by sellers, and potential for continuation if no quick reversal
📌 Key Insight
Market is in a critical zone — hovering above the edge of deeper correction
25300–25290 is the line in the sand
A breakdown below can target 25,200–25,250
Bulls can only regain momentum above 25,420
🛡 5 Min Intraday Chart
⚔️ Gladiator Strategy Update
ATR: 189.49
IB Range: 113.75 → Medium IB
Market Structure: 🟡 Balanced
Trades Triggered
10:52 AM – Short Trade → 🎯 Trail SL Hit (R:R 1:0.38)
📌 Support & Resistance Zones
Resistance Levels
25,380
25,405 ~ 25,418
25,470 ~ 25,480
25,530
25,545 ~ 25,550
Support Levels
25,315 ~ 25,295
25,260
25,212 ~ 25,180
25,125
💭 Final Thoughts
"Expiry days often blur the picture, but today’s price action was sharp. Unless bulls step up quickly, the breakdown may just be getting started."
✏️ Disclaimer
This is just my personal viewpoint. Always consult your financial advisor before taking any action.

Nifty Analysis EOD – June 23, 2025 – Monday🟢 Nifty Analysis EOD – June 23, 2025 – Monday 🔴
👊 Tug of War Between Optimism and Pessimism
Nifty opened with a sharp 140-point gap-down, weighed by geopolitical tensions and negative news cues. The mood was clearly pessimistic — yet, from the deep low of 24,824.85, bulls made a bold comeback.
What followed was a classic textbook reversal:Price clawed back up, cutting through multiple key resistances — S1, VWAP, CDH, CPR BC, and Central CPR — before kissing the CPR TC, where it marked the day high at 25,057. This level acted as a supply zone and pushed Nifty back down toward the CPR BC, where it managed to close above the open — a quiet victory for the bulls, even in a red session overall.
The level 24,825 has now proven itself once again — the market’s respect for this support zone grows stronger with every bounce.
Today’s candle was a spinning top-style doji and also formed an inside bar, with all movement inside Friday’s wide-range candle (352 pts). Despite a smaller 232-point range today, this still requires caution — inside bars after large-range candles often result in false breakouts, especially amid macro noise.
📌 When the world looks bearish, and the chart looks bullish — trust your system.And that’s exactly what I did today — sticking to the Gladiator Strategy, a simple, disciplined intraday price action-based option buying framework.
🕯 5 Min Time Frame Chart with Intraday Levels
🕯 Daily Time Frame Chart with Intraday Levels
🕯 Daily Candle Breakdown
Open: 24,939.75
High: 25,057.00
Low: 24,824.85
Close: 24,971.90
Change: −140.50 (−0.56%)
📊 Candle Structure Breakdown
Real Body: 32.15 pts (small green body)
Upper Wick: 85.10 pts
Lower Wick: 114.90 pts
🔍 Interpretation
Despite a lower close than Friday, it was a green-bodied candle (close > open).
Long lower wick shows strong buying near 24,825.
Long upper wick signals resistance near 25,050–25,060.
🕯 Candle Type
📍 Spinning Top with Long Wicks — Sign of indecision, but slight bullish bias due to buying off the lows.
📌 Key Insight
Support at 24,825 holds strong.
Upper rejection near 25,050 indicates tight overhead pressure.
Watch closely:
Break above 25,060 → May trigger bullish continuation.
Break below 24,820 → Could open downside to 24,735–24,660 zone.
🛡 5 Min Intraday Chart
⚔️ Gladiator Strategy Update
ATR: 254.95
IB Range: 163.25 → Medium IB
Market Structure: ⚖️ Balanced
Trades Triggered:
🟢 10:14 AM – Long Trade → ✅ Target Achieved (Trailing Exit, R:R 1:4.51)
🔴 2:16 PM – Short Signal → ❌ Discarded (RR not favorable)
📌 Support & Resistance Zones
Resistance Levels
24,980 ~ 25,000
25,060 ~ 25,080
25,125 ~ 25,150
25,180 ~ 25,212
25,285
Support Levels
24,965
24,894 ~ 24,882
24,825
24,800 ~ 24,768
24,735 ~ 24,725
💭 Final Thoughts
Markets are currently walking a tightrope — with bearish headlines on one side and bullish price action on the other.The Gladiator approach today helped sidestep the noise and focus on what matters: price structure and clean levels.
📌 Trade the chart, not the news. And when in doubt — zoom out.
🧠 “Uncertainty is the playground of the disciplined.”
✏️ Disclaimer
This is just my personal viewpoint. Always consult your financial advisor before taking any action.


Nifty 50 Index (NSE: NIFTY) AnalysisBased on the daily chart for the Nifty 50 Index (NSE: NIFTY), here is the summary and analysis:
Key Levels:
- Current Price: 22,488.65
- 50% Retracement Level: 22,458.10
- 61.8% Retracement Level: 22,324.60
- Target Price: 23,600
Chart Analysis:
1. Upward Trend: The chart shows an overall upward trend, with the index making higher highs and higher lows.
2. Retracement: The index is currently in a retracement phase, falling from its recent high of 22,705.75. The price has retraced to the 50% Fibonacci retracement level and is approaching the 61.8% level.
3. Support Zone: The blue shaded area represents a significant support zone between the 50% and 61.8% retracement levels. This zone could provide strong support and potential for a rebound.
Potential Scenarios:
1. Bullish Scenario:
- If the index finds support at the 50% or 61.8% retracement levels and rebounds, it could continue its upward trend towards the target price of 23,600.
- Confirmation of a bullish trend would come with a strong bounce from the support zone and a move back above the previous high of 22,705.75.
2. Bearish Scenario:
- If the index breaks below the 61.8% retracement level, it could indicate a deeper correction.
- A break below this level could lead to further downside, possibly testing lower support levels not shown in the current chart.
Trading Strategy:
1. Watch for Support: Monitor the price action closely around the 50% and 61.8% retracement levels. Look for signs of a reversal or strong buying interest in this zone.
2. Buy Position: Consider entering a long position if the index shows a strong bounce from the support zone with increasing volume and bullish candlestick patterns.
3. Stop-Loss: Place a stop-loss slightly below the 61.8% retracement level to manage risk in case of a further decline.
4. Target: Aim for the target price of 23,600 for the long position.
Conclusion:
- The Nifty 50 Index is currently in a retracement phase within an overall uptrend. The 50% and 61.8% retracement levels are critical support zones to watch. A strong rebound from this zone could lead to a continuation of the upward trend towards the target of 23,600. Conversely, a break below the 61.8% level could signal further downside. Monitoring the price action and volume around these key levels will be crucial for making informed trading decisions.

NIFTY 50 BEARISH MOMENTUM CONTINUESNIFTY 50 made a bearish reversal yesterday from 18790 area after taking liquidity grab from daily and weekly resistance of 18780. I have been predicting this trend reversal from last two days and yesterday we successfully hit our first profit target around 18721 which we documented (link below).
This idea is a continuation of our previous predictions and we are still bearish for NIFTY 50. The current bull run from 18670 to 18780 seems to me as market manipulation by big players to hunt more volumes. so those who were still bearish trade with us from yesterday can add more lots at current price if they wish at current price of 18780 with below possible take profits and stop loss area
TP 1 : 18635
TP 2 : 18556
SL : 18811
use proper money management and this analysis is for educational purpose only and not a financial advise.

#Nifty50 trading levels for may 2nd#Nifty50 trading levels for may 2nd. Develop your intraday trading skills with these levels.

Weekly target hit on Monday, so how to trade expiry?Hey guys!
Our weekly target of 16696 was hit on Monday itself due to a gap down and fall in nifty.
Yesterday and today, the markets have recovered and started the move from swing low to swing high. Therefore, the expectation tomorrow is bullish with a target of 17024 and 17170 after which nifty has the decide the direction.
However, the trenline is important and if it is broken, it can lead to a huge fall again.
Expecting a Gap up opening tomorrow and if Nifty opens in the channel shown in chart, it may consolidate after touching 17170 for a while. Break out from that channel is important and decisions can be taken based on that.
Please comment your views and ideas 💡 🙏. Thankyou!!
*for educational purposes only*

Nifty Futures Key Trading levels for 6th Oct 2021Nifty Futures Key Trading levels for 6th Oct 2021
Disclaimer: These levels are purely based on Price action/demand and supply zones & and consumed only for educational purpose & should not be taken as buy/sell recommendation. I will not be responsible for any loss/profit incurred if anyone takes trades based on my views. Please consult your Financial Advisor before making any trading decision.
Leave a comment that is helpful or encouraging. Let's master the markets together
