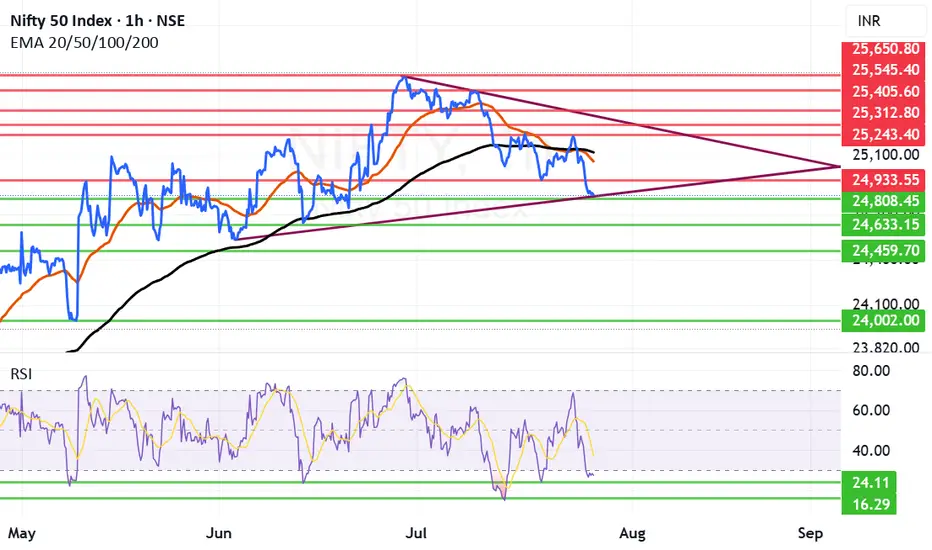
Nifty Next Week: Can Nifty make a comeback after drubbing?Nifty received proper drubbing after falling below critical supports of Mother and Father line. Trump's warning signals for IT companies and the continuing deadlock in Trade deal with US weighing on Indian markets. Additionally the earning season also giving many disappointing and few good result has broken the back of the Bull rally and now Nifty is reeling under 25K levels.
Only silver line in the cloud seems to be that RSI is below 30. Currently RSI is at 27.52. Usually RSI has found support near 24 if not 24 it might bounce back from 16. So hopefully we can see some short covering in the beginning or middle of next week. Also next week the decision for Tariffs should come. If the result will be in favour of India we might see a strong come back as lot of sectors / Large cap stocks currently are looking oversold.
The Supports for Nifty Remain at: 24808 (Strong support), 24633, 24459 Below 24459 the index will be in firm grip of Bears who might try to drag Nifty towards 24K levels or even below that in unlikely circumstances.
The Resistances for Nifty Remain at: 24933, 25058 (Mother Line Resistance of Daily Chart), 25119 (Father Line Resistance) and 25243. After we get a closing above 25243 the Bulls can gain some momentum.
Disclaimer: The above information is provided for educational purpose, analysis and paper trading only. Please don't treat this as a buy or sell recommendation for the stock or index. The Techno-Funda analysis is based on data that is more than 3 months old. Supports and Resistances are determined by historic past peaks and Valley in the chart. Many other indicators and patterns like EMA, RSI, MACD, Volumes, Fibonacci, parallel channel etc. use historic data which is 3 months or older cyclical points. There is no guarantee they will work in future as markets are highly volatile and swings in prices are also due to macro and micro factors based on actions taken by the company as well as region and global events. Equity investment is subject to risks. I or my clients or family members might have positions in the stocks that we mention in our educational posts. We will not be responsible for any Profit or loss that may occur due to any financial decision taken based on any data provided in this message. Do consult your investment advisor before taking any financial decisions. Stop losses should be an important part of any investment in equity.
Niftyanalysis
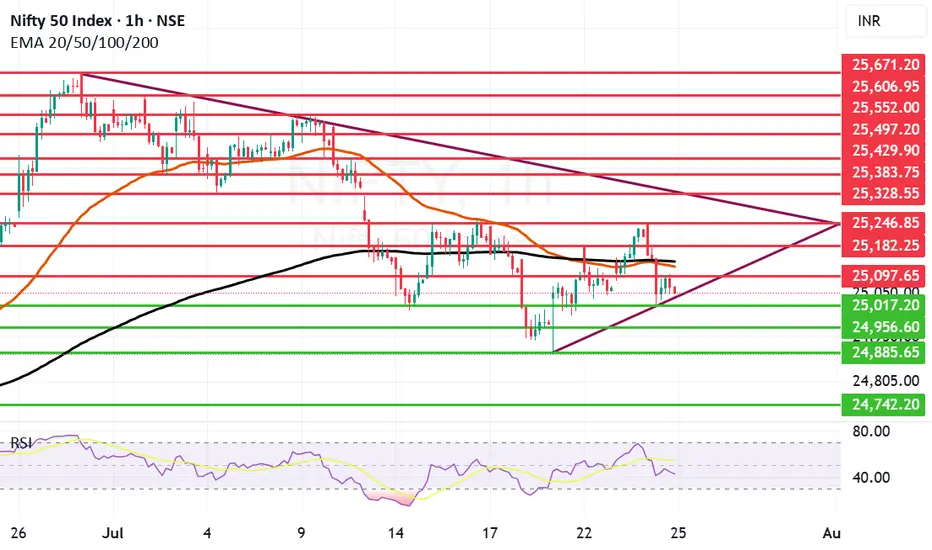
Nifty falls again as it can not sustain above 25240 level. Nifty again has shown some weakness as it was not able to sustain levels above 25240. The fall was lead by IT index which ended with deep cuts and fell 2.12% the other indices that saw fall were FMCG, Realty and Small Cap index. Trump's stance against Tech companies hiring from India and the deadlock in the trade deal also contributed to fall today. Index fell 157.8 points today and ended below both Mother and line on hourly chart. In the daily chart the candle we saw today was a bearish engulfing candle so further weakness can not be ruled out. The 2 major supports for nifty remain at 25017 and 24956 if these two supports are broken we may see Nifty falling towards 24885 or even 24742. Resistances for Nifty remain at 25097, 25138, 25182 and 25246. Only after we get a closing above 25246 we can see Nifty rally upwards.
Disclaimer: The above information is provided for educational purpose, analysis and paper trading only. Please don't treat this as a buy or sell recommendation for the stock or index. The Techno-Funda analysis is based on data that is more than 3 months old. Supports and Resistances are determined by historic past peaks and Valley in the chart. Many other indicators and patterns like EMA, RSI, MACD, Volumes, Fibonacci, parallel channel etc. use historic data which is 3 months or older cyclical points. There is no guarantee they will work in future as markets are highly volatile and swings in prices are also due to macro and micro factors based on actions taken by the company as well as region and global events. Equity investment is subject to risks. I or my clients or family members might have positions in the stocks that we mention in our educational posts. We will not be responsible for any Profit or loss that may occur due to any financial decision taken based on any data provided in this message. Do consult your investment advisor before taking any financial decisions. Stop losses should be an important part of any investment in equity.
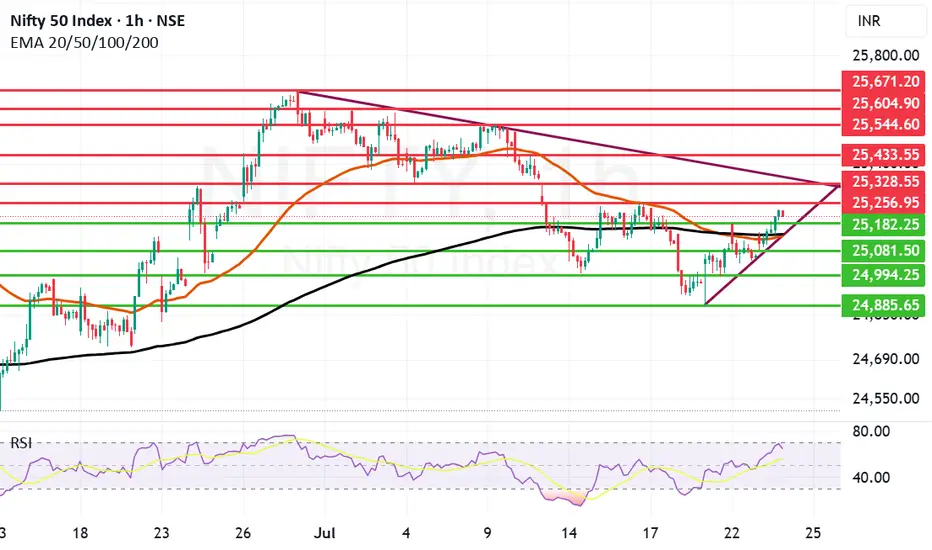
Strong Comeback by Nifty few Resistances ahead.Nifty made a remarkable comeback today ending 159 points up closing at 25219. Infosys has posted better than expected result and as of now the Infosys ADR is up by 1.26%. So if there is a turnaround in the IT sector we can see Nifty fly upwards.
The next resistance ahead of Nifty is at 25256 if we get a closing above this the next will be at 25328. These 2 will be critical resistances to cross. Once we get a closing above 25328 Nifty can target 25433 and 25544. Above 25544 Nifty becomes very strong. In case Nifty is not able to cross 25256 or 25328 levels the supports for Nifty are at 25182. After this zone there is a dual support of Mother and Father line of Hourly chart at 25136 and 25142.
These are very strong supports. (Thus the zone between 25182 to 25136 is full of supports). We hope that these supports are held. In case we get a closing below 25136 Nifty will again fall into bearish territory and can plunge towards 25081, 24994 or even 24885.
The shadow of the candles right now is positive but 2 very important resistances mentioned earlier are yet to crossed so game is in balance but only slightly in favour of Bulls.
Disclaimer: The above information is provided for educational purpose, analysis and paper trading only. Please don't treat this as a buy or sell recommendation for the stock or index. The Techno-Funda analysis is based on data that is more than 3 months old. Supports and Resistances are determined by historic past peaks and Valley in the chart. Many other indicators and patterns like EMA, RSI, MACD, Volumes, Fibonacci, parallel channel etc. use historic data which is 3 months or older cyclical points. There is no guarantee they will work in future as markets are highly volatile and swings in prices are also due to macro and micro factors based on actions taken by the company as well as region and global events. Equity investment is subject to risks. I or my clients or family members might have positions in the stocks that we mention in our educational posts. We will not be responsible for any Profit or loss that may occur due to any financial decision taken based on any data provided in this message. Do consult your investment advisor before taking any financial decisions. Stop losses should be an important part of any investment in equity.
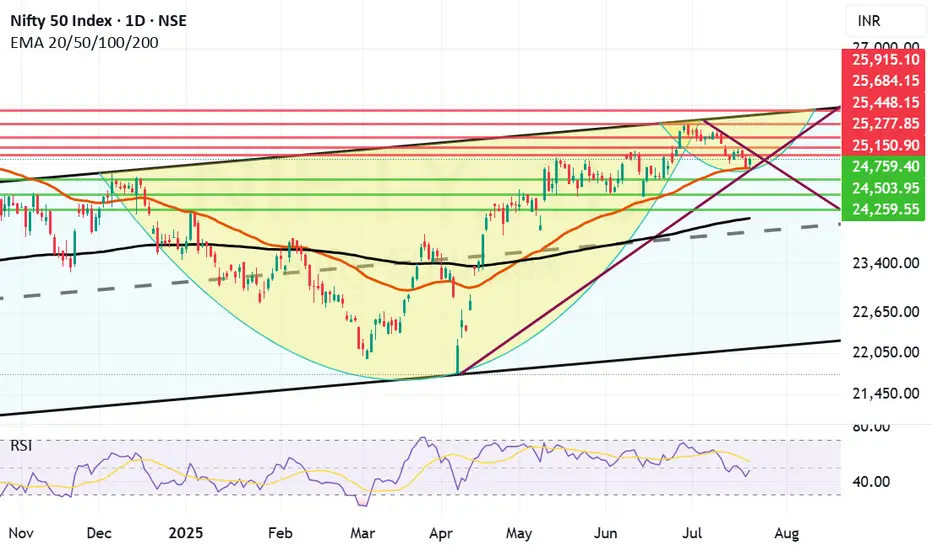
Nifty has taken support at Mother line as expected.Despite poor showing by Reliance post result and TCS continuing to fall Nifty staged a remarkable comeback on the back of Pvt Sector banking which did well. Bank Nifty came back strongly posting 1.19% gains today which enabled Nifty to rise 122 points or 0.49%. Capital Goods, Finance and Metals indices also gained more than 1% each.
Resistances for Nifty now remain at: 25150, 25277 (Trend line resistance), 25448, 25684 and finally channel top resistance at 25915.
Supports for Nifty remain at: 24938 (Mother Line Support of Daily Chart), 24759, 24503, 24259 and finally 24116 (Father Line support of Daily chart).
Shadow of the candle right now is neutral to positive and RSI is 47.63 with median RSI resistance at 54.09.
Disclaimer: The above information is provided for educational purpose, analysis and paper trading only. Please don't treat this as a buy or sell recommendation for the stock or index. The Techno-Funda analysis is based on data that is more than 3 months old. Supports and Resistances are determined by historic past peaks and Valley in the chart. Many other indicators and patterns like EMA, RSI, MACD, Volumes, Fibonacci, parallel channel etc. use historic data which is 3 months or older cyclical points. There is no guarantee they will work in future as markets are highly volatile and swings in prices are also due to macro and micro factors based on actions taken by the company as well as region and global events. Equity investment is subject to risks. I or my clients or family members might have positions in the stocks that we mention in our educational posts. We will not be responsible for any Profit or loss that may occur due to any financial decision taken based on any data provided in this message. Do consult your investment advisor before taking any financial decisions. Stop losses should be an important part of any investment in equity.
Nifty Analysis EOD – July 18, 2025 – Friday🟢 Nifty Analysis EOD – July 18, 2025 – Friday 🔴
“Deep Dive Below 25K – Bounce or Breakdown Ahead?”
As we discussed yesterday, a big move was on the cards — and Nifty delivered.
The index started flat to negative, and from the opening tick, sellers took firm control. It sharply broke through multiple key supports: PDC, PDL, S1, the important 25,080–25,060 support zone, swing low, 25,000–24,980, and even 24,965.
Buyers finally showed up near 24,920, a crucial level, and pulled off a modest 86-point recovery. The session ended at 24,968.40, still below the psychological 25,000 mark and the fractal swing low of July 14.
🕯 5 Min Time Frame Chart with Intraday Levels
🔍 Mixed Signals:
✅ Positive: Today’s low aligns with the 0.618 Fib retracement from the June 13 low to June 30 high — potential support zone.
✅ Positive: RSI(3 of 3) shows bullish divergence — early reversal sign?
❌ Negative: Closed below July 14 swing low — weak structural signal.
❌ Negative: Below 25,000 — psychological breakdown.
❓Now the big question: Will this bearish move continue, or is it a fakeout before reversal?
You're still bullish on the overall daily trend, but tactically bearish for intraday until a close above 25,125 confirms strength.
🕯 Daily Time Frame Chart For Additional View
🕯 Daily Time Frame Chart with Intraday Levels
🕯 Daily Candle Breakdown
Open: 25,108.55
High: 25,144.60
Low: 24,918.65
Close: 24,968.40
Change: −143.05 (−0.57%)
📊 Candle Structure Breakdown
Real Body: 140.15 pts → Large red bearish body
Upper Wick: 36.05 pts → rejection near early highs
Lower Wick: 49.75 pts → dip buying near 24,920
🔍 Interpretation
Mildly negative open with early strength attempt near 25,140
Sharp decline through major support zones
Buyers stepped in at 24,920, but recovery lacked follow-through
Close below 25K and key swing low confirms steady intraday selling pressure
🕯 Candle Type
Strong Bearish Candle with both wicks — sellers dominated, but not without some resistance from buyers at the lows.
📌 Key Insight
Short-term bearish momentum confirmed
24,920–24,890 is next critical support; breakdown may extend to 24,882–24,825
Bulls need to close above 25,125+ to reclaim control
🛡 5 Min Intraday Chart
⚔️ Gladiator Strategy Update
ATR: 181.56
IB Range: 126.45 → Medium IB
Market Structure: 🔴 Imbalanced
🟢 Trades Triggered:
09:42 AM – Short Trade → ✅ Trailed SL Hit Profit (R:R = 1 : 3.87)
📌 Support & Resistance Levels
Resistance Levels:
24,980 ~ 25,000
25,080 ~ 25,060
25,125
25,168
25,180 ~ 25,212
Support Levels:
24,965
24,894 ~ 24,882
24,825
24,800 ~ 24,768
💭 Final Thoughts
“Sometimes markets fall not to reverse, but to recharge.”
Today’s drop pierced major support zones, but the bounce from 0.618 Fib hints at possible resilience.
Structure needs clarity — Monday’s session will reveal whether this was a trap or fuel for bears.
✏️ Disclaimer
This is just my personal viewpoint. Always consult your financial advisor before taking any action.

If Mother Line Support will hold, we might see a C&H formation. Although we saw a negative closing today, the chart suggests that if Mother line support will hold we might see a reversal and a Cup and Handle Formation in the near future. Cup and Handle formation is a great pattern which can help us reach the previous high and surpass it. If it happens or not only time can tell.
Supports For Nifty right now remain at: 25035, 24930 (Important Mother Line Support of Daily chart), 24759 and 24503. If 24503 is broken then there will be overall weakness in the market and we can see Nifty plummeting to 24097 (Father Line Support of Daily chart). Just below 24907 there will also be the mid channel support of 23929. (Just in case we reach there).
Resistances For Nifty Remain at: 25248, 25400, 25613 and 25915 seems to be the channel top as of now.
Nifty is delicately placed and the support of 24930 and Resistance of 25248 are the key levels to be watched. Above 25248 Bulls become strong. Below 24930 Bears become strong. Right now we are in no man's land with shadow of the candle slightly negative. If we see a bounce tomorrow or from the Mother line the shadow will has potential to turn positive later in the day tomorrow or next week.
Short term Outlook: Neutral to negative.
Medium Term Outlook: Neutral to Positive.
Long Term Outlook: Positive.
Disclaimer: The above information is provided for educational purpose, analysis and paper trading only. Please don't treat this as a buy or sell recommendation for the stock or index. The Techno-Funda analysis is based on data that is more than 3 months old. Supports and Resistances are determined by historic past peaks and Valley in the chart. Many other indicators and patterns like EMA, RSI, MACD, Volumes, Fibonacci, parallel channel etc. use historic data which is 3 months or older cyclical points. There is no guarantee they will work in future as markets are highly volatile and swings in prices are also due to macro and micro factors based on actions taken by the company as well as region and global events. Equity investment is subject to risks. I or my clients or family members might have positions in the stocks that we mention in our educational posts. We will not be responsible for any Profit or loss that may occur due to any financial decision taken based on any data provided in this message. Do consult your investment advisor before taking any financial decisions. Stop losses should be an important part of any investment in equity.

Nifty Analysis EOD – July 16, 2025 – Wednesday🟢 Nifty Analysis EOD – July 16, 2025 – Wednesday 🔴
"Bounce Back with Caution: Bulls Show Up, But Still Not in Full Control"
Nifty started the day on a flat note, but the opening candle turned out to be the day’s high, and from there, it quickly lost 91 points, marking the day’s low at 25,121 within the first hour. The early pressure gave a bearish opening tone, but bulls gradually stepped in.
Around 11:45 AM, Nifty broke above the VWAP–Day Low range, crossed the CPR zone, and then pushed toward PDH. It did make one attempt to break PDH, but failed, resulting in a slow drift downward toward VWAP and CPR into the close. The day ended at 25,212.05, nearly at CPR — a zone of indecision.
📉 The structure shows sharp reversal from the lows, but also clear hesitation near resistance zones. The session was volatile, forming a typical pre-expiry pattern with mixed sentiment. Bulls must take charge tomorrow by crossing the 25,250–25,260 zone to regain strength.
🕯 5 Min Time Frame Chart with Intraday Levels
🕯 Daily Time Frame Chart with Intraday Levels
🕯 Daily Candle Breakdown
Open: 25,196.60
High: 25,255.30
Low: 25,121.05
Close: 25,212.05
Change: +16.25 (+0.06%)
📊 Candle Structure Breakdown
Real Body: 15.45 points → small green body
Upper Wick: 43.25 points
Lower Wick: 75.55 points → significant downside recovery
🔍 Interpretation
Market opened flat, dropped quickly to test 25,120 zone
Strong buying emerged after initial fall
Buyers lifted the index above CPR, but failed to hold breakout above PDH
Candle closes with long lower wick → buyers defended dip, but lacked closing dominance
🕯 Candle TypeSpinning Top with Long Lower Wick — often a neutral to mildly bullish candle, suggesting buying interest at lower levels, but with uncertain momentum.
📌 Key Insight
Bulls clearly defended the 25,120–25,125 support zone
Momentum will only resume above 25,250–25,260, leading to targets around 25,300–25,315
Failure to hold 25,120 could reopen downside toward 25,000–25,050
🛡 5 Min Intraday Chart
⚔️ Gladiator Strategy Update
ATR: 180.99
IB Range: 91.20 → Medium IB
Market Structure: 🟡 Balanced
Trades Triggered
11:34 AM – Long Trade → ✅ Target Achieved, Trailed SL Hit (R:R 1:2.42)
📌 Support & Resistance Zones
Resistance Levels
25,168
25,180 ~ 25,212
25,260
25,295 ~ 25,315
Support Levels
25,125
25,080 ~ 25,060
25,000 ~ 24,980
24,965
💭 Final Thoughts
“Structure is forming — but conviction is lacking. Let expiry day bring clarity. Above 25,260 we fly, below 25,120 we fall.”
✏️ Disclaimer
This is just my personal viewpoint. Always consult your financial advisor before taking any action.

Technical Analysis Forecast for NIFTY50 (25,191) (UTC+4) 1:11PM
1. Candlestick Patterns
Recent Structure:
If NIFTY50 closed near 25,191 with a long upper wick (shooting star/gravestone doji), it signals rejection at higher levels → bearish reversal potential.
A bullish engulfing/marubozu candle would indicate strength → upside continuation.
Key Observation: Watch for confirmation candles. A close below 25,000 invalidates bullishness.
2. Harmonic Patterns
Potential Setups:
Bullish Bat Pattern: If 25,191 aligns with the 0.886 retracement of a prior up-move (e.g., 24,800 → 25,191), it suggests a reversal zone for longs.
Bearish Crab: If 25,191 is the 1.618 extension of a prior swing, expect resistance → pullback to 24,900-25,000.
Action: Validate with Fibonacci levels. Break above 25,250 negates bearish harmonics.
3. Elliott Wave Theory
Wave Count:
Scenario 1 (Bullish): If in Wave 3 (impulse), 25,191 could extend to 25,500 (Wave 3 = 1.618x Wave 1).
Scenario 2 (Bearish): If in Wave B (corrective), 25,191 may peak → Wave C drop to 24,600 (Wave A = Wave C).
Confirmation: A break below 24,950 supports Wave C; hold above 25,100 favors Wave 3.
4. Wyckoff Method
Phase Analysis:
Distribution?: If volume spiked at 25,191 without further upside, it suggests "upthrust" (smart money exiting) → downside to 24,700 (accumulation zone).
Re-accumulation?: If consolidating near 25,191 on low volume, expect breakout toward 25,400.
Key Sign: Watch for springs (false breakdowns) or upthrusts (false breakouts).
5. W.D. Gann Theory
Price & Time Squaring:
25,191 is near 25,200 (a Gann square number). Close above 25,200 opens 25,500 (next resistance).
Time Cycle: July 15–20 is a potential turning window (watch for reversals).
Gann Angle: Trade above 1x1 angle (e.g., 45° from June low) = bullish momentum.
6. Indicator Synthesis (RSI + BB + VWAP)
RSI (14-period):
>70: Overbought → pullback likely if diverging (e.g., price highs ↑, RSI ↓).
<50: Loss of momentum → risk of deeper correction.
Bollinger Bands (20,2):
Price near upper band → overextended → mean-reversion to middle band (25,000) possible.
"Squeeze" (narrow bands) → impending volatility breakout.
VWAP (Daily):
Price above VWAP = intraday bullish bias. A dip to VWAP (~24,950) is a buy opportunity.
Price below VWAP = bearish control → sell rallies.
Intraday/Swing Outlook
Bullish Case (Hold above 25,100):
Target: 25,400 (Elliott Wave 3 + Gann resistance).
Trigger: Bullish candle close + RSI holding 60.
Bearish Case (Break below 25,000):
Target: 24,700 (Wyckoff accumulation + BB lower band).
Trigger: Bearish harmonic confirmation + RSI divergence.
Key Levels
Type Level Significance
Support 25,000 Psychological + BB middle band
24,700 Wyckoff accumulation zone
Resistance 25,191-25,200 Current price + Gann square
25,400 Elliott Wave 3 target
Trading Strategy
Intraday:
Long if holds 25,050-25,100 with RSI >50. Stop loss: 24,950. Target: 25,250.
Short if breaks 25,000 on high volume. Stop loss: 25,150. Target: 24,800.
Swing:
Wait for daily close above 25,200 (bullish) or below 24,950 (bearish).
Hedge with options: Buy 25,200 Calls + 25,000 Puts for volatility breakout.
Conclusion
25,191 is a pivotal level. The confluence of:
Harmonic resistance + Gann square at 25,200,
RSI near overbought territory,
Price testing BB upper band,
suggests short-term consolidation/pullback is likely. However, a daily close above 25,200 ignites bullish momentum toward 25,500. Trade the breakout/breakdown with confirmation.
*Disclaimer: This analysis is time-sensitive (as of July 15, 2025). Monitor real-time volume/price action for validation.*
For those interested in further developing their trading skills based on these types of analyses, consider exploring the mentoring program offered by Shunya Trade.
I welcome your feedback on this analysis, as it will inform and enhance my future work.
Regards,
Shunya Trade
⚠️ Disclaimer: This post is educational content and does not constitute investment advice, financial advice, or trading recommendations. The views expressed here are based on technical analysis and are shared solely for informational purposes. The stock market is subject to risks, including capital loss, and readers should exercise due diligence before investing. We do not take responsibility for decisions made based on this content. Consult a certified financial advisor for personalized guidance.

NIFTY Eyes 25,410: Setup in ActionIn this update, I’m revisiting the setup I shared earlier that points towards NIFTY’s next potential target at 25,410. The analysis covers the key levels, price action structure, and the factors supporting this move. This setup is based on clear technical confirmations and disciplined risk management — not just speculation.
Please remember to follow your own plan and manage your trades responsibly. This is for educational purposes and not financial advice. Let’s see how the price action unfolds!

Range Bound consolidation going on in the market. Range bound consolidation is going on in the market. As you can see in the chart there is consolidation going on before a substantial up or down move happens. Mostly it looks like Tariff negation deadline will be extended or India might end up getting the tariff deal sealed. all eyes on Trump and TCS results tomorrow. TCS has been reeling close to an year now after making a high of 4592 everything depends on the result tomorrow. The result can give direction to the market as TCS has good weightage (Around 6.09% in Nifty and 7.43% in BSE Sensex). TCS has 21.93% Weightage in Nifty IT index so the result tomorrow is a must watch. It can give direction to the It index as well.
Supports for Nifty remain at 25413 and 25243. If by chance this level is broken Nifty can fall further towards Mother line which is at 24862 or in worst case scenario towards Father line of daily chart at 24030.
Resistances for Nifty remain at: 25531 and 25710 Closing above which Nifty becomes very strong. After we get a closing above 25710 Nifty can swiftly move towards 25888 or even 26K+ levels.
Disclaimer: The above information is provided for educational purpose, analysis and paper trading only. Please don't treat this as a buy or sell recommendation for the stock or index. The Techno-Funda analysis is based on data that is more than 3 months old. Supports and Resistances are determined by historic past peaks and Valley in the chart. Many other indicators and patterns like EMA, RSI, MACD, Volumes, Fibonacci, parallel channel etc. use historic data which is 3 months or older cyclical points. There is no guarantee they will work in future as markets are highly volatile and swings in prices are also due to macro and micro factors based on actions taken by the company as well as region and global events. Equity investment is subject to risks. I or my clients or family members might have positions in the stocks that we mention in our educational posts. We will not be responsible for any Profit or loss that may occur due to any financial decision taken based on any data provided in this message. Do consult your investment advisor before taking any financial decisions. Stop losses should be an important part of any investment in equity.

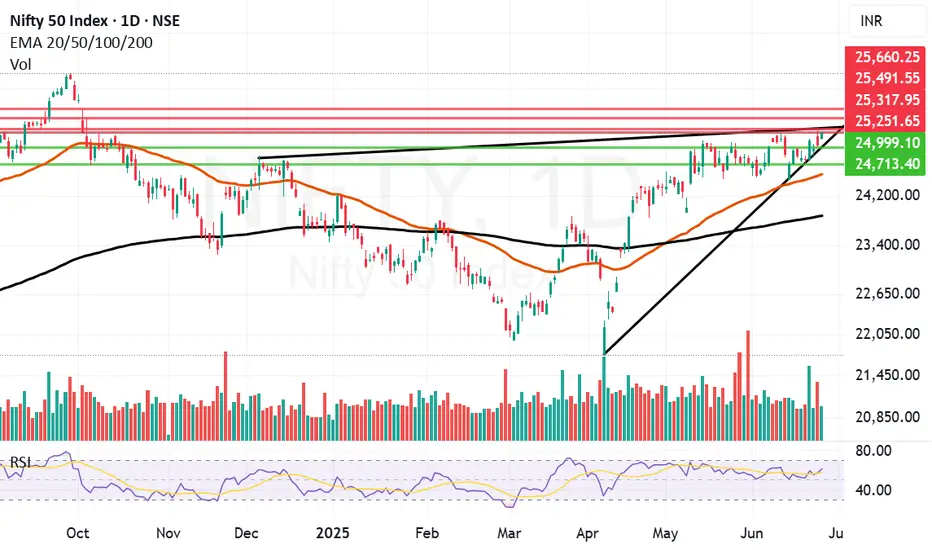
Final hurdle remains to be crossed before Nifty can fly further.One important final hurdle of 25251 remain just in front of Nifty before it can fly further. I can it a final hurdle because it is an important trendline resistance. Last 2 days Nifty has tried to climb above it but we did not get a closing above it yesterday and today as well. Today Nifty made a high of 24266 but closed at 25244. It could not hold on to the ground above 25251. The level is challenging but positive momentum built from today's display might allow it to close above the same. Only time will tell. Closing of this week will be very important.
Nifty resistances remain at: 25251, Closing above 25251 will empower Bulls to pull Nifty further upwards towards 25317, 25491 and 25660.
Nifty supports remain at: 24999, 24713, 24749 (Mother Line Support), 23875 (Father line support). (Closing below Father line support can bring Bears back into the game).
Disclaimer: The above information is provided for educational purpose, analysis and paper trading only. Please don't treat this as a buy or sell recommendation for the stock or index. The Techno-Funda analysis is based on data that is more than 3 months old. Supports and Resistances are determined by historic past peaks and Valley in the chart. Many other indicators and patterns like EMA, RSI, MACD, Volumes, Fibonacci, parallel channel etc. use historic data which is 3 months or older cyclical points. There is no guarantee they will work in future as markets are highly volatile and swings in prices are also due to macro and micro factors based on actions taken by the company as well as region and global events. Equity investment is subject to risks. I or my clients or family members might have positions in the stocks that we mention in our educational posts. We will not be responsible for any Profit or loss that may occur due to any financial decision taken based on any data provided in this message. Do consult your investment advisor before taking any financial decisions. Stop losses should be an important part of any investment in equity.
Nifty lost gains but it is a positive sign to close above 25KNifty in the Euphoria of ceasefire between Iran and Israel gained a lot of ground early in the day and made a high of 25317 but could not sustain the levels and lost massive 273 points due to profit booking to close the day at 25044. Although the loss was big but the silver lining is Nifty still ended the day 72 points in the green and closed above 25K levels. As there were news and claims related to ceasefire violations from both sides a lot of investors and participants were apprehensive of carrying long positions forward. If the things remain positive over night and if important resistance levels of 25116 and 25251 are crossed we might yet again see positive momentum building.
Nifty Resistances remain at: 25116, 25251, 25317. Closing above 25317 will lead to further upside towards the next resistance levels of 25491 and 25660.
Nifty Supports remain at: 25499 (Trend line support), 24713, 24521 (Mother Line Support) and 24463. closing below 24463 can had over the gains to the Bears who can drag index down towards Father line support of 23861.
Disclaimer: The above information is provided for educational purpose, analysis and paper trading only. Please don't treat this as a buy or sell recommendation for the stock or index. The Techno-Funda analysis is based on data that is more than 3 months old. Supports and Resistances are determined by historic past peaks and Valley in the chart. Many other indicators and patterns like EMA, RSI, MACD, Volumes, Fibonacci, parallel channel etc. use historic data which is 3 months or older cyclical points. There is no guarantee they will work in future as markets are highly volatile and swings in prices are also due to macro and micro factors based on actions taken by the company as well as region and global events. Equity investment is subject to risks. I or my clients or family members might have positions in the stocks that we mention in our educational posts. We will not be responsible for any Profit or loss that may occur due to any financial decision taken based on any data provided in this message. Do consult your investment advisor before taking any financial decisions. Stop losses should be an important part of any investment in equity.

Great recovery by Nifty to end the week. Nifty has shown a great recovery to end the week at 25112 despite persisting global uncertainties. This again shows imminent strength of Indian markets and confidence on the local factors by Bulls.
Nifty however is now entering a tough resistance zone which starts exactly from 25113 and extends till 25251. Once we get a closing above 25251 the Bulls will try to control the market with more strength. Till that happens it can still go in any direction. The supports for Nifty remain at 24869, 24713, 24480 (Mother line support), 24175 and finally 23838 (Father line support).
If any major further global escalation happens during the weekend and we get a closing below 23838 then Bears can become more powerful and they might have potential to push market further down towards 23047 or below.
Things hang in balance despite a strong closing on Friday as the shadow of the candle is still neutral.
Disclaimer: The above information is provided for educational purpose, analysis and paper trading only. Please don't treat this as a buy or sell recommendation for the stock or index. The Techno-Funda analysis is based on data that is more than 3 months old. Supports and Resistances are determined by historic past peaks and Valley in the chart. Many other indicators and patterns like EMA, RSI, MACD, Volumes, Fibonacci, parallel channel etc. use historic data which is 3 months or older cyclical points. There is no guarantee they will work in future as markets are highly volatile and swings in prices are also due to macro and micro factors based on actions taken by the company as well as region and global events. Equity investment is subject to risks. I or my clients or family members might have positions in the stocks that we mention in our educational posts. We will not be responsible for any Profit or loss that may occur due to any financial decision taken based on any data provided in this message. Do consult your investment advisor before taking any financial decisions. Stop losses should be an important part of any investment in equity.

Tensions in the Middle East. (Levels to watch, things to do). Iran and Israel situation is tense. Lot of investors have lot of questions in mind. I am trying to provide my opinion for the same in the video. I am trying to give my Technical and Political commentary on the situation in this educational video. The political commentary is based on my 15+ years of experience in the Middle East and is my personal opinion. I hope this will answer a lot of questions for you. I have also tried to give Techincal support and resistance levels for Nifty. In the 10 minute I have tried to cover as many points as I can. Along with the list of things to do as an investor. I hope this will help many of you.
As it was expected there was a deep fall in the market due to Israel Vs Iran tensions. US is also a direct or indirect party to the situation and if there is further escalation other global powers will mostly get involved. Due to the this situation market opened gap down at 24473. What we saw post that is Indian market recovered smartly from that situation to close at 24718. That is a huge 245 point recovery to end the day. This is why colour of the candles throughout the day (As this is an hourly chart are green despite we ended in red. (That is a classic Technical lesson for understanding candle sticks analytics). The closing is above the father line support of 24674 which is a good sign as this will be our support (Strong support for Monday.) I have spent more than 15 years in the Middle East and happen to know a little bit out of my personal experience, having interacted with a lot of locals. Thus I am trying to answer a few questions that might be coming in the minds of may investors including myself.
Q&A
The Question now are we out of danger?
Answer: Not yet.
Question 2: Why we are not out of danger?
Ans: The geo-political situation is very tense. The scale of Israeli attack was massive and there are clear and present chances of Iran counter attack which has already begun. Israel will respond again and Trump has already said that the next attacks by Israel will be even more fierce. No Iran is no palestine and there would be many countries that might support Iran. Specially China has already hinted support. Russia another ally is busy with Ukraine but you never know.
Question 3: How it goes for the other Middle Eastern countries?
Ans: There are lot of countries with US and Western bases on them. If Iran attacks them there are chances of other Western countries getting into the act too. In addition to some Middle Eastern countries getting into the act for the purpose of self defence. Thus over the weekend the things can get either very tense.
Question 4: What happens to India and Indian markets?
Ans: Today Indian markets have shown a lot of resilience. Global meltdown can affect us to for sure. But as we are neutral (As of now as it seems). The damage to our market hopefully will be minimal. Moreover recovery will be swift once the situation becomes less tense.
Question 5: What should investors do?
Ans: Long term investors can hold on to their long term positions in blue chip stocks. Keep stop losses and trailing stop losses in place for the mid-cap and small cap stocks. If some stop losses are hit or trailing stop losses are hit, you can always buy again as market is not going anywhere. The dip that we might potentially see can be an opportunity for long term investors for bottom fishing again and recalibrating their portfolios. (You can use the current situation to realign your portfolio for buying the trending stocks which have giving good results this quarter or have been giving good results since last few quarters.) Get rid of the stocks that have been dragging your portfolio down. Market has provided another opportunity for a fresh start.
Things you can do:
1) Gold and Silver are always a great option when it comes to uncertain times.
2) Do not give a knee jerk reaction in selling off your winners.
3) Watch the global updates and keep stop losses and trailing stop losses accordingly.
4) Re-calibrate your portfolio
5) If you are sitting on cash use the dip for investing in stocks with long term perspective.
The support for Nifty Remain at: 24674 (Father line support), 24640 (Mid-channel support), 24492 (Trend line support), 24382, 24208 and finally 24077 (Channel Bottom Support). a closing below 24077 will enable and empower bears to Pull Nifty further down.
Resistances for Nifty remain at: 24752, 24818, 24906 (Mother line Resistance), 25043, 25138 and finally 25223 (Channel top Resistnace). Above 25223 Bulls will potentially take over the market.
To know more about Mother Father and Small Child theory, Parallel Channel, Technical and Fundamental analysis and to learn it to master it. Read my book. The Happy Candles Way To Wealth Creation available on Amazon in Paperback and Kindle version. The book is one of the highest rated books in the category and many readers consider it as a Hand Book for Equity investment.
Disclaimer: The above information is provided for educational purpose, analysis and paper trading only. The political commentary is based on personal views and analysis. Please don't treat this as a buy or sell recommendation for the stock or index. The Techno-Funda analysis is based on data that is more than 3 months old. Supports and Resistances are determined by historic past peaks and Valley in the chart. Many other indicators and patterns like EMA, RSI, MACD, Volumes, Fibonacci, parallel channel etc. use historic data which is 3 months or older cyclical points. There is no guarantee they will work in future as markets are highly volatile and swings in prices are also due to macro and micro factors based on actions taken by the company as well as region and global events. Equity investment is subject to risks. I or my clients or family members might have positions in the stocks that we mention in our educational posts. We will not be responsible for any Profit or loss that may occur due to any financial decision taken based on any data provided in this message. Do consult your investment advisor before taking any financial decisions. Stop losses should be an important part of any investment in equity.

Nifty Gave Breakaway Gap Strong Bullish SignalWhat is Breakaway GAP?
A breakaway gap refers to the situation in the market where there is a strong price movement that crosses support or resistance. Breakaway gaps are formed after substantial periods of consolidation of prices in the market. It signifies a break from the previous trading range or pattern, and it suggests that a new trend or direction is emerging.
Nifty was trading in a range for 5 days and today 6/09/2025 it gap up and sustained above 25000 crucial level, the importance of break-away gap is that it's very strong sign of bullishness in market this also strong support too so if nifty come to retrace it would become support around 25000 level,
if nifty break today opening rang then it's very likely that it will go further so there are possibly Two entry Sign for Long: - first, OR breakout, second: -retracement on 15 Min chart near 20 Ema -50 Ema. Thats My opinion

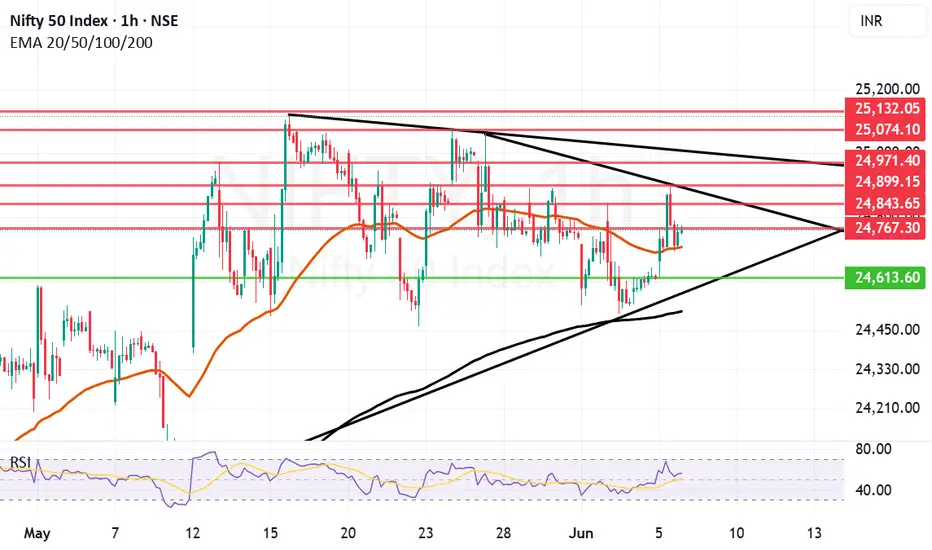
Nifty bounce between Trendline resistance and Mother lineWe Saw a jump of 130 points in Nifty today. The jump could have been higher if trend line resistance would not have come into play. This trend line resistance which came into effect is exactly around 24899 as it can be seen in the chart which was also the day's high. After making this high Nifty fell again until Mother line support present near 24706 again came into act for Nifty to close near 24750.
Thus the supports for Nifty now remain at: 24706 (Mother Line Support), 24613 (Low of today) and Father line Support near 24508. Below 24508 there will be further weakness and Bears will take control of the market.
The Resistances for Nifty now remain at: 24767, 24843, 24899 (trend line resistance), and 24971(Another Trend line resistance). Above 24971 closing Nifty will gain strength again and Bears can pull the market upwards towards 25074 or 25132. Closing above 25132 will be very good for the market as there seems to be a pure Bull territory above this zone.
Disclaimer: The above information is provided for educational purpose, analysis and paper trading only. Please don't treat this as a buy or sell recommendation for the stock or index. The Techno-Funda analysis is based on data that is more than 3 months old. Supports and Resistances are determined by historic past peaks and Valley in the chart. Many other indicators and patterns like EMA, RSI, MACD, Volumes, Fibonacci, parallel channel etc. use historic data which is 3 months or older cyclical points. There is no guarantee they will work in future as markets are highly volatile and swings in prices are also due to macro and micro factors based on actions taken by the company as well as region and global events. Equity investment is subject to risks. I or my clients or family members might have positions in the stocks that we mention in our educational posts. We will not be responsible for any Profit or loss that may occur due to any financial decision taken based on any data provided in this message. Do consult your investment advisor before taking any financial decisions. Stop losses should be an important part of any investment in equity.
nifty rangeHere’s a professional and engaging **TradingView post description** for a **Nifty range-bound market** scenario:
---
📊 **Nifty Index – Range-Bound Consolidation Ahead?** 🧭
Nifty is currently trading within a defined range, indicating indecision in the market. The index is facing resistance near **25000** and finding support around **24500**.
📌 **Key Observations:**
* Price action suggests a sideways trend with no clear breakout yet.
* Volumes are relatively lower, reinforcing the consolidation phase.
🛑 **Resistance:** 25000
✅ **Support:** 24500
🔍 A breakout on either side could trigger the next directional move. Until then, traders should focus on **range-bound strategies** like buying near support and selling near resistance, with tight stop-losses.
💬 What’s your view on Nifty's next move? Drop your analysis in the comments!
\#Nifty50 #NiftyAnalysis #NiftyRange #StockMarketIndia #TradingView #TechnicalAnalysis #NiftyOutlook #NSEIndia #BankNifty #PriceAction #NiftyLevels

Bull Rally Losing steam as international factors weigh in. The Bull rally that we saw in Nifty in the last one month or so is losing a little steam as international factors related to escalating Russia and Ukraine war and International Tariff war start to weigh in. This made it difficult for Nifty to hold on to levels above 25000 after making a high of 25116 in the current rally. After making a high it is any substantial rally would try to consolidate and find a reasonable bottom from where it can launch again. Verifying a solid support is necessary for rally to move forward.
The supports for Nifty currently are at: 24515, 24185 (Mother line important support), 23945, 23689 (Father line important support). If 23689 is broken the bears will be very active again and can potentially drag down nifty to 23214, 22902 or even 22666. So 24185 and 23689 are important levels for Nifty to hold.
The Resistances for Nifty currently are at: 24838, 25116 (Important Resistance level, recent high). Sustaining above 25116 and Nifty closing above it can enable next leg of the rally which can take us in future to next resistance levels of 25438, 25641, 25845 and 26K+ levels.
The market might be speculating Russian response to Ukraine Drone attack. The scale of Russian attack if it happens will determine the movement of market. The local factors are mostly in favour of Indian markets. So long term investors should not worry. Traders and short term investors should avoid taking unnecessary risk as situation on international front. Geo-Political risk in the subcontinent, at Israel front and Between Russia and other EU nations should be on the hindsight of any decision making. Additionally there are rising number of COVID cases in India which can also become a factor which can effect market sentiment.
Disclaimer: The above information is provided for educational purpose, analysis and paper trading only. Please don't treat this as a buy or sell recommendation for the stock or index. The Techno-Funda analysis is based on data that is more than 3 months old. Supports and Resistances are determined by historic past peaks and Valley in the chart. Many other indicators and patterns like EMA, RSI, MACD, Volumes, Fibonacci, parallel channel etc. use historic data which is 3 months or older cyclical points. There is no guarantee they will work in future as markets are highly volatile and swings in prices are also due to macro and micro factors based on actions taken by the company as well as region and global events. Equity investment is subject to risks. I or my clients or family members might have positions in the stocks that we mention in our educational posts. We will not be responsible for any Profit or loss that may occur due to any financial decision taken based on any data provided in this message. Do consult your investment advisor before taking any financial decisions. Stop losses should be an important part of any investment in equity.

Nifty 50 Technical Analysis: Key Levels to Watch This Week!📈 Timeframe: Daily Chart
📍 Instrument: NSE:NIFTY
🔍 Chart Overview:
Nifty 50 has been trading in a consolidation range between and . We are now approaching a critical breakout zone that could define the next short-term trend.
🔑 Key Levels:
Immediate Resistance: 25071
Immediate Support: 24488
Breakout Above: 25071
Breakdown Below: 24488
🔔 Trading Plan:
🔼 Bullish Scenario: Wait for a breakout above 25071 with volume confirmation.
🔽 Bearish Scenario: Breakdown below 24488 may invite selling pressure.
💡 Risk Management: Use proper stop-loss below support/resistance
📌 Disclaimer:
This is for educational purposes only. Do your own research before taking any trade.
📢 Hashtags:
#Nifty50 #TradingView #ChartAnalysis #TechnicalAnalysis #NSEIndia #NiftyBreakout #PriceAction #StockMarketIndia #SwingTrade #NiftyToday

Educational Video: Nifty Outlook-How Technical analysis is done.We have tried to draw a parallel channel on Nifty hourly chart. The chart indicates that we are just below the mid channel line. The mid channel line will act as a resistance if the price is below the same and will act as a support if the price is above it. Right now it is acting as a resistance. Top of the channel always acts as a resistance and bottom of the channel always acts as a support. Additionally there are historic resistances and supports which indicate the other levels which may act as support or resistance. There are also Mother and Father lines (50 and 200 EMA)(EMA = Exponential Moving Average).
To understand in detail how parallel channel works or how supports and resistance are derived or what is Mother, Father and Small Child theory. I would recommend you my book The Happy Candles Way to Wealth creation. By reading this book you can understand all these concepts with ease. You can additionally understand what is fundamental and technical analysis and how to do it. You will also get to understand the dos and the don'ts of investment in equity by reading various chapters on Behavioural Finance. Overall it is a value for money book available on Amazon in Paperback and Kindle version. The book is also available on Google play book and other E-book stores. You can also contact us for getting the copy of it. The Happy Candles way is one of the highest rated books in the category and you can go through the reviews of the book on Amazon before purchasing it.
Based on Parallel Channel, Supports and Resistances, Mother Father and Small child theory resistances and supports of Nifty remain at.
Nifty Resistances Remain at: 24815, 24909, 24977, 25045 and 25116. The channel top resistance for the current parallel channel is around 25372.
Nifty Supports Remain at: 24780 (Mother Line Support), 24679 and 24537. The Channel Bottom support is currently around 24396. 24247 is the most important Father line support.
Shadow of the candles currently is neutral. Indicating Nifty can still go in any direction. A pennant like structure (Triangle is also formed). This indicates that Breakout or Breakdown of this triangle or pennant can take Nifty a long way on either side. Nifty is currently squeezing in the pennant with limited space. Usually when the space is limited a Breakout can happen in either direction.
Disclaimer: The above information is provided for educational purpose, analysis and paper trading only. Please don't treat this as a buy or sell recommendation for the stock or index. The Techno-Funda analysis is based on data that is more than 3 months old. Supports and Resistances are determined by historic past peaks and Valley in the chart. Many other indicators and patterns like EMA, RSI, MACD, Volumes, Fibonacci, parallel channel etc. use historic data which is 3 months or older cyclical points. There is no guarantee they will work in future as markets are highly volatile and swings in prices are also due to macro and micro factors based on actions taken by the company as well as region and global events. Equity investment is subject to risks. I or my clients or family members might have positions in the stocks that we mention in our educational posts. We will not be responsible for any Profit or loss that may occur due to any financial decision taken based on any data provided in this message. Do consult your investment advisor before taking any financial decisions. Stop losses should be an important part of any investment in equity.

Nifty Might Range-Bound until it doesn't break 24950 levelToday 21/05/2025 around 11 O clock Nifty Tested 24950 the push was not above average volume driven that's why market was going to pullback although something absence of sellers comparatively had seen on 13 may u can see on chart but still it required to break 24950 level with good volume for being upward journey, until we expect market may range between 24500-25000.
strong Resistance- 24950-25000
Strong Support -24500
Multiple Resistances and Profit bookingMultiple resistances, trend line resistances are acting on Nifty and hampering it's progress. Also there is Profit booking seen across the board in all sectors. Additionally there is a new COVID scare that is spreading in China, Singapore and Hong Kong. These are the factors currently facing Nifty and not allowing it to fly above 25K levels and forcing it in downward spiral.
The resistances for Nifty remain now at: 25234, 25064, 24937, 24780, However we are entering into support zone now.
The supports for Nifty remain at: 24664, 24509, 24259, 23900 (Strong Mother line support of daily chart) and 23576 (Strong Father line support of daily chart).
To know more about importance of Father and Mother line supports and resistances read my book the Happy Candles Way to Wealth Creation. The book is available on Amazon in Paperback and Kindle Version. You can learn about Fundamental and Technical analysis from the book. The book also gives you knowledge about the art of Profit booking and novel ways of stock data analysis. Lot of reviewers consider it a hand book to investing in stock market. Everything is explained in simple jargon free language with examples of Cricket and day to day life which makes understanding of difficult investing concepts very easy. You will not regret buying the book that we can assure you.
As the multiple resistances were very strong this fall / correction / consolidation was bound to happen. As of now this should be seen as a regular market phenomenon only. Bear will become more active only if Father line support is broken. Bulls will become more active only when we get a closing above 25064. Above 25234 is a pure bull territory. Below 23576 is pure bear territory. Right now we are in no man's land.
Disclaimer: The above information is provided for educational purpose, analysis and paper trading only. Please don't treat this as a buy or sell recommendation for the stock or index. The Techno-Funda analysis is based on data that is more than 3 months old. Supports and Resistances are determined by historic past peaks and Valley in the chart. Many other indicators and patterns like EMA, RSI, MACD, Volumes, Fibonacci, parallel channel etc. use historic data which is 3 months or older cyclical points. There is no guarantee they will work in future as markets are highly volatile and swings in prices are also due to macro and micro factors based on actions taken by the company as well as region and global events. Equity investment is subject to risks. I or my clients or family members might have positions in the stocks that we mention in our educational posts. We will not be responsible for any Profit or loss that may occur due to any financial decision taken based on any data provided in this message. Do consult your investment advisor before taking any financial decisions. Stop losses should be an important part of any investment in equity.

Nifty preparing itself for Big Momentum Today 8may 2025 Nifty traded in just tiny range even on expiry Day. so, what will be next Move?
it is ready for bearish momentum ?
First reason: I have noticed multiple weakness through Wick which is representing by arow on chart.
Second reason: whenever market traded in narrow range (around 8-10 hourly candle) in past few days it gave breakdown represented drawing 4 yellow area see on chart.
