NSE:NIFTY Analysis/Prediction for tomorrow 11-01-2023NSE:NIFTY Analysis/Prediction for tomorrow
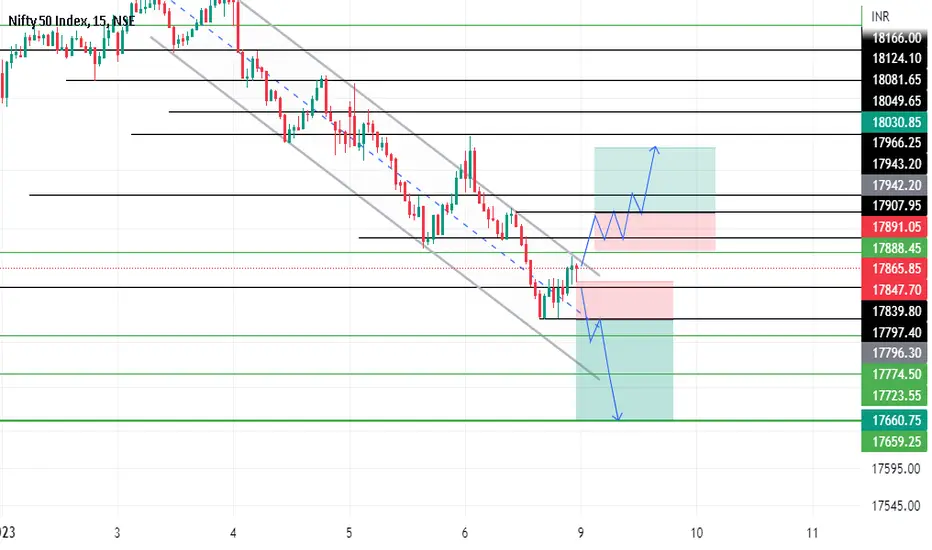
If price opens between 17860-17975
🟢 Buy CE Above 18010
✔️ Target Should be 18125
🔴 Buy PE below 17995
✔️ Target Should be 17775, 17675, 17575
Important Notes:
🚨 Gap-UP & Gap-Down more than 100 points wait for price action.
🚨 Gap-UP & Gap-Down up-to 60 points wait for a pullback.
⚠️ Wait for the 5-minute candle to close for confirmation.
⚠️ Trade Like Either SL or Target.
⚠️ Important: Always maintain your Risk & Reward Ratio.
Disclaimer:
I am not SEBI Registered Advisor.
My posts are purely for training and educational purposes.
Niftyanalysis

NIFTY FOR TOMORROW(10/01/2023)💚💚Hello ji,💚💚💚
==========================================================
Today NIFTY fully bears and i make a small profit.
And i hope you should also make a profit.
here in 15mins candle NIFTY small W PATTEN form ,
and a big reverse head and shoulder from.
Maybe market bullish for tomorrow..
==========================================================

Mid Week Nifty Analysis Support resistance 11th, 12th &13th JANMarket Outlook:
NIFTY is searching for support from where it can launch ahead in the global volatile atmosphere where Fed rate hikes are decimating the markets. Macros for India remain strong and in 2023 we should see Nifty hit the target zone in excess of 19400/19500+ but for now till we find a proper launch pad for Nifty it will remain weak or in consolidation phase.
Major Support Levels from here: 17867 and 17777 (Major Support below which bears can take over the show for a while). Below this zone supports are only at 17668 and 17496.
Major Resistance Levels from here: 18125, 18251 and finally 18404.5.
Long Term Target for 2023: 19441.


Trading plan for 10th January 2023nifty anf banknifty analysis and intraday plan in kannada.
This video if for information/education purpose only. you are 100% responsible for any actions you take by reading/viewing this post.
----Vinaykumar hiremath, CMT

NSE:NIFTY Analysis/Prediction for tomorrow 10-01-2023NSE:NIFTY Analysis/Prediction for tomorrow
For Flat Opening
🟢 Buy CE Above 18130
✔️ Target Should be 18240, 18345
🔴 Avoid PE
For Gap-UP Opening
🟢 Buy CE Near 18100
✔️ Target Should be 18240, 18345
🔴 Avoid PE
For Gap-Down Opening
🟢 Buy CE Above 18100
✔️ Target Should be 18240, 18345
🔴 Buy PE below 17995
✔️ Target Should be 17860
Important Notes:
🚨 Gap-UP & Gap-Down more than 100 points wait for price action.
🚨 Gap-UP & Gap-Down up-to 60 points wait for a pullback.
⚠️ Wait for the 5-minute candle to close for confirmation.
⚠️ Trade Like Either SL or Target.
⚠️ Important: Always maintain your Risk & Reward Ratio.
Disclaimer:
I am not SEBI Registered Advisor.
My posts are purely for training and educational purposes.

Pin Point Predictions Of Nifty For 10-1-23Hello Traders,
To make your daily trading easy , I on every evening post my analysis one part is in form of this chart and another form of my trade predictions can be seen below

Nifty buying and selling levelsHow to trade from now?
Nifty Buying only = above 18243.
Nifty Selling only = below 18073.
It's the analysis with paid atm machine indicator on hourly chart.
🌈 Advice: 1.) Take reversal trade near these levels, or
2.) Wait for Breakout and Sustainability.
📢 Disclaimer: We are NISM Certified so we don't hold any position in Nifty Future or Options as per SEBI guidelines. Take trades as per your own technical analysis, we are just educating you. We are not using any other indicators for finding out of levels ATM Machine Indicator Levels are plotted automatically.
🙏🏻 Come to Learn, Go to Earn🙏🏻
✅ We are NISM Certified. ✅
☔If you find us useful, Please help the helpless near you.☔
☺Happy to Help.☺

NIFTY FOR TOMORROW(10/01/2023) M PATTEN💚Hello ji, 💚💚
-------------------------------------------------------------------------------------
May yours day with profit.
Nifty goes up today Because of "IT STOCKS".
Nifty maybe trap. BE careful on Trading Time.
for tomorrow levels are drown check it.
-------------------------------------------------------------------------------------

NIFTY Weekly Volatility Analysis 9-13 Jan 2023 NIFTY Weekly Volatility Analysis 9-13 Jan 2023
We can see that currently the implied volatility for this week is 2.08%
With this in mind, currently from ATR point of view we are located in the 53th percentile.
Based on this, we can expect that the current weekly candles ( from open to close ) are going to between:
*For calculations, I am using the data since 2022*
Bullish: 1.83% movement
Bearish: 1.55% movement
At the same time, with this data, we can make a top/bot channel which is going to contain inside the movement of this asset,
meaning that there is a 24.2% that our close of the weekly candle of this asset is going to be either above/below the next channel:
TOP: 18325
BOT: 17584
Taking into consideration the previous weekly high/low, currently for this candle there is :
31.43% probability we are going to touch previous weekly high
66.58% probability we are going to touch previous weekly low
Lastly, from the technical analysis point of view, currently from
Daily timeframe indicates -26.67% BEARISH trend from the moving averages index
Weekly timeframe indicates 66.67% BULLISH trend from the moving averages index
Monthly timeframe indicates 80% BULLISH trend from the moving averages index

Nifty 50 index In nifty 50 index we will see some massive short covering above 18070
After we having a bearish harmonic prz of d leg at 18177 any breakout above 18250 we will see a good momentum upmove
View intact with buy on dips
Ask your financial advisor before taking any action based on my view
Only for educational purposes

Nifty 50 trade by chart pattern Nifty 50
1h timeframe
spotted a cup & handle pattern forming
Tomorrow's expected move is of 150-200 points , will take rejection from 18000 after a big upmove take the trade accordingly
(Bullish view)
Date : 09/01/2023

Trading plan for 09th January 2023nifty and banknifty analysis and intraday plan in kannada.
This video if for information/education purpose only. you are 100% responsible for any actions you take by reading/viewing this post.
----Vinaykumar hiremath, CMT

NSE:NIFTY Analysis/Prediction for tomorrow 09-01-2023NSE:NIFTY Analysis/Prediction for tomorrow
For Flat Opening
🟢 Avoid CE
🔴 Buy PE near 17950
✔️ Target Should be 17775
For Gap-UP Opening (Below 17950)
🟢 Buy CE Above 18050
✔️ Target Should be 18200
🔴 Buy PE near 17950
✔️ Target Should be 17775
For Gap-Down Opening
🟢 Avoid CE
🔴 Buy PE near 17800
✔️ Target Should be 17575
Important Notes:
🚨 Gap-UP & Gap-Down more than 100 points wait for price action.
🚨 Gap-UP & Gap-Down up-to 60 points wait for a pullback.
⚠️ Wait for the 5-minute candle to close for confirmation.
⚠️ Trade Like Either SL or Target.
⚠️ Important: Always maintain your Risk & Reward Ratio.
Disclaimer:
I am not SEBI Registered Advisor.
My posts are purely for training and educational purposes.

Sectors : Outperforming / Underperforming Nifty Sector analysis
Outperformers :
1. PSU Banks
2. Auto
3. Pvt Banks
4. Finance
5. PSE
6. Metal
7. Infra
Underperformers :
1. Energy
2. Commodities
3. Pharma
4. Realty
5. Media
6. IT

Nifty 09 Jan 23 to 13 Jan 23 Short ,Medium and Long TermNifty 09 Jan 23 to 13 Jan 23 Short ,Medium and Long Term
Nifty closed at 17859 ( Prev Close 18105) with touching peak 18232 recovered from low 17806.
Nifty formed double bottom chart pattern in back to back week.
Oversold zone as per RSI (37) , Stochastics (27)
& MACD is in red zone (-91) and Reversal sign might be achieved in this week.
Nifty short term
Index will be range bound from 17750-18550 till budget.
Need to cross firmly above sustain above 18000 followed by 18260 to reach initial target of 18330/18440 and 18550 in the coming weeks.
If it falls below the current level, the next support is at 17782/17566/ 17472 fib 0.618 retracement.
Medium term target
18900
Long term target 19500 and then to 20500.
Nifty Bank Index is also under oversold zone, Stocks like Axis Bank, Kotak Bank, Ujjvan Small Fin bank and BOB looks promising. Budget / Budget Expectation will take fresh high above 18550 or take it below 17750.

Nifty for week 9 Jan 2023 to 13 Jan 2023Weekly Analysis
Last week Nifty opens with a slight gap, tested the previous week high's though did not sustain at highs, and moved lower and closed near the week's low.
Formed: Bear Candle
Price action combined weeks: Sideways {Inside candle - the price has been consolidating in a candle range for the past two weeks}
Seems like the price would trade sideways in the coming week as well and the range can get narrower and time for strangles
Weekly Support at 17670- 17850
Weekly Resistance at 18200-18400

NIFTY 50 VIEWNifty taking support from previous reversal point.
Expected a up move from here till 18000-18150 levels. If the market reverse from 18000-18150 levels the breakdown of the next support 17800 is quite possible.
Trade safe. Manage risk. Be profitable.
Please follow us for more simple trading analysis and setups. Also let me know in the comment in case you have any queries.
Disclaimer :- This is just my view. Please analyze charts yourself and then decide to take any trades.

Possible Levels if we see an upside move, Situation 1 Hey guys, Sgx indicating a 150 points gap up on monday and if we are registering upside move then levels for coming days are as follows.

Nifty important levels for tomorrow, Monday, 9th June 2023Nifty important levels for tomorrow, Monday, 9th June 2023
*opinion, not advice*

Pin Point predictions Of Nifty For 9-1-23Hello Traders,
To make your trading easy posted this chart for 6-1-23 trading . Every marking on chart worked perfectly. To know more details for 9-1-23 check below .

Nifty Outlook For 9th to 13th January 2023. Nifty is looking very fragile and holding on to a major support right now which is near 17775. Mostly we should see turnaround for Nifty from this levels on Monday but in case this support is broken and we see this support broken, then we will see a freefall till the levels of 17668 and 17397.
Below 17397 we have major support of 50 Weeks EMA which is near 17336. Breaking 17336 can further empower the bears who can rule the roost from then on have a further Iron grip of the market. The resistance on the upper side are at 18000, 18125 and 18251.
A turnaround on Monday or Tuesday can bring things in balance otherwise investors will have a tough next week which can test their patience.
