NIFTY TRADE SETUP FOR 14/10/2022The wide range of Nifty is 16800-17500.
The trade setup is defined in Chart.
long Nifty above 17150 with only 17130 as a stop loss and sell nifty below 17060.
Niftyanalysis

Nifty Important levels and trade plan for Friday, 14.10.22On Daily time frame Nifty is currently sideways, and any move in either direction will make the market trending may be bearish or bullish.
For tomorrow, we will avoid doing directional trading between 17032 and 16997, and will go for bearish trade, below this zone, with limited quantity and tight stop loss up to the zone between 16927 and 16805. We may expect a reversal of Nifty from this zone. After Nifty crossing this zone, we will consider it to be bearish and will enter into bearish trade completely and may go for positional trades with a credit spread.
For bullish trade, will have to wait for Nifty to close above the no trade zone and preferably for a closing of a candle of 15-minute time frame. Our initial target will be 17098. Again from this level we may expect some correction.
For huge gap up or gap down opening, near the support or resistance levels marked, we may try to enter into scalping trades, but with minimum quantity and tight stop loss.
Will not consider OI data today.
.
*All support and resistance plotted are based on PDH / PDL . For any reversal after breaking PDH / PDL, support and resistance levels will be different*
**Time of plotting the levels and planning 13th October, 9:05 PM**
***Personal opinion, not a trading advice***

#NiftyDouble inside bar in Nifty
Nifty Gann date 13 Oct 22
Wait for break of range for trending move.

13/10/2022 BANKNIFTY SUPPORT AND RESISTANCE ZONE
Hello Guys, Good Morning
If Banknifty today sustain last day above it will go up.
either sustain bellow 38800 it will be go down

GENUS PAPER ON DAILY TIMEFRAME - BREAKOUT (TGT 26) Breakout From Upper Levels After Taking Good Support At 200 EMA On Daily Timeframe - CAN TGT FOR 25-26 LEVELS

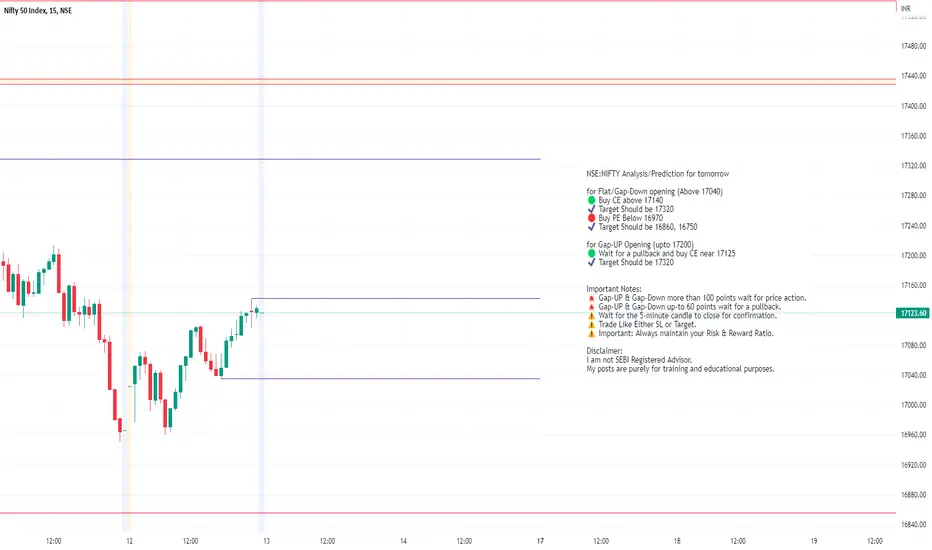
NSE:NIFTY Analysis/Prediction for tomorrow Expiry 13-10-2022NSE:NIFTY Analysis/Prediction for tomorrow
for Flat/Gap-Down opening (Above 17040)
🟢 Buy CE above 17140
✔️ Target Should be 17320
🔴 Buy PE Below 16970
✔️ Target Should be 16860, 16750
for Gap-UP Opening (upto 17200)
🟢 Wait for a pullback and buy CE near 17125
✔️ Target Should be 17320
Important Notes:
🚨 Gap-UP & Gap-Down more than 100 points wait for price action.
🚨 Gap-UP & Gap-Down up-to 60 points wait for a pullback.
⚠️ Wait for the 5-minute candle to close for confirmation.
⚠️ Trade Like Either SL or Target.
⚠️ Important: Always maintain your Risk & Reward Ratio.
Disclaimer:
I am not SEBI Registered Advisor.
My posts are purely for training and educational purposes.
Nifty daily analysis for 13/10/22(weekly expiry) Nifty on the daily time frame has formed an inside candle and gained 140 points . Market is still trading between both the moving averages.
The market, on the hourly time frame, has closed just above the 20 ema.
In second half of the trading session market has given a nice up move and took resistance from 17135 level.
Support:- 17065, 16990, 16920
Resistance:- 17135, 17170, 17230
Wait for the price action near the levels before trading the markets.

Nifty 50 | Price Action & Future | ExplainedSee how beautifully the price action is working on the NIFTY chart | Fully Explained
Recently horizontal trendline(one at the top) has reacted to its resistance, made a double top like structure and gave a gap down which will act like resistance in future.
.
After the gapdown it has reacted to the support which is in parallel trendline (2nd slant one) when the market started falling after Oct 2021 and the marked pointers show that it has significant importance and maybe also called polarity, which also coincides with the 3rd horizontal line which is also a support - so this should make a good support to NIFTY.
(Gapdowns are marked in circle to show that it act as resistance in future and it beautifully reacts with the 3rd horizontal line/support)
.
Now, with the future - I have marked the pointers again (on the right) up to the the 2nd horizontal line which is resistance acc. to me and guess what - when the 1st trendline (parallel one at the top) also coincides with the horizontal resistance.
Short Term - It should react soon with the resistance near 17400
Long Term - Once it crosses and sustains the levels above 17600 for 2-3 weeks, it'll definitely try to go again for ATH and with Indian Markets not much affected with Inflation and other various risks faced by other countries right now (ground level situation) - I have a full faith of this going ATH as specified in a Long Term.
.
As for the trendline drawn ignoring the 18000 levels - I may call this as Control by Exception (CBSE 12th Business Studies :P) - ignoring the fakeout or as they say some percentage while marking in the chart. The same thing is done from below(blue trendline) also.
Marking point to point will make you miss out certain things - so be flexible while marking.
This thing goes for all support, resistance, trendline and stoploss.
.
This is the beauty of Price Action, when you understand the wicks and its reaction - that will be the endgame.

Nifty 50 | Price Action & FutureNifty Update:
Nifty is following the price action which I have marked, as is. (You can check the attached Link to Related Ideas to access the same)
.
Touched 16750 and then reversed after touching the trendline (2nd Slant one) marked.
Went up to 17400, touched the resistance, which is again marked - Horizontal Line and then reversed.
and I am hoping that it'll touch 16700 again(Good Support) for gap filing(marked in july-august month) before moving up, which coincides with Diwali dates.
.
The chart explains the rest.


NIFTY50 is looking Bearish
🤑 Nifty is likely to be Bearish till it's below 17070.
❓ Reason: Because Bears Locker is open on ATM Machine Indicator Hourly Chart.
🚧 Dowside Hurdles: 16960, 16805, 16695.
🌈 Advice: 1.) Take reversal trade near these levels, or 2.) Wait for Breakout and Sustainability.
🔴 Positional Trend is Negative.
🟡 Long Term Trend is Neutral.
📢 Disclaimer: We are NISM Certified so we don't hold any position in Nifty Future or Options as per SEBI guidelines. Take trades as per your own technical analysis, we are just educating you. We are not using any type of indicators for finding out of levels.
🙏🏻 Come to Learn, Go to Earn🙏🏻
✅ We are NISM Certified. ✅
☔If you find us useful, Please help the helpless near you.☔
☺Happy to Help.☺

Nifty levels for 12 Oct 2022Good morning 🌞
Have a profitable day 💰👍🏻
Pre-Market Report 12 Oct 2022
SGX NIFTY is indicating a Flat opening
👉 SGX NIFTY is trading at 16964.5 up by 0.14%
👉 US futures are in RED
👉 ASIAN Market is in RED
👉 USDINR at 82.31
In Nifty 17000 PE and 17200 CE have high Open Interest in weekly
In Bank Nifty 38500 PE and 39000 CE have high Open Interest in weekly
👉 Asia-Pac Stocks Begin Subdued Following The Choppy Performance And Late Selling Stateside After BoE Governor Bailey Rejected Calls For An Extension To Gilt Purchases Beyond The Friday Deadline; ASX 200 (-0.1%), Nikkei 225 (-0.2%), KOSPI (-0.1%)
👉 STOCKS TO WATCH:
DELTA CORP, KIRLOSKAR ELECTRIC, L&T FINANCE, GENESYS INTL, SPANDANA SPHOORTY, SUZLON, TCS, RELIANCE, DLF, GUJARAT PIPAVAV
👉 Stocks Ban In F&O: Delta Corp, Indiabulls Hsg, India Cement
My view today 👉 Any gap up will again get correction today, I will look for a selling opportunity.

NIFTY 50, SHORT TERM PRICE ACTION!!"movement of prices, falling some strategy or a pattern(formed by psychology of buyers and sellers), makes up the price action"!!
i had previously brought up the trend of market, and market is yet respecting towards.
as previously said: INDIA is not in a recession. therefore nifty 50 is most unlikely to go below the support of 16700.
trend line is drawn, and check out the fibonnaci drawn from past two trading weeks, market has been respecting its levels very well.
its acting like a good support and resistance.
more updates will come on the same topic, stay connected!!!

Nifty Levels & Strategy for 12/Oct/2022Dear traders, I have identified chart levels based on my analysis, major support & resistance levels. Please note that I am not a SEBI registered member. Information shared by me here for educational purpose only. Please don’t trust me or anyone for trading/investment purpose as it may lead to financial losses. Focus on learning, how to fish, trust on your own trading skills and please do consult your financial advisor before trading.
NIFTY
Nifty continued to slide down. Today, again traders got buy on dips & sell on rise opportunities. Today also FIIs continued with their heavy selling in cash as well as F&O segments. Trader who traded patiently and waited for right trade setup then working level by level based on technical indicators were profitable today. (e.g. Breakdown trade below VWAP in 12:15pm candle worked really well).
Today US markets are trading in green. Let us hope for a pull back from lower levels. If FIIs/Big players do profit booking at lower levels then Indian indices will jump up in no time & bears may get trapped easily. Retail traders should trade only in monthly options with strict SL.
Shall we continue with sell on rise near resistance levels and buy on dips near major support levels????? Yes, I think so. What do you think?????
NIFTY SCORECARD DATED 11/OCT/2022
NIFTY IS DOWN BY -257 POINTS
Name Price Previous Day Change % Change
Nifty 16984 17241 -257.45 -1.49%
India VIX 20.49 19.62 0.87 4.42%
OPTION STATISTICS BASED ON 13/OCT/2022 EXPIRY DATA
Max OI (Calls) 17200 (Open Interest: 8991500, CE LTP: 35.5)
Max OI (Puts) 16000 (Open Interest: 5110100, PE LTP: 1.05)
PCR 0.52 (PCR is in highly oversold zone)
Nifty Calls:
ATM: Short Buildup, OTM:Short Buildup, ITM:Short Buildup, FAR OTM:Short Buildup
Nifty Puts:
ATM: Short Covering, OTM:Long Buildup, ITM:Short Covering, FAR OTM:Short Covering
Please do share your comments. Let us work & win together. Have a very happy, healthy & profitable day ahead!

Nifty daily analysis for 12/10/22Nifty on the daily time frame has formed a bearish engulfing candle. The markets opened flat and remained for selling whole day.
Nifty tried to recover after the initial fall but in the second half huge sell off was there.
On the hourly time frame, nifty took resistance from the 20 ema and a nice sell candle can be seen in the closing hour of the market.
In the first 15 minute candle, the market broke its 20 and 200 ema and took resistance from the levels. A bearish moving average cross over is also there.
The market has closed below the support level of 17k and another red candle can be there, if the market has decided its trend.
Support :- 16920, 16840,16750
Resistance:- 16990-17000, 17065, 17170
The market has clearly give an engulfing candle and as per the technicals it can be a signal of a bearish market.
Wait for the price action near the levels before entering the markets. Watch for the trend to continue for a swing/positional trades.

Nifty AnalysisNifty Short term - Up trend
Recent high 17429 made us change the wave count.
Expecting pull back towards 61.80% retracement of the entire fall i.e. 17580.

NIFTY 50, MARKET TREND!!INDIA WILL ALWAYS BE THE BEST INVESTMENT AT ANY ANY TIME. NIFTY 50 IS A GREAT INDICES TO BE INVESTED IN.
many of them ask will nifty 50 cross 18000 again this year, i say yes, and even say yes for one more question: will nifty 50 be still bullish in 2023.
there are many reasons of it, and i have covered it in my previous analysis(check the lin section).
i have drawn out the support and resistance based on the markets getting consolidated.
look at the FIBONNACCI RETRACEMENT, how greatly nifty 50 is respecting towards it.

NIFTY & BANKNIFTY INTRADAY VIEW FOR 10th Oct 2022NIFTY FUT Support - 17208/17140/17040 while Resistance - 17426/17472/17530. Nifty Fut closing price - 17328.85
BANKNIFTY FUT Support - 39060/38777/38606/38459 while Resistance- 39743/39925/40565 . BankNifty fut closing price- 39291.

Nifty 50 As Predicted Wave BBased on my previous chart nifty currently running close to 17000, as I mention on WAVE B will be 0.382 retrace based on previous Trend Based Fib Ext . Hope you traders will like it. I am very new to posting here so Don't forget to boost please, It will help to build some reputation here. Thanks for viewing and also thanks who liked my previous charts.

Nifty 50 Please mark below levels of NIFTY for 10-10-2022
it is purely a intraday support and resistance

NIFTY 50 NOT IN RECESSION!! DETAILED ANALYSISi have used a great colour to present my analysis.
so please go through the colours carefully.
INDIA is clearly not in recession, this makes us to understand its bottom point. lets start:
THE TWO BLUE LINES: represents the trend followed by NIFTY post corona's bull run.
and through drawing the PURPLE LINE, i have marked the bottom, and its area(sorry for the bad drawings :p)
i had followed the analysis by describing how that point i have marked is the recession point.
have a look at ORANGE LINE, its the bull run trend. after the bull run completed markets have consolidated(THE ORANGE CIRCLE)
FII entering in INDIAN markets made nifty to rise a more(till the orange circle)
DEFINING more about, THE ORANGE LINE, past from 23rd march till 12th April, nifty was on left side of the orange line, after that it came to other side. just a short observation of saying bull run got completed. (arrows are drawn have a good look).
THE TWO GREEN LINES are the support lines. now have a look at THE PURPLE ARCS. INDIA was not in a recession from the start so, it has just touched its support line, and never entered in recession. the same situation is now too.
check, THE DARK BLACK LINE, its the support line(which is supported many a times).
FINALLY, i conclude my analysis, where i have described how and where nifty 50 is in its position. i will post soon about its further trend lines(resistance and support).. stay connected!!

Nifty Levels & Strategy for 10/Oct/2022Dear traders, I have identified chart levels based on my analysis, major support & resistance levels. Please note that I am not a SEBI registered member. Information shared by me here for educational purpose only. Please don’t trust me or anyone for trading/investment purpose as it may lead to financial losses. Focus on learning, how to fish, trust on your own trading skills and please do consult your financial advisor before trading.
NIFTY
Nifty closed almost flat (-17 points) in red zone. FIIs as well as DIIs have added plenty of bearish positions in F&O. US market closed in red. Dow Jones (-630), Nasdaq (-446). We are all set for the gap-down on Monday. Global cues & overall trend has turned negative. Is sell on rise going to be better strategy for Monday trades with strict SL? Yes, I think so, What do your thoughts?
NIFTY SCORECARD DATED 07/OCT/2022
NIFTY IS DOWN BY -17 POINTS
Name Price Previous Day Change % Change
Nifty 17315 17332 -17.15 -0.10%
India VIX 18.81 19.32 -0.50 -2.60%
OPTION STATISTICS BASED ON 13/OCT/2022 EXPIRY DATA
Max OI (Calls) 18000 (Open Interest: 7713450, CE LTP: 2.45)
Max OI (Puts) 17000 (Open Interest: 4349600, PE LTP: 39.85)
PCR 0.77 (PCR is in bearish zone)
Nifty Calls:
ATM: Short Buildup, OTM:Short Buildup, ITM:Short Buildup, FAR OTM:Short Buildup
Nifty Puts:
ATM: Short Buildup, OTM:Short Buildup, ITM:Long Buildup, FAR OTM:Short Buildup
Please do share your comments. Let us work & win together. Have a very happy, healthy & profitable day ahead!

NIFTY BANK - Short Position We expect that price will go to the upwards and retest the 41800 resistance level. From latter, our expectation is the price will go to the downwards. RSI is overbought, and it indicates us that it is a selling opportunity however we expect that the price will have its last push towards ath.
Entry, stop-loss, and target levels in the chart.
