Nifty 50 broke out and retestedLet's what's in store for future, but for now market doesn't seem so strong for a bullish rally I'll wait till retested high gets broken.
Niftyanalysis

Nifty Levels & Strategy for 07/Oct/2022Dear traders, I have identified chart levels based on my analysis, major support & resistance levels. Please note that I am not a SEBI registered member. Information shared by me here for educational purpose only. Please don’t trust me or anyone for trading/investment purpose as it may lead to financial losses. Focus on learning, how to fish, trust on your own trading skills and please do consult your financial advisor before trading.
NIFTY
Nifty continued with it's excellent performance. Finally, we have seen decent profit booking action. Initially bulls got good chance to earn, later option writers took over and finally profit booking gave chance to bears as well. Overall, good recovery from 100 DMA in last few days but Nifty is still trading below 50 DMA. We need to trade cautiously at higher levels as US dollar index started heating up again.
NIFTY SCORECARD DATED 06/OCT/2022
NIFTY IS UP BY 58 POINTS
Name Price Previous Day Change % Change
Nifty 17332 17274 57.50 0.33%
India VIX 19.32 19.57 -0.25 -1.30%
OPTION STATISTICS BASED ON 13/OCT/2022 EXPIRY DATA
Max OI (Calls) 17500 (Open Interest: 4346500, CE LTP: 73)
Max OI (Puts) 17000 (Open Interest: 2472700, PE LTP: 59.35)
PCR 0.82 (PCR is in bearish zone)
Nifty Calls:
ATM: Short Buildup, OTM:Short Buildup, ITM:Short Covering, FAR OTM:Short Buildup
Nifty Puts:
ATM: Short Buildup, OTM:Short Buildup, ITM:Short Buildup, FAR OTM:Short Buildup
Shall we continue to look for buy on dips opportunity at support levels & sell on rise near resistance levels with strict SL?????
Yes, I think so in case we get quality trading setup in either direction. What do you think?
Please do share your comments. Let us work & win together. Have a very happy, healthy & profitable day ahead!

NIFTY RESISTANCE SPOTTED - SHORTS INITIATED!In this video -
1. Chart update
2. Trade setup
3. View for coming days/weeks/months.
Please do like, share & subscribe.
Also do comment your views for coming days.

Nifty Important levels and trade plan for Friday, 07.10.22On daily time frame Nifty is currently in a correction of an uptrend. So, for tomorrow, opening will play a major role in the direction of Nifty in coming days. If tomorrow Nifty opens flat or slightly gap down then we may expect the continuation of this correction phase. Here in 15-minute time frame, the range between 17378 and 17308 will be our no trade zone for tomorrow. Will go for bearish trade, after Nifty crossing the bottom of first five mute candle if opens flat or slight gap down. Initial target will be 17152 and form this level we may expect a reversal. Our second target will be 16981, but possibility of Nifty reaching that point will be very low. We will enter into bullish trade after forming a price action in 15-minute time frame, and crossing the top of no trade zone, in case of flat or slight gap down or slight gap up opening. Will wait for forming a proper price action before entering into a trade in case of a huge gap up or gap down opening. 17472 and 17559 will be the levels of concern in case of upside move.
*All support and resistance plotted are based on PDH / PDL . For any reversal after breaking PDH / PDL , support and resistance levels will be different*
**Time of plotting the levels and planning 6th October, 10:30 PM**
***Personal opinion, not a trading advice***
#NIFTY50

Nifty 50 Please find below levels of Nifty for 07-10-2022
it is purely intraday support and resistance.

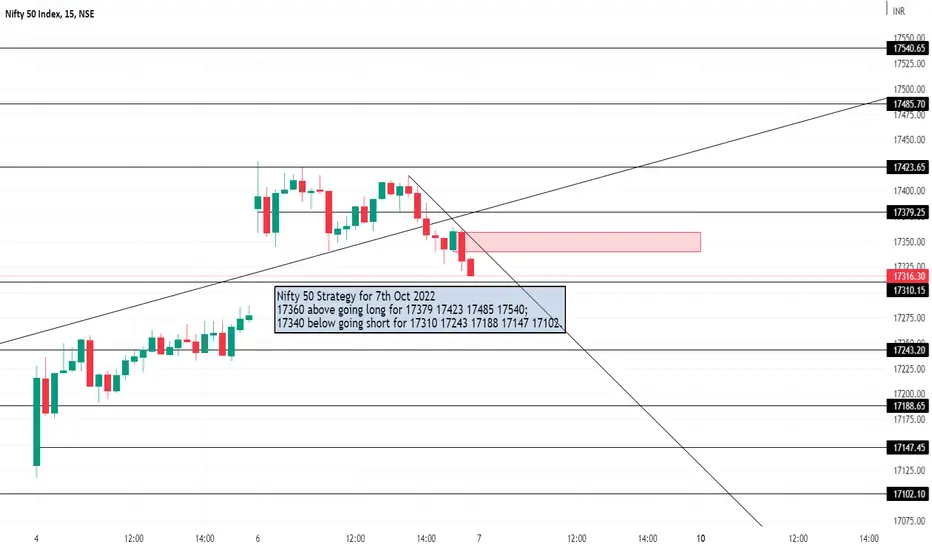
Nifty 50 Strategy for 7th Oct 2022Nifty 50 Strategy for 7th Oct 2022
17360 above going long for 17379 17423 17485 17540;
17340 below going short for 17310 17243 17188 17147 17102.
Nifty daily analysis 07/10/22.Nifty on the daily time frame has formed a doji candle. The market consolidated whole day and sell off in the second half of the trading session.
The market has taken support from the 20 DMA.
Market has gained only 50-60 points.
On the 15 minute time frame, market has closed below 20 ema.
Support :- 17260, 17230, 17170
Resistance :- 17360, 17410, 17480
Wait for the price action near the levels before trading the market.


Nifty 50 Please mark below levels of NIFty for 06-10-2022
it is purely intraday support and resistance

Nifty 50 Strategy for 6th Oct 2022Nifty 50 Strategy for 6th Oct 2022
17270 above going long for 1357 17414 17485 17540;
17255 below going short for 17147 17102 16993.

Nifty daily analysis for 06/10/22.Nifty after the initial gap up remained silent and moved slowly gaining around 400 points.
The market has crossed and closed above the 17270 level.
On the hourly time frame, the index opened above the 20 ema and remained between both the emas.
There is a bullish moving average cross over on a 15 minute time frame.
Support :- 16840, 16750, 16650
Resistance :- 16920, 16990-17000
The gap ups/downs are not giving much opportunity for the trend follower as there is no clear trend.
Wait and watch the price action near the levels before trading the market.

Nifty Important levels and trade plan for Thursday, 06.10.22*All support and resistance plotted are based on PDH / PDL . For any reversal after breaking PDH / PDL , support and resistance levels will be different*
***Personal opinion, not a trading advice***

NIFTY UP 400+ POINTS BEAR RALLYIn this video -
1. Chart update
2. Bear rally - SUPERFAST rally of nearly 500 points.
3. Views for upcoming days & weeks.
Please do like, share and subscribe.
Also do comment your view for coming days & weeks.

Nifty Levels & Strategy for 06/Oct/2022 ExpiryDear traders, I have identified chart levels based on my analysis, major support & resistance levels. Please note that I am not a SEBI registered member. Information shared by me here for educational purpose only. Please don’t trust me or anyone for trading/investment purpose as it may lead to financial losses. Focus on learning, how to fish, trust on your own trading skills and please do consult your financial advisor before trading.
NIFTY
Amazing performance by Nifty. Retail/HNIs traders were heavily benefitted & rewarded for their long positions. FIIs booked the loss & turned highly bullish for 6th Oct expiry. Today, Retails traders have heavily added bearish positions for 6th Oct expiry. Retail/HNI traders short covering may lift Nifty to high level. Today also US market is trading in positive zone.
NIFTY SCORECARD DATED 04/OCT/2022
NIFTY IS UP BY 387 POINTS
Name Price Previous Day Change % Change
Nifty 17274 16887 386.95 2.29%
India VIX 19.57 21.37 -1.80 -8.40%
OPTION STATISTICS BASED ON 06/OCT/2022 EXPIRY DATA
Max OI (Calls) 17500 (Open Interest: 7905950)
Max OI (Puts) 17000 (Open Interest: 7070200)
PCR 1.2 (PCR is in buying Zone)
Nifty Calls:
ATM: Short Covering, OTM:Long Buildup, ITM:Short Covering, FAR OTM:Long Liquidation
Nifty Puts:
ATM: Short Buildup, OTM:Short Buildup, ITM:Short Buildup, FAR OTM:Short Buildup
Shall we look for buy on dips opportunity at support levels & sell on rise with strict SL at higher levels as long as Nifty trading within a range? Yes, I think so. What do you think?
Please do share your comments. Let us work & win together. Have a very happy, healthy & profitable day ahead!

Tuesday Market Outlook / Nifty Outlook For Reminder of the weekNifty is trying to break free from the bear grip on the basis of Global rebound seen around the indices across the globe. Real bullish break out in true sense will be when Nifty is able to break out and sustain above 17435 on weekly closing basis.
Support for spot Nifty will be at 17026, 16888, 16749 and finally 16461.
Resistance for spot Nifty on the upper side will be at 17270, 17435, 17646 and finally 17910.

Nifty Levels & Strategy for 04/Oct/2022Dear traders, I have identified chart levels based on my analysis, major support & resistance levels. Please note that I am not a SEBI registered member. Information shared by me here for educational purpose only. Please don’t trust me or anyone for trading/investment purpose as it may lead to financial losses. Focus on learning, how to fish, trust on your own trading skills and please do consult your financial advisor before trading.
NIFTY
Nifty was clearly choppy and trading within a range. It has touched day's lower & upper range perfectly as per chart posted yesterday. US/Global as well as Indian markets became highly volatile. Nifty is down significantly but still closed above 50 DMA. Bulls Vs Bears fight is going on. It will interesting to watch Nifty will break the range on long or short side.
NIFTY SCORECARD DATED 03/OCT/2022
NIFTY IS DOWN BY -207 POINTS
Name Price Previous Day Change % Change
Nifty 16887 17094 -207.00 -1.21%
India VIX 21.37 19.97 1.40 7.00%
OPTION STATISTICS BASED ON 06/OCT/2022 EXPIRY DATA
Max OI (Calls) 17000 (Open Interest: 7613750)
Max OI (Puts) 16000 (Open Interest: 5032350)
PCR 0.67 (PCR is in oversold zone)
Nifty Calls:
ATM: Short Buildup, OTM:Short Buildup, ITM:Short Buildup, FAR OTM:Short Buildup
Nifty Puts:
ATM: Short Covering, OTM:Short Covering, ITM:Short Covering, FAR OTM:Short Buildup
Shall we look for buy on dips opportunity at support levels & sell on rise with strict SL at higher levels as long as Nifty trading within a range? Yes, I think so. What do you think?
Please do share your comments. Let us work & win together. Have a very happy, healthy & profitable day ahead!

Nifty 50 Strategy for 4 Oct 2022Nifty 50 Strategy,
16900 above going long for 16993 17102 17156 17243;
16875 below going short for 16858 16801 16661 16475.

Nifty daily analysis for 04/10/22Nifty on the daily time frame has given a negative candle and has closed 200 points lower.
The market has taken support from its 200 DMA and has closed near the level.
On the hourly time frame, the market remained for selling.
Though, the market tried to hold the 17000 level, but in the second half a huge sell off broke the level and even traded below the 20 ema.
The market has formed an inside candle and closed below both the moving averages.
Support :- 16840, 16770, 16650
Resistance:- 17000, 17065
As predicted the markets are still in a bearish territory and couldn't hold above the 17000 level.
Wait for the price action near the price level before entering the markets.

NSE:NIFTY Analysis/Prediction for tomorrowNSE:NIFTY Analysis/Prediction for tomorrow
for Flat opening
🟢 Avoid CE
🔴 Buy PE Near 16950
✔️ Target Should be 16800
for Gap-UP Opening
🟢 Buy CE near 16890
✔️ Target Should be 16945, 17045
🔴 Buy PE Near 16950
✔️ Target Should be 16800
for Gap-Down opening
🟢 Avoid CE
🔴 Buy PE Near 16880
✔️ Target Should be 16800, 16750, 16600
Important Notes:
🚨 Gap-UP & Gap-Down more than 100 points wait for price action.
🚨 Gap-UP & Gap-Down up-to 60 points wait for a pullback.
⚠️ Wait for the 5-minute candle to close for confirmation.
⚠️ Trade Like Either SL or Target.
⚠️ Important: Always maintain your Risk & Reward Ratio.
Disclaimer:
I am not SEBI Registered Advisor.
My posts are purely for training and educational purposes.

NIFTY 50- CORRECTION WAVES!!!i was waiting when the market will open and my waves will get confirmed, today by a gap down opening, and not breaking out the trend line, i was final with my 5 wave correction. nifty will correct till 16550 level. this week will go in a correction.
HAVE A GREAT LOOK ON THE RSI TOO.

NIFTY50 is looking Bullish.🤑 Nifty is likely to be Bullish till it's above 16930.
❓ Reason: Because there is ATM Machine No trade Zone Bottom Point.
🚧 Upside Hurdles: 17100, 17240.
🌈 Advice: 1.) Take reversal trade near these levels, or 2.) Wait for Breakout and Sustainability.
🟢 Positional Trend is Positive.
🟢 Long Term Trend is Positive.
📢 Disclaimer: We are NISM Certified so we don't hold any position in Nifty Future or Options as per SEBI guidelines. Take trades as per your own technical analysis, we are just educating you. We are not using any type of indicators for finding out of levels.
🙏🏻 Come to Learn, Go to Earn🙏🏻
✅ We are NISM Certified. ✅
☔If you find us useful, Please help the helpless near you.☔
☺Happy to Help.☺


Nifty 50 Please Mark below levels of Nifty for 03-10-2022.
it is purely intraday levels, use it 5 mins TF
