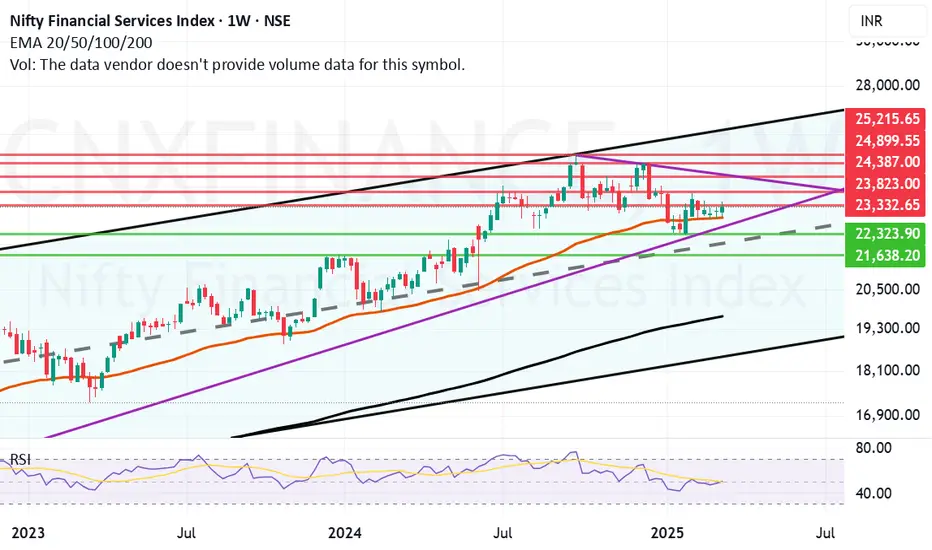
Index Of The Week: Nifty Financial Services. The index that did very well this week and which has potential to carry forward the momentum into the next week seems to be the CNX Financial Service index.
The Financial index looks strongly placed above Mother Line of 50 Weeks EMA line. The resistances it faces or can face if it moves upwards can be 23332 and 23823. The next resistance for CNX Financial services is a major trend line hurdle at 24387. Crossing this can give the index a major breakout and a Free run towards 24899 or even 25K plus levels. The support for CNX Finance is the Mother line at 22890 and 22323. There is also a trend line support at this level. Falling below this level can see CNX Finance drop rapidly towards 21638 or below levels.
Now if this breakout actually happens in the Nifty Financial Services Index the stocks that composites the Finance index will be the beneficiary in general. Some might benefit more some might benefit less and some might not benefit but for index to move upward the stocks composing it have to perform well. To know which stocks will do better than others we will have to look at their individual charts. The stocks which make the Nifty Financial Serviced index are HDFC Bank, ICICI Bank, Kotak Bank, Axis Bank, Kotak Bank, SBI, Bajaj Finance, Bajaj Finserv, HDFC Life, SBI Life, Shriram Finance, Cholamandalam Investment and Finance, PFC, REC, SBI Cards, ICICI Lombard, HDFC Asset Management, SBI Cards, ICICI Prudential Life, LIC Housing Finance, Muthoot Finance and IEX. The Index Can Perform if the majority constituents or the stocks with heavy weightage perform. Some of these stocks can perform others might not. Choose wisely after consulting your investment advisor, studying fundamentals and Technicals of each company.
Disclaimer: The above information is provided for educational purpose, analysis and paper trading only. Please don't treat this as a buy or sell recommendation for the stock or index. The Techno-Funda analysis is based on data that is more than 3 months old. Supports and Resistances are determined by historic past peaks and Valley in the chart. Many other indicators and patterns like EMA, RSI, MACD, Volumes, Fibonacci, parallel channel etc. use historic data which is 3 months or older cyclical points. There is no guarantee they will work in future as markets are highly volatile and swings in prices are also due to macro and micro factors based on actions taken by the company as well as region and global events. Equity investment is subject to risks. I or my clients or family members might have positions in the stocks that we mention in our educational posts. We will not be responsible for any Profit or loss that may occur due to any financial decision taken based on any data provided in this message. Do consult your investment advisor before taking any financial decisions. Stop losses should be an important part of any investment in equity.
Niftyfinancialservices
Bajaj FinanaceImportant points marked.
*****Education purpose only*****
*****Investing in Equity is subjected to market risk do own research before investing*****

NIFTY FIN. SERVICEThe validity of this chart remain true below todays high.
This looks like a) wave upside and heading for b) wave downside and then an upward move may come for c) wave. This is just a view...no buy sell reco.
Pls follow your own analysis for any trade/investment.
Regards

Gapped But Not ForgottenFINNIFTY after a series of up sharp down moves is headed towards the zone where an earlier gap was not met. From my recent experience, gap up and gap down are always filled back either in the short term or a while after. Here we see FINNIFTY heading back to the unfilled zone which lies between 21305 to 21285.
After a heavy downfall today, the index formed a symmetrical triangle pattern which could possibly head to clear the old dues. Also, just below the unfilled zone lies the recent touch zone of 21280 to 21270 having served as previous support & resistance in December 2023. Whether that happens tomorrow or not, it is yet to be seen.

Muthoot : Riding high Target 2500Highest EPS Sept Quarter of 26.4 from Rs 24.2
Riding high the Credit Boom for NBFC's.
technicals:
1. 45% Trendline
2. 50/100/200 DMA support at current levels ( divine intervention)
3. Momentum INdicators Oversold.

NIFTY FINANCIAL SERVICES DETAILED ANALYSIS. FUTURE TREND!!I have drawn many things in this idea, stay with me till the end, and I will clear you.
first, let me talk about the future trend(because based on that and my prediction I have drawn the rest drawings), the future trend is the dark black line(drawn both support and resistance). the trend is based on the markets getting consolidated and its reaction shown by nifty finserv components.
now how is that trend came to surety says the pullbacks drawn by arcs circle and arrows.
i have drawn many of them, have a good good at those, those are majorly pullbacks and pullouts. its just that the market was very volatile at that time, like FII SELLING, DII BUYING, interest rates, money incoming etc..
so that made to disturb the trend, but we get to know it by the pull back strategy.
now if you looked very carefull you could observe that the last arc drawn is in black, because nifty finserv, did not supported my trend, that actually because major FII selling had come on.
like in major stocks like hdfc, icici, bajaj finance. banking stocks and bajaj finance(one to give high returns), sum the nifty finserv about 85%. thats a lot, so mostly nifty finserv is very closely related to bank nifty chart.
since bank nifty chart has almost reached its top and making new ATH, this says that nifty fin serv, is at a very discounted, and at any time rally could come in. but this rally could be defined when US markets react positive and FII selling starts coming. and which is already started.
DISCOUNTED STOCKS are meant by those which has a good possibility to go up. stocks such as hdfc, kotak, bajaj finance are much in discounted. icici bank has given a good rally, and same acts for SBI.
the next part is the brush drawing: i feel that market could be volatile for several days/weeks because nifty50 is a bit overvalued so this could afraid the market to go in a buy side. there could be a clash of buying and selling, mostly giving some doji candles. if such happens, then January of next year, could be a great possibility to give a bull rally, in nifty finserv components. although this volatile theory could go wrong if market directly sees an upmove, instead of waiting much. to add on as a final point, markets where volatile at the time from AUG- OCT, after a bull rally came in. such case could be possible but this volatile market could be a small one, since many things have been formulated, and bad things(like global conditions, no need to mention it) are coming to an end.
the price action and following trends is the best thing. mark some good levels in your chart, and check the trend, based on that start taking positions.

REC LTD - BULLISH ENGULFING 📊 Script: RECLTD (REC LIMITED)
📊 Nifty50 Stock: NO
📊 Sectoral Index: NIFTY FINANCIAL SERVICES / NIFTY MIDCAP 50
📊 Sector: Financial Services
📊 Industry: Finance Institution
Key highlights: 💡⚡
📈 Script is trading towards upper band of Bollinger band (BB).
📈 Already crossover in MACD .
📈 Already Crossover in Double Moving Average.
📈 Double candlestick pattern BULLISH ENGULFING seen which indicate Bullishness in stock.
📈 Right now RSI is around 70.
📈 One can go for Swing Trade.
⏱️ C.M.P 📑💰- 105.45
🟢 Target 🎯🏆 - 114/117
⚠️ Stoploss ☠️🚫 - 100
⚠️ Important: Always maintain your Risk & Reward Ratio.
✅Like and follow to never miss a new idea!✅
Disclaimer: I am not SEBI Registered Advisor. My posts are purely for training and educational purposes.
Eat🍜 Sleep😴 TradingView📈 Repeat🔁
Happy learning with trading. Cheers!🥂
