NIFTY: Monthly to 3 min Analysis NIFTY : Month
Based on this analysis : Nifty is trading near support. once its sustain here, we may see again new ATH
Like, Share, Comment for regular updates.
Disclaimer
I am not sebi registered analyst
My studies are Educational purpose only
Please consult with your Financial advisor before trading or investing
Niftyindia

Nifty vs Other Sectors Relative PerformanceNSE:NIFTY
from July bottom from where nifty started the rally these are the leaders and laggards
Leaders
REALITY
ENERGY
IT
PSU BANKS
Laggards
PHARMA
METAL
FMCG

Bulls Need to Rest Hi
In Nifty, bulls will take some rest from now onwards & bears will take part or we can say profit booking will come in Nifty or Indian Stock Market.
Go long with Strict SL or be on sideline for time being.
Have a great week ahead !!!!

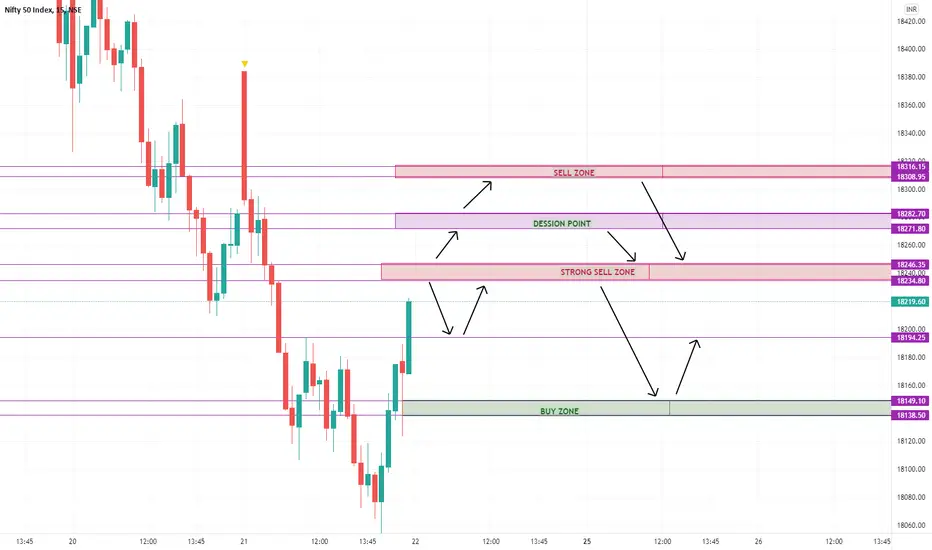
Nifty level 22 Oct 2021please check level ......................................................................
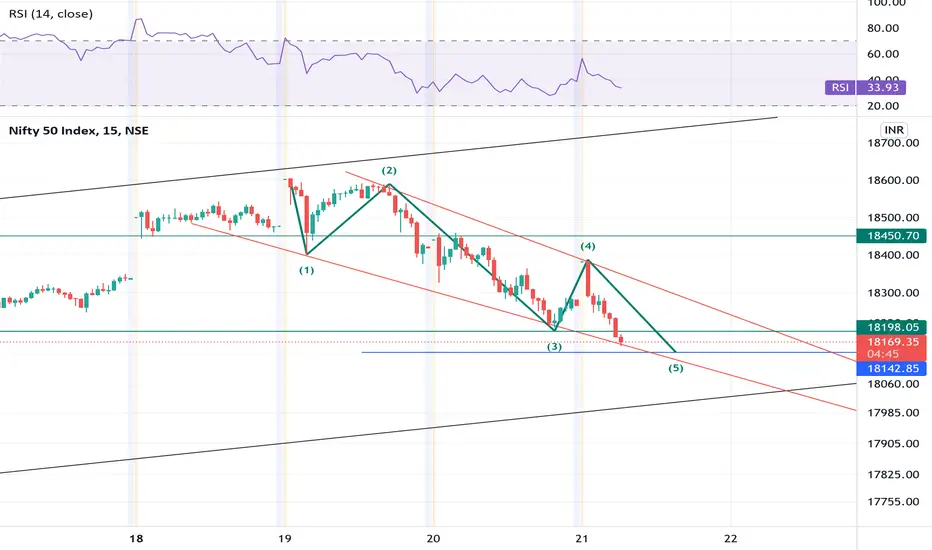
Nifty Zig Zag Hi
Bulls no need to panic.....Nifty is doing ZIG ZAG Correction will get over soon.
Hold on to your nerves.....!!!
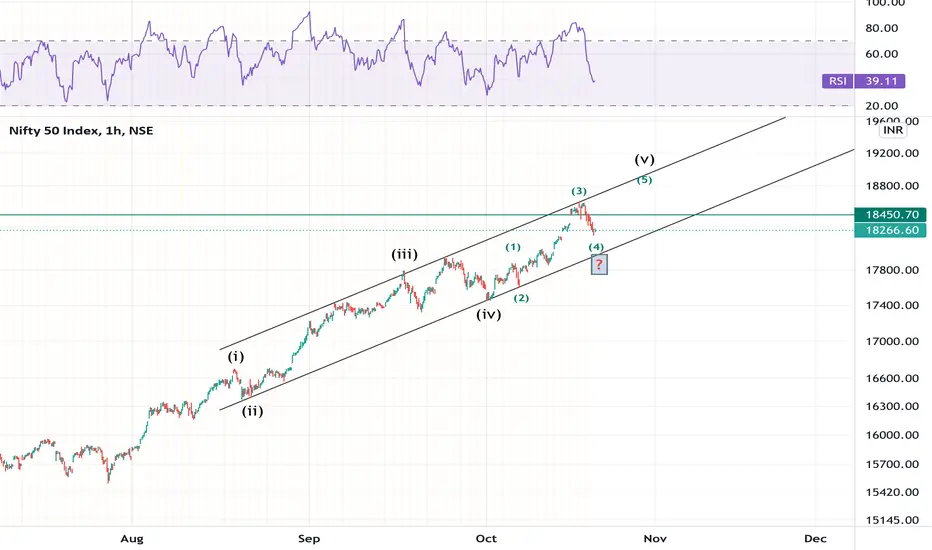
Nifty - Bulls will take control Hi
As per findings looks like 5.4. looks complete, if yes then Nifty will not find any hurdle @ 18430 - 18450 & soon will see new ATH or still anything pending on down side then it will find hurdle on these level & will see on more low for further up move (ATH).
As the channel drawn on chart nifty will travel in it only to reach new ATH.
Any of you carry long position so keep your stop loss 18240 or hedge the position....!!!
Have a great trading day....!!!
NIFTY FUTURES SHOW both sidesNifty- huge long positions were build on 5 days future data, huge calls were short in option chain, no build up on put side, people are in fear market will fall, but tomorrow will be up and down day both. as market will go down and up both side. as the data suggest. as fii and hni were buying in index futures to give jump and also buying puts to let indexes down in starting, so data is more negative as per options and positive as per index futures. market will show both red and green, similar story in bank nifty also.

nifty50 intraday levelsImportant Levels for nifty intraday, UP TRAND OR CORRECTION
PLEASE LIKE,SHARE AND FOLLOW.............................................

Nifty Expected levelsIndex Analysis: Nifty has formed the triangle pattern and broken upper trend line it looks good buy immediate demand zone with below demand zone as stop loss for the target given on the chart. let's see
Happy Trading.

Nifty Update for 18th October 2021
We will see a flat to a positive opening in Indian Indices today as per IN50USD data.
NIFTY50 Index is trading at a supply zone/PRZ zone which we have calculated using our HARMONIC XABCD Pattern.
Today Index has a narrow trading range, and we may see the Index trading on both sides today.
Nifty Major resistance 18,400 levels.
18,240 will act as a support.
For Buying (long)
Consider a buying position above 18,360 for the targets of 18,400/18,420/18,450
For Selling (short)
Consider a short position only below 18,305 for the targets of 18,290 to 18,260
Be careful the range is small, and we'll see the movement on both the sides, Quick profit booking suggested.
Trade setup
==============
Key RESISTANCE is: 18,400
Key SUPPORT is: 18,240
Trade Accordingly!

nifty50 intraday levelsImportant Levels for nifty intraday, UP TRAND OR CORRECTION
watch stock analysis video linked below
PLEASE LIKE,SHARE AND FOLLOW.............................................

Nifty 50 Trade setup for 13th October 2021Good Morning Everyone,
In yesterday's trading session, The Index has managed to close above 18,000, a sign of strength. We know the trend is still bullish, and the index has broken an Important level, but the main question is intraday because of both sides' moves. Intraday is very tricky in today's trading session because only 24 hours left in the expiry.
The market structure is bullish in the hourly time frame and making higher highs. Harmonic ABCD pattern has given a dot reversal in Monday trading session and create a range that is valid for today's trading session. We will see a direction on a breakout; otherwise higher chances to see the range again.
Trade Setup
==================
Build long Position if the Monday high of 18,050 broken for the target of 18,150 and 18,200.
Short Position can build lower than 17,940 for the targets of 17,900 and 17,850
Trade setup
==============
RANGE HIGH: 18,050
RANGE LOW: 17,940
Essential support is: 17,800
Key Resistance is: 18,200
Trade Accordingly

Nifty still has UPSIDE hi...
If nifty hold 21/09 low then upward journey......for all long SL should 21/09 low.....!!
"A good trade always give mental satisfaction"

Nifty Update for 08th October 2021 index has been seen trading in a narrow range with volatility. 17,800 to 17,900 is a 100 point no trading zone and also an indecision point.
Consider a buying position above 17,900 for the upside targets of 17,950 and 18,000.
18,000 will act as a resistance as it is a psychological level.
Below 17,800 Index can fall till 17,700 as it is a dynamic support.
We may see a range bound session as there is not much room on either side for Intraday.
Trade setup
==============
Key support is: 17,700
Key Resistance is: 18,000
High probability of a sideways market today. Use your trading sense to trade.
Trade Accordingly!

NIFTY, RSI showing divergence - is it Trend reversal ❓🛑 NIFTY forming Higher highs in 4 Hour time frame , whereas RSI indicator showing divergence ,
By forming Lower lows
◽ Possible trend reversal may occur
◽Nifty as to close above 18000 otherwise , market will be weaker
◽Crude oil testing 3Y highs
◽Bond prices were increasing
◽ Inflation is an another concern
◽ Now everyone eyes and Everything depends on RBI event , RBI will likely to announce the Repo n Reverse Repo rate tomorrow morning
If you like it do follow for more ,
Have a good day 😊

NIFTY LEVELS FOR THE DAYSince nifty opened gapped up above the immediate supply zone, hence here a new level, where the nifty could take the resistance today.
Index may trade choppy in today's session

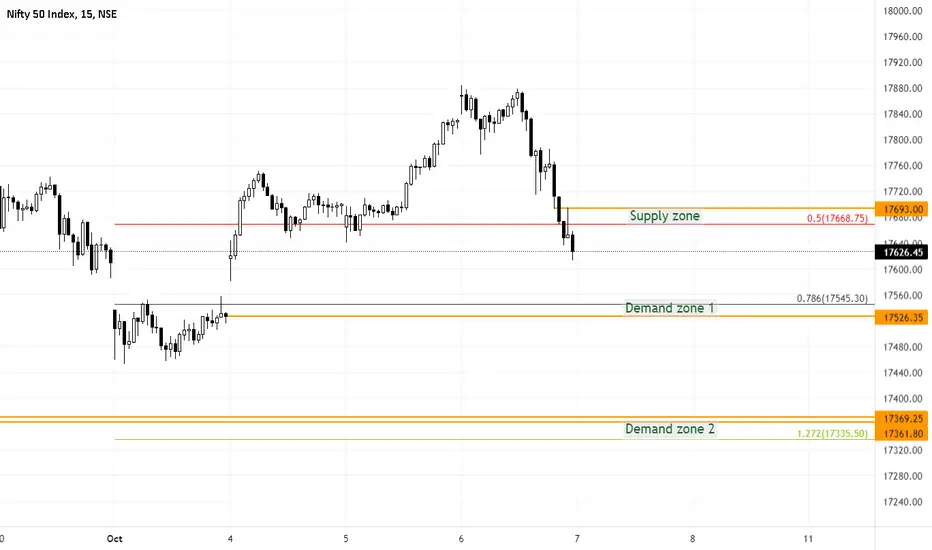
NIfty supply and demand zone for 7 oct 2021Nifty supply and demand zone for 7 Oct 2021
Supply zone: 17668-17693
Demand zone: 17526-17545
Demand zone: 17335-17370
NIFTY NEXT WEEKNIFTY correction is not simillar to S&P500 correction pattern.(ZIGZAG)
Here wave''B'' extended beyond start of wave''A'' which can turn into IRREGULAR or EXPANDED FLAT correction.
This is confirmed on friday's price action( Y>1.618 *W).
Expect a flat ''X'' wave for three days upto 17628 and take a short position on 6th OCT 21, to profit on short side when wave''Z'' unfolds .

Nifty Uptrend Hi
Nifty still in uptrend....no need to panic for today gap down as it will be a good buying opportunity.....go long on every dip.....17850 with the stop loss of Friday low...!!!!
Have a great day.....

NIFTY 50 analysis for Tuesday ❗Hii Traders 😊 ,
Welcome to NIFTY 50 Futures and options analysis for intraday trading ......................
🛑 Nifty will be stronger above 18000 zone which crucial resistance zone if failed to close above that zone then we can see some correction in market it may can test the 17000 levels This will be crucial for nifty to sustain above the level until then market will be weaker
🛑 Currently it is trading above 21Day ,50 Day, 100 Day moving averages
🎯 Key levels to watch out intraday levels for day trader
🛑 Major resistance zone for Nifty is at 17760-17790
◽ If market breakout resistance zone then we can see Target of 17880 as first target (if we see the Option chain data here 17800 CE holds more short position and next strike is 18000CE)
◽ Stop loss for this level is 17700
🛑 Major support level for Nifty 50
◽ Support level for nifty lies at 17530-17500
◽ If breakdown happens we can see the 1st Target of 17400
◽ stop loss ie .17580
🛑 levels for Nifty Futures will be as follows
◽ Go long on nifty Futures if it breakout our resistance
◽ Don't short the market until below the 17500
◽In between range is indecisive don't go long or short anything can happen
🛑 Tradeshots
◽ Resistance level for CE buyers /option buyers is at 17760-17790
◽ support zone to buy PUT / PE is at 17530-17500
◽ Nifty will be weaker on intraday basis below the 17500
Thanks for reading,
If you like it do follow for more and give reputation which will boost mine confidence to do more.
have a nice day 😊

Nifty Zigzag Short Can be hold with todays high till & traget expected down side 17550.....rest destiny...!!

Nifty level for 30 sept 2021same level as yesterday . nothing changes pls check yesterday level and see how market respect our level

Nifty 15mins forming Symmetrical Triangle 29 Sept 2021Nifty 15mins forming Symmetrical Triangle. Watch for breakout. 29 Sept 2021
